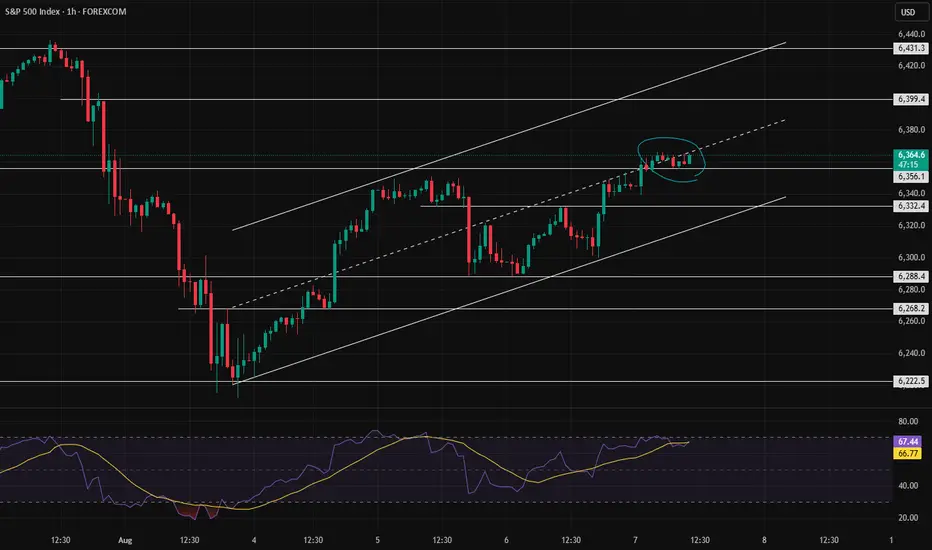
Decision pointThe weakness of the trend is clearly visible, but we need to see how it reacts to the channel’s midline. If buying pressure increases, the price could reach 6400. Otherwise, a correction down to around 6330 is likely.
Harmonic Patterns
1.17171 is the decision point.As long as the price hasn't reached that level, no position should be opened.
We need to wait for it to reach that level and then, based on the reaction to that point, see whether the trend will continue or turn bearish.

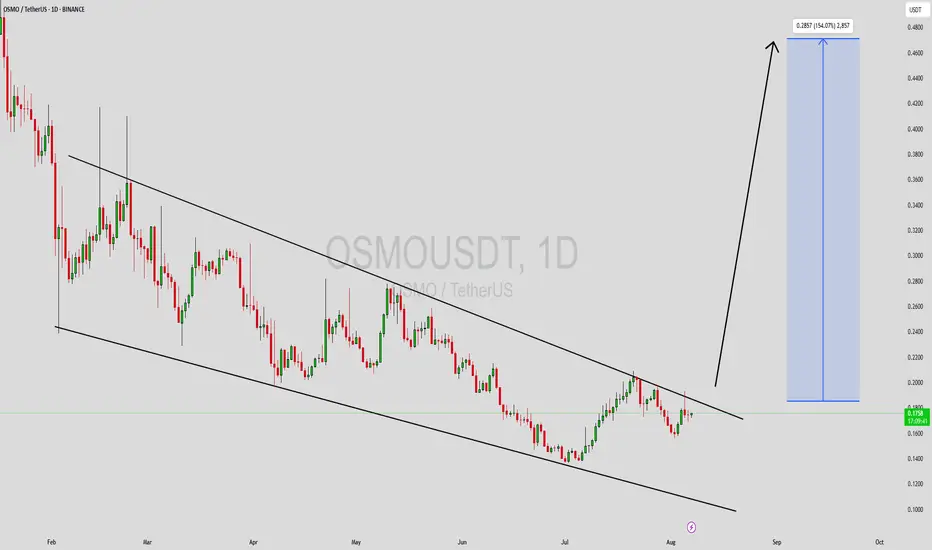
OSMOUSDT Forming Falling WedgeOSMOUSDT is currently displaying a well-formed falling wedge pattern, a classic bullish reversal signal that often precedes strong upward momentum. This pattern is characterized by a narrowing price range, which reflects decreasing selling pressure and a potential shift in market sentiment. As the wedge tightens, a breakout becomes increasingly likely—especially when accompanied by growing volume and investor interest as seen in the recent OSMOUSDT price action.
The falling wedge setup on OSMOUSDT is further supported by a notable uptick in volume, signaling that accumulation may be underway. Historically, falling wedges break to the upside with strong momentum, often leading to rapid price expansion. In this case, the projected upside move is estimated to be in the range of 140% to 150% from current levels. This makes OSMO one of the more attractive breakout candidates in the mid-cap altcoin space, especially for traders seeking high-reward setups.
The overall market sentiment around Osmosis has also been increasingly positive, with more eyes turning toward decentralized finance projects and blockchain infrastructure plays. OSMO, being a core player in the Cosmos ecosystem, is well-positioned for strong speculative interest, particularly as its technicals align with favorable chart patterns and renewed on-chain activity.
For those tracking breakout patterns and looking to capitalize on explosive moves, OSMOUSDT offers a technically sound and timely opportunity worth serious consideration.
✅ Show your support by hitting the like button and
✅ Leaving a comment below! (What is You opinion about this Coin)
Your feedback and engagement keep me inspired to share more insightful market analysis with you!
AUDCHF potential LONG positionAUDCHF Analysis (4H / Weekly Confluence)
The overall trend remains bullish, following a strong rejection from weekly resistance. This move was supported by a bullish Bat harmonic pattern, which marked a potential reversal point.
Price has since been forming an ascending triangle structure, with higher lows consistently pressing against a flat resistance near 0.5265. This pattern often signals accumulation and builds pressure for a breakout.
Momentum indicators like RSI also support the bullish bias, as the market compresses under key resistance.
I’m watching for a confirmed breakout above 0.5265, ideally followed by a brief retracement into the swap zone, before continuation upward.
Target Levels:
TP1: 0.5350
TP2: 0.5400
Let’s see how this plays out. Open to feedback and alternate views!

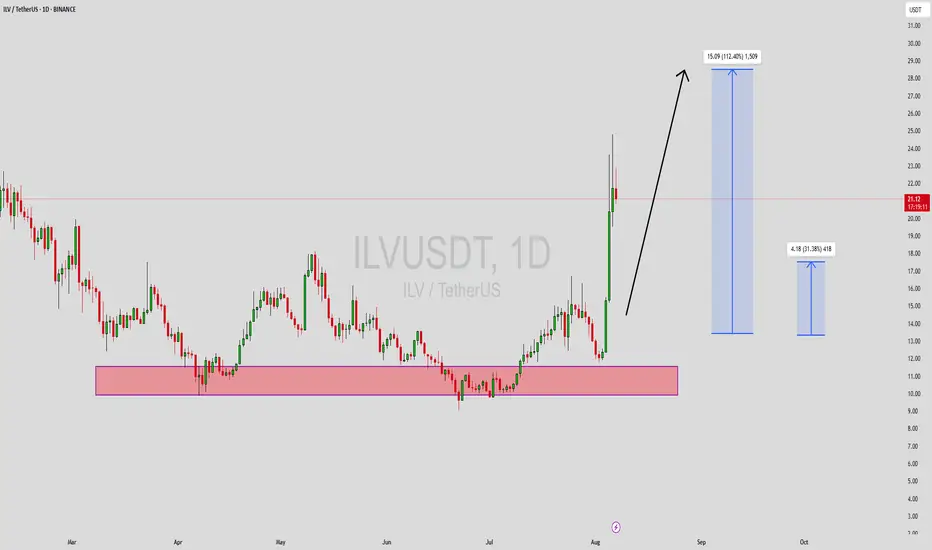
ILVUSDT Forming Bullish MomentumILVUSDT (Illuvium/USDT) has shown an impressive breakout from its recent accumulation zone, with a strong bullish momentum that’s caught the attention of smart money and retail investors alike. The price action reflects a clean recovery from a solid demand zone, where accumulation occurred for several weeks. Now that the resistance has been broken with strength, ILV is poised for further upside, and the current projection suggests a possible 100%+ gain, targeting the \$29-\$30 range.
What makes this setup more compelling is the sharp vertical movement, supported by a spike in volume, indicating institutional interest. ILV has historically delivered aggressive rallies following long consolidations, and the current breakout structure mirrors those previous bullish cycles. The daily chart clearly shows the strength of the impulse wave, and with no immediate resistance in sight until much higher levels, the risk-reward remains in favor of the bulls.
Fundamentally, Illuvium remains one of the more promising GameFi projects, combining AAA gaming quality with DeFi integration. As Web3 gaming continues to attract attention, ILV stands out as a top contender in this space. With the renewed interest in altcoins, ILV could outperform many of its peers, especially if bullish sentiment across the market persists.
This is a textbook momentum breakout setup backed by volume, fundamentals, and strong community backing. Traders looking for high-reward setups should keep ILVUSDT on their radar for potential continuation.
✅ Show your support by hitting the like button and
✅ Leaving a comment below! (What is You opinion about this Coin)
Your feedback and engagement keep me inspired to share more insightful market analysis with you!
MEW/USDT Retesting Key Zone, Ready for the Next Move?📊 Technical Analysis:
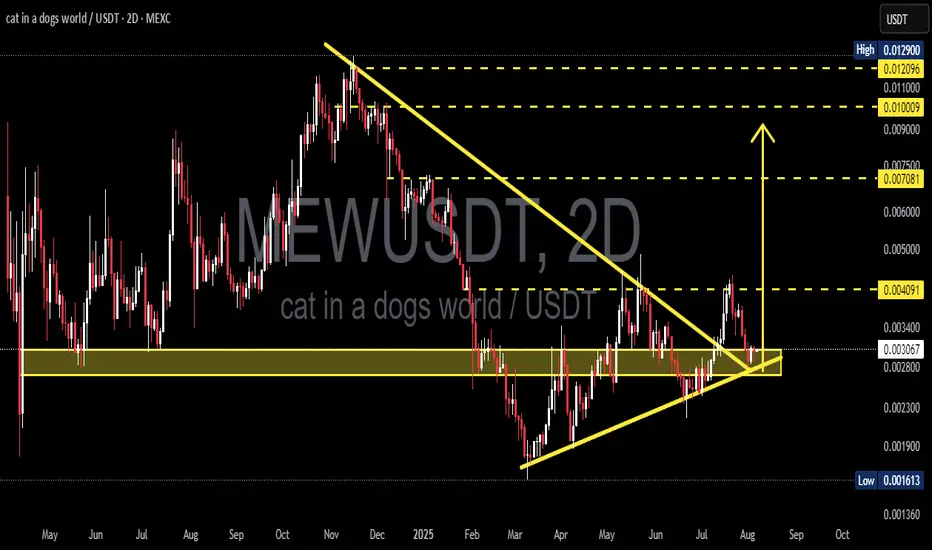
MEW/USDT on the 2D timeframe shows a compelling structure with a Symmetrical Triangle pattern breakout that occurred in late July 2025. This breakout indicates a potential trend reversal from bearish to bullish.
Currently, the price is performing a retest of the breakout level while sitting within a strong support zone between 0.00280 – 0.00310 USDT (highlighted in yellow). This area previously acted as accumulation and now serves as a key support.
---
📈 Bullish Scenario:
Price holds and bounces from the 0.00280 – 0.00310 zone, forming a new higher low.
Potential upside targets include:
0.004091 (minor resistance)
0.007081
0.010009
And extended targets at 0.012096 – 0.012900 if bullish momentum continues.
Bullish confirmation strengthens if price reclaims above 0.004091 with strong volume.
---
📉 Bearish Scenario:
If the price fails to hold the 0.00280 support and breaks below the ascending trendline (rising yellow line), then:
It may revisit the next support zone at 0.002300
Possibly retest the historical low at 0.001613
Bearish case invalidated if price pushes back above 0.0040 with a strong bullish candle.
---
📐 Pattern & Structure:
Symmetrical Triangle Breakout: Signals a consolidation phase that resolved to the upside.
Breakout Retest: Price is now retesting the breakout level — a crucial phase to validate trend continuation.
Support-Resistance Flip: The yellow zone is key in determining whether bulls maintain control.
---
🧠 Summary:
MEW/USDT is currently in a critical retest phase after a bullish breakout from a symmetrical triangle pattern. If support holds, this could be a solid swing opportunity toward higher resistance levels. However, a breakdown below the key support would invalidate the bullish setup and open room for further downside.
#MEWUSDT #CryptoAnalysis #BreakoutRetest #SymmetricalTriangle #AltcoinSetup #BullishScenario #BearishScenario #TechnicalAnalysis #SwingTrade
Gold Prices Are About to Break Through the Range: Target 3400Gold Prices Are About to Break Through the Range: Target 3400
First, Analysis Summary:
1: Current gold prices are driven by expectations of a Fed rate cut.
2: In the short term, watch for a breakout of the $3380-3381 resistance level.
If this level holds, a rise to $3450 is possible.
If a pullback occurs, watch for support at $3345 and $3274.
3: Policy (Federal Reserve direction) and geopolitical risks remain key drivers.
4: The bullish outlook is likely to persist, and our long-on-low strategy remains unchanged this week.
Buy: 3350-3360-3370
Stop-loss: 3340
Target: 3375-3380-3400+
Strategy:
Trump's announcement of new tariffs on semiconductors, chips, and pharmaceuticals could further exacerbate market uncertainty.
Technical Analysis:
Resistance: $3380-3381 is a key trading area. A breakout could challenge the $3432-3451 range (near its all-time high).
Support:
Short-term support: $3345 (recent low).
Strong support: $3274-3290 (June low and August opening range). A break below this level could trigger a deeper correction to $3240-3247.
As shown in the chart:
Gold prices have been fluctuating in a high range for nearly a week.
Technically, gold is consolidating within a triangle pattern.
The chart shows a clear converging range. A break above $3380-3381 could trigger a new uptrend; a break below $3345 could lead to a retest of the $3274 support level.
A new round of sharp gains and losses is expected this week.
Current Trend: High short-term volatility; continue to buy on dips.

EIGEN/USDT TestingDemand Zone – Rebound or Breakdown Ahead?🧠 Technical Analysis:
🔸 Market Structure:
The price is currently sitting around 1.15 USDT, right above a key demand zone (highlighted in yellow) that has been tested multiple times since March 2025.
This area between 1.00 – 1.20 USDT acts as a major support zone.
🔸 Key Resistance Levels:
1.430 USDT → short-term resistance
1.604 USDT → significant resistance (previous support turned resistance)
Higher resistance targets: 1.980, 2.341, 2.982, 4.018, and 5.480 USDT
🔸 Key Support Levels:
1.154 USDT → current price level
Main demand zone: 1.00 – 1.20 USDT
If broken, the next major support lies around 0.80 USDT
---
📈 Bullish Scenario:
If the 1.00 – 1.20 USDT demand zone holds and the price prints a higher low, a bullish reversal is possible.
Short-term target: 1.43 and 1.60 USDT
If 1.60 is broken with strong momentum, the next targets are: 1.98 – 2.34 USDT
Bullish confirmation will be stronger if the price breaks and closes above 1.60 USDT on the daily chart
✅ Bullish Confirmation:
Bullish engulfing candle near support
Rising volume on upward moves
Breaking above previous lower highs
---
📉 Bearish Scenario:
If the price breaks down below the 1.00 – 1.15 USDT support zone, downside targets shift toward 0.80 – 0.66 USDT
A descending triangle pattern may be forming if the price continues making lower highs while testing the same support
⚠️ Bearish Confirmation:
Strong bearish candle closing below support
High sell volume
New lower low after a failed bounce
---
🔺 Pattern Analysis:
The price has been forming a range-bound pattern between 1.00 – 1.60 USDT
A potential double bottom could form if this support holds and price bounces up again
Otherwise, it may evolve into a descending triangle, signaling bearish pressure
---
🔖 Conclusion:
EIGEN is at a critical support zone that could define its next major move. A strong reaction here could signal a bullish reversal, while a breakdown could open the door to deeper declines. This is a key level to watch.
#EIGEN #EIGENUSDT #CryptoAnalysis #Altcoin #TechnicalAnalysis #SupportResistance #BullishScenario #BearishScenario #CryptoTrading #ChartAnalysis

ILVUSDT Forming Bullish MomentumILVUSDT (Illuvium/USDT) has shown an impressive breakout from its recent accumulation zone, with a strong bullish momentum that’s caught the attention of smart money and retail investors alike. The price action reflects a clean recovery from a solid demand zone, where accumulation occurred for several weeks. Now that the resistance has been broken with strength, ILV is poised for further upside, and the current projection suggests a possible 100%+ gain, targeting the \$29-\$30 range.
What makes this setup more compelling is the sharp vertical movement, supported by a spike in volume, indicating institutional interest. ILV has historically delivered aggressive rallies following long consolidations, and the current breakout structure mirrors those previous bullish cycles. The daily chart clearly shows the strength of the impulse wave, and with no immediate resistance in sight until much higher levels, the risk-reward remains in favor of the bulls.
Fundamentally, Illuvium remains one of the more promising GameFi projects, combining AAA gaming quality with DeFi integration. As Web3 gaming continues to attract attention, ILV stands out as a top contender in this space. With the renewed interest in altcoins, ILV could outperform many of its peers, especially if bullish sentiment across the market persists.
This is a textbook momentum breakout setup backed by volume, fundamentals, and strong community backing. Traders looking for high-reward setups should keep ILVUSDT on their radar for potential continuation.
✅ Show your support by hitting the like button and
✅ Leaving a comment below! (What is You opinion about this Coin)
Your feedback and engagement keep me inspired to share more insightful market analysis with you!

GBPCADDate:
August 7, 2025
Session:
Tokyo Session
Pair:
GBPCAD
Bias:
Short
Targeting liquid from last Friday and Wednesday
Entry:1.83562
Stop Loss:1.83882
Target:1.82453
RR:3.51

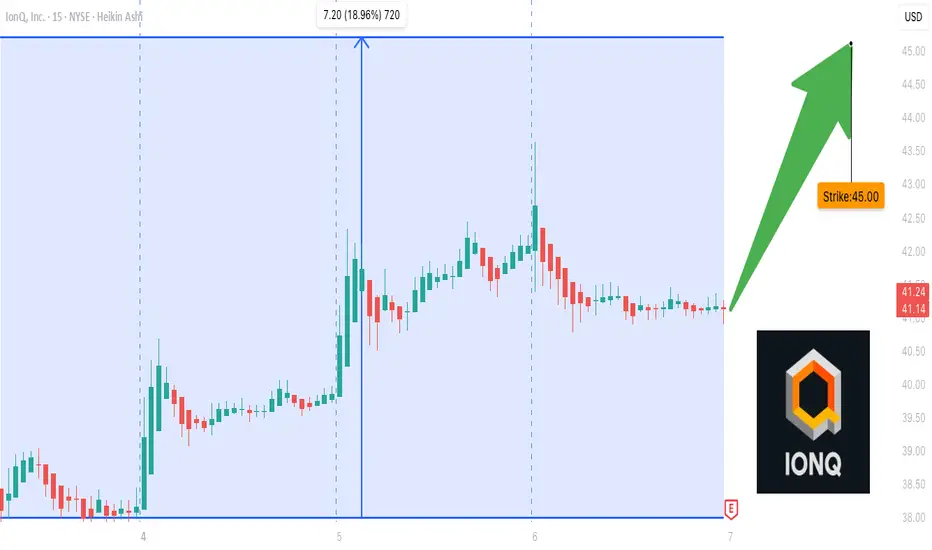
IONQ Earnings Call Play – High-Risk, High-Reward Setup
## 🚀 IONQ Earnings Call Play – High-Risk, High-Reward Setup (Aug 6)
**Quantum Alert: Will IonQ Surprise After Amazon Stake News?**
### 💡 Core Thesis:
Despite weak historical execution, **analysts are turning bullish** on IONQ ahead of earnings—backed by **strong sector sentiment, elevated options activity, and macro tailwinds** in tech.
---
### 🧠 Earnings Breakdown
| Metric | Status | Insight |
| -------------------- | ------------ | ----------------------------------------- |
| 📉 Revenue Growth | -0.2% | Flat growth in a high-expectation sector. |
| 🔥 Gross Margin | 50.7% | Solid base for future profitability. |
| ❌ Surprise Avg. | -38% | Historical underperformance. |
| 💬 Analyst Consensus | ⭐ Strong Buy | Amazon’s recent stake boosts sentiment. |
🧮 **Fundamental Score**: 5/10
⚠️ Weak execution vs. strong institutional interest.
---
### 🔍 Options Flow Snapshot
* 💥 **Bullish Divergence** on Calls (especially \$45.00 strike)
* 📈 Elevated IV (Rank 0.75)
* 🔀 High OI on both calls/puts suggests hedged anticipation
* 📊 Expected Move: \~8%
📊 **Options Flow Score**: 7/10
🚨 Smart money leaning **bullish**, but cautious.
---
### 📈 Technical Landscape
* 💤 Low volume pre-earnings
* 🧍 Hovering near support (\~\$40)
* 🚧 Resistance: \$43.55
* ⚠️ No strong trend detected
📉 **Technical Score**: 4/10
🧊 Cold tape, needs a catalyst to ignite.
---
### 🌐 Macro & Sector Context
* 💡 Quantum computing getting big headlines
* 🛒 Tech rotation underway
* 💰 Government & institutional support growing
🌍 **Macro Score**: 7/10
📢 Sector momentum can carry IONQ, if earnings surprise.
---
### 🔐 Trade Setup (Options Play)
| 🎯 Strategy | Long Call |
| --------------- | --------- |
| 📌 Strike | \$45.00 |
| 📆 Expiry | Aug 08 |
| 💵 Entry | \$0.98 |
| 🏁 Target | \$2.94 |
| 🛑 Stop Loss | \$0.49 |
| ⚖️ Risk\:Reward | 1:3 |
| 📈 Confidence | 66% |
📊 **Expected Move**: ±8.0%
📈 **IV Rank**: 0.75
🕰 **Timing**: Enter before close on Aug 6
📆 **Earnings Report**: Aug 6 (AMC)
---
### 📉 Exit Strategy:
* 🎯 **Profit Target**: \$2.94
* 🛑 **Stop Loss**: \$0.49
* ⏱ **Time Exit**: Close position within 2 hours post-earnings if no movement
---
### ⚠️ Bottom Line:
> **This is a speculative, high-volatility earnings trade** with asymmetric upside potential. Analyst upgrades and the Amazon effect provide tailwinds—but historical miss rate is real. Trade small, trade smart.
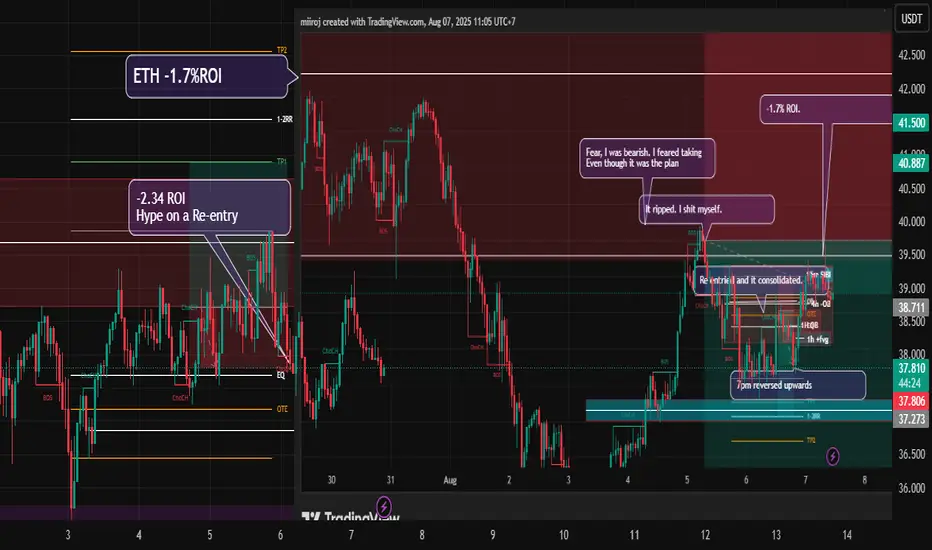
The Loosing TradesI've had 3 in the last 3 weeks.
Popcat *can't trace the ROI info* back in July.
Hype -2.4ROI
Eth -1.7ROI
What's common with them? Chicken out on the first move and taking the second waves.
Fear when I should be puling the trigger, Second attempts are hurting me.
BRN - brainchipBRN have been a problem child for many traders and investors after it surge on price its now down to ground. Don't get your hope disappear yet as things about to change and happen very rapidly.
Wit the development of AI. Akida is BRN flagship which may contribute to enhance security by using this on their defense in Drones.
This is also important in ensuring low cost energy as its using efficient energy.
Things will change just hang on there and everything will become bullish.

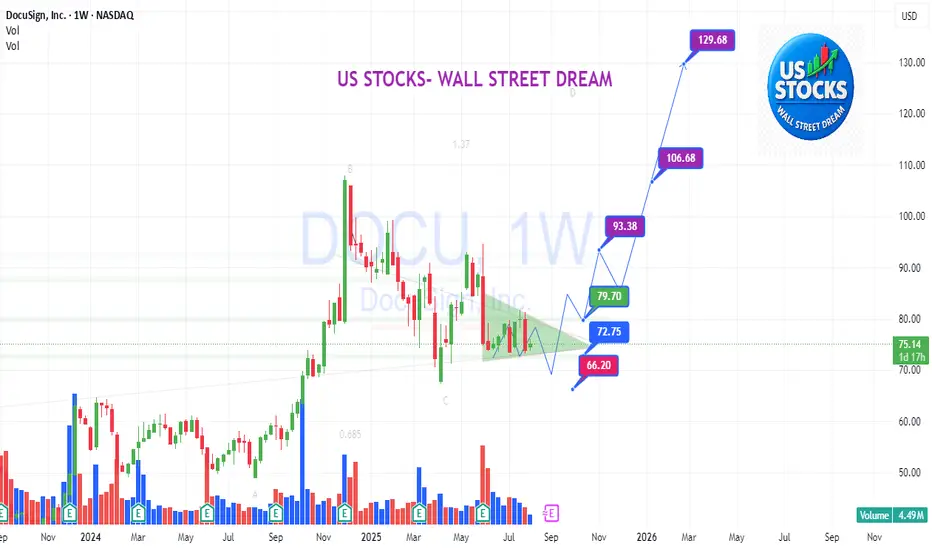
DOCU: An early timing buy entry at the dipDOCU
.
An early timing buy entry at the dip
The most boring entry point is always the best one.
.
US STOCKS- WALL STREET DREAM- LET'S THE MARKET SPEAK!
LRC/USDT 1W – Final Test Before a Major Reversal?> Loopring (LRC) is currently sitting at a critical long-term support zone, and the next few weeks could determine whether a strong reversal or deeper decline will follow.
---
🧠 Macro Overview:
After falling more than 97% from its all-time high (ATH) of $3.0596, LRC is now revisiting a historical demand zone between $0.0657–$0.0821. This area has acted as a powerful launchpad during previous cycles and remains a major accumulation zone.
---
🔎 Technical Structure & Price Action:
✅ Historical Demand Zone (Strong Support)
Marked by the yellow box, this range has historically triggered major price rallies.
Buyers have consistently stepped in at this level since early 2021.
✅ Possible Double Bottom Formation
A potential double bottom pattern is forming in this zone. A breakout above $0.1189 would confirm the bullish reversal structure.
✅ Low Volume = Volatility Brewing
Current low-volume environment could indicate quiet accumulation before a potential breakout.
✅ Weakening Downtrend
The multi-year downtrend is still intact, but the selling momentum is fading as price consolidates in this key support area.
---
🟢 Bullish Scenario (Reversal or Relief Rally):
1. Price holds and bounces from the $0.0657–$0.0821 demand zone.
2. Breakout above $0.1189 (initial resistance) opens the door for:
🎯 $0.1632 – First key resistance.
🎯 $0.3205 & $0.4398 – Mid-term resistance levels.
🎯 $1.1848 – Long-term recovery target if altcoin momentum returns.
> A weekly candle close above $0.1632 with strong volume would confirm the bullish trend shift.
---
🔴 Bearish Scenario (Support Breakdown):
1. A breakdown below $0.0657 would invalidate the support zone.
2. Potential downside targets:
⚠️ $0.0550 – Psychological support.
⚠️ Uncharted territory below $0.0550 could trigger panic selling and deeper declines.
> In this case, strict risk management is essential, as breaking this zone may lead to a fresh leg down in price discovery.
---
📈 Strategy & Outlook:
Short-term/Swing Traders:
Consider speculative entries within the support zone with tight stop-losses below $0.0657.
Wait for a confirmed breakout above $0.1189–$0.1632 for trend validation.
Long-term Investors:
This zone presents a compelling Dollar-Cost Averaging (DCA) opportunity with high reward potential.
However, maintain capital discipline in case of deeper downside risk.
---
💡 Conclusion:
> LRC is at a make-or-break level.
If this historical support holds and volume kicks in, we could be witnessing the early signs of a major weekly reversal.
But if the support fails, it may enter a new bearish phase with further downside.
#LRCUSDT #Loopring #AltcoinReversal #CryptoSupportZone #CryptoAnalysis #TechnicalAnalysis #SwingTradeSetup #BearishOrBullish #LRCChart #CryptoOpportunities

RNDR 1H – Post-Dump Range Established, Still Below Key MidpointRNDR has entered a clear consolidation range following a sharp 24.5% decline over 5 days. Price is currently holding above the range low at $3.35, but remains below the midpoint at $3.88 — a level that typically acts as a key decision point in range-bound markets.
The structure is well-defined:
– Range High: $4.45
– Midpoint: $3.88
– Range Low: $3.35
As long as price remains below the midpoint, sellers remain in control on lower timeframes. A breakout above $3.88 with conviction could signal a shift in momentum, while failure to do so keeps the pressure on support.
This is a neutral zone — ideal for planning both breakout and breakdown scenarios. Watch for volume and reaction at the midpoint before positioning.

XRP 1D – Golden Pocket Bounce HoldingXRP just tapped the golden pocket zone (0.618 Fib) and bounced — and so far, the structure is holding like a champ.
The wick into demand back in March kicked off a full-blown rally, and now we’re seeing price respect that same move with a textbook Fibonacci retrace. This is where strong trends often reload.
If bulls hold the 0.5–0.618 range (2.71–2.49), this could be round two of the pump. A clean higher low is already in — now it's all about reclaiming momentum.
But if 2.49 breaks, we’re eyeing 2.18 fast.
🔥 What’s on the table:
– Golden Pocket = Bullish launch zone
– 0.5 Fib = Current support
– 0.618 Fib = Line in the sand
– 0.786 Fib = Trapdoor if we break down
– 3.6 = Target on reclaim
This is where serious moves begin. Don’t sleep

NZDUSD H4 | Bullish riseThe Kiwi (NZD/USD) has bounced off the buy entry which is a pullback support and could potentially rise from this level to the take profit.
Buy entry is at 0.5926, which is a pullback support.
Stop loss is at 0.5885, which is a swing low support.
Take profit is at 0.5980, which is a pullback resistance that aligns with the 61.8% Fibonacci retracement.
High Risk Investment Warning
Trading Forex/CFDs on margin carries a high level of risk and may not be suitable for all investors. Leverage can work against you.
Stratos Markets Limited (tradu.com ):
CFDs are complex instruments and come with a high risk of losing money rapidly due to leverage. 65% of retail investor accounts lose money when trading CFDs with this provider. You should consider whether you understand how CFDs work and whether you can afford to take the high risk of losing your money.
Stratos Europe Ltd (tradu.com ):
CFDs are complex instruments and come with a high risk of losing money rapidly due to leverage. 66% of retail investor accounts lose money when trading CFDs with this provider. You should consider whether you understand how CFDs work and whether you can afford to take the high risk of losing your money.
Stratos Global LLC (tradu.com ):
Losses can exceed deposits.
Please be advised that the information presented on TradingView is provided to Tradu (‘Company’, ‘we’) by a third-party provider (‘TFA Global Pte Ltd’). Please be reminded that you are solely responsible for the trading decisions on your account. There is a very high degree of risk involved in trading. Any information and/or content is intended entirely for research, educational and informational purposes only and does not constitute investment or consultation advice or investment strategy. The information is not tailored to the investment needs of any specific person and therefore does not involve a consideration of any of the investment objectives, financial situation or needs of any viewer that may receive it. Kindly also note that past performance is not a reliable indicator of future results. Actual results may differ materially from those anticipated in forward-looking or past performance statements. We assume no liability as to the accuracy or completeness of any of the information and/or content provided herein and the Company cannot be held responsible for any omission, mistake nor for any loss or damage including without limitation to any loss of profit which may arise from reliance on any information supplied by TFA Global Pte Ltd.
The speaker(s) is neither an employee, agent nor representative of Tradu and is therefore acting independently. The opinions given are their own, constitute general market commentary, and do not constitute the opinion or advice of Tradu or any form of personal or investment advice. Tradu neither endorses nor guarantees offerings of third-party speakers, nor is Tradu responsible for the content, veracity or opinions of third-party speakers, presenters or participants.

USDCAD H4 | Potential bearish dropUSD/CAD is is rising towards the sell entry at 1.3758, which is an overlap resistance and could drop from this level to the downside.
Stop loss is at 1.3758, which is an overlap resistance.
Take profit is at 1.3692, which is a pullback support that aligns witht he 61.8% Fibonacci retracement.
High Risk Investment Warning
Trading Forex/CFDs on margin carries a high level of risk and may not be suitable for all investors. Leverage can work against you.
Stratos Markets Limited (tradu.com ):
CFDs are complex instruments and come with a high risk of losing money rapidly due to leverage. 65% of retail investor accounts lose money when trading CFDs with this provider. You should consider whether you understand how CFDs work and whether you can afford to take the high risk of losing your money.
Stratos Europe Ltd (tradu.com ):
CFDs are complex instruments and come with a high risk of losing money rapidly due to leverage. 66% of retail investor accounts lose money when trading CFDs with this provider. You should consider whether you understand how CFDs work and whether you can afford to take the high risk of losing your money.
Stratos Global LLC (tradu.com ):
Losses can exceed deposits.
Please be advised that the information presented on TradingView is provided to Tradu (‘Company’, ‘we’) by a third-party provider (‘TFA Global Pte Ltd’). Please be reminded that you are solely responsible for the trading decisions on your account. There is a very high degree of risk involved in trading. Any information and/or content is intended entirely for research, educational and informational purposes only and does not constitute investment or consultation advice or investment strategy. The information is not tailored to the investment needs of any specific person and therefore does not involve a consideration of any of the investment objectives, financial situation or needs of any viewer that may receive it. Kindly also note that past performance is not a reliable indicator of future results. Actual results may differ materially from those anticipated in forward-looking or past performance statements. We assume no liability as to the accuracy or completeness of any of the information and/or content provided herein and the Company cannot be held responsible for any omission, mistake nor for any loss or damage including without limitation to any loss of profit which may arise from reliance on any information supplied by TFA Global Pte Ltd.
The speaker(s) is neither an employee, agent nor representative of Tradu and is therefore acting independently. The opinions given are their own, constitute general market commentary, and do not constitute the opinion or advice of Tradu or any form of personal or investment advice. Tradu neither endorses nor guarantees offerings of third-party speakers, nor is Tradu responsible for the content, veracity or opinions of third-party speakers, presenters or participants.

AVAX/USDT Long Opportunity – Bullish Setup Developing!AVAX is currently forming a potential bullish reversal on the 4H timeframe. Price recently bounced off the strong demand zone between $20.70 – $21.35, where previous support held and buyers stepped in aggressively.
🔍 Technical Breakdown:
Support Zone: $20.70 – $21.35 (Strong demand zone highlighted in orange)
Current Price: $22.10 (slightly above support, indicating bullish interest)
First Target (TP1): $24.01 (minor resistance and previous structure level)
Second Target (TP2): $26.25 – $27.00 (major supply zone; high probability reaction area)
✅ Confluences:
Clean bullish structure forming off demand zone
Volume profile (LuxAlgo VRVP) supports the bounce
Higher low confirmed on the 4H
Strong imbalance above, price likely to fill it
📌 Trade Idea:
If momentum continues and price stays above $21.35:
Entry Zone: $21.90 – $22.20 (current range)
SL: Below $20.70 (beneath demand zone)
TP1: $24.01
TP2: $26.25+
🧠 Notes:
Watch how price reacts at $24.01; breaking this confirms bullish strength.
The $26.25 area is a historical supply zone, so consider partial profits here.
Maintain good risk management; crypto remains volatile!
🟢 Bias: Bullish

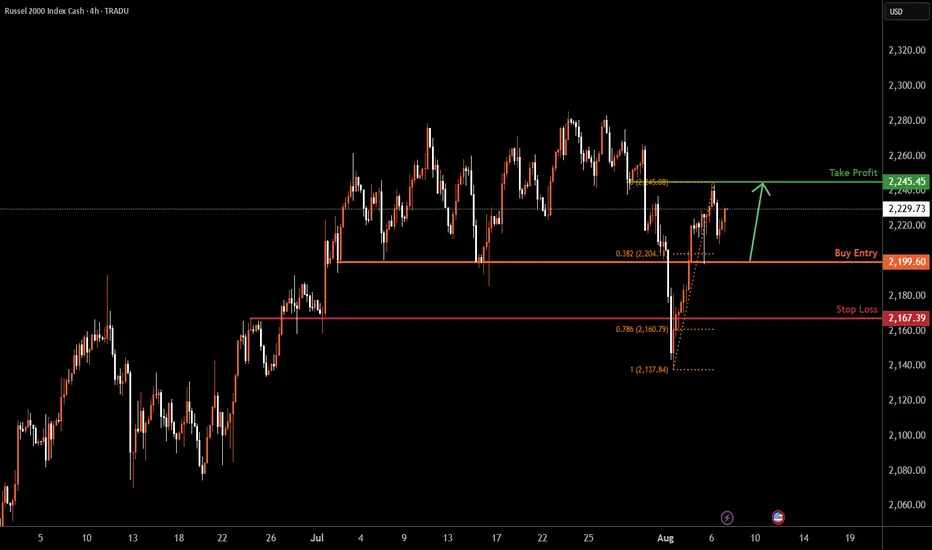
US2000 H4 | Bullish bounce offBased on the H4 chart analysis, we could see the price fall towards the buy entry which is a pullback support and could bounce to the take profit.
Buy entry is at 2,199.60, which is a pullback support that is slightly below the 38.2% Fibonacci retracement.
Stop loss is at 2,167.39, which is a pullback support that is slightly above the 78.6% Fibonacci retracement.
Take profit is at 2,245.45, which is a pullback resistance.
High Risk Investment Warning
Trading Forex/CFDs on margin carries a high level of risk and may not be suitable for all investors. Leverage can work against you.
Stratos Markets Limited (tradu.com ):
CFDs are complex instruments and come with a high risk of losing money rapidly due to leverage. 65% of retail investor accounts lose money when trading CFDs with this provider. You should consider whether you understand how CFDs work and whether you can afford to take the high risk of losing your money.
Stratos Europe Ltd (tradu.com ):
CFDs are complex instruments and come with a high risk of losing money rapidly due to leverage. 66% of retail investor accounts lose money when trading CFDs with this provider. You should consider whether you understand how CFDs work and whether you can afford to take the high risk of losing your money.
Stratos Global LLC (tradu.com ):
Losses can exceed deposits.
Please be advised that the information presented on TradingView is provided to Tradu (‘Company’, ‘we’) by a third-party provider (‘TFA Global Pte Ltd’). Please be reminded that you are solely responsible for the trading decisions on your account. There is a very high degree of risk involved in trading. Any information and/or content is intended entirely for research, educational and informational purposes only and does not constitute investment or consultation advice or investment strategy. The information is not tailored to the investment needs of any specific person and therefore does not involve a consideration of any of the investment objectives, financial situation or needs of any viewer that may receive it. Kindly also note that past performance is not a reliable indicator of future results. Actual results may differ materially from those anticipated in forward-looking or past performance statements. We assume no liability as to the accuracy or completeness of any of the information and/or content provided herein and the Company cannot be held responsible for any omission, mistake nor for any loss or damage including without limitation to any loss of profit which may arise from reliance on any information supplied by TFA Global Pte Ltd.
The speaker(s) is neither an employee, agent nor representative of Tradu and is therefore acting independently. The opinions given are their own, constitute general market commentary, and do not constitute the opinion or advice of Tradu or any form of personal or investment advice. Tradu neither endorses nor guarantees offerings of third-party speakers, nor is Tradu responsible for the content, veracity or opinions of third-party speakers, presenters or participants.
BTC 4H – Retesting Trendline Support, Will Supply Reject Again?Bitcoin is retesting a clean 4H ascending trendline after forming a local higher low — with Stoch RSI starting to turn upward from the bottom. This trendline has acted as reliable support since early July.
If price continues to hold and flip the mid-range ($116K), the next major test comes at the overhead supply zone ($119K–$121K), where price was previously rejected multiple times.
Key levels to watch:
– Trendline support (currently holding)
– Mid-range reclaim (~116K)
– Supply zone rejection or breakout (119K–121K)
– Stoch RSI bounce = potential early signal
Bullish continuation hinges on strength through supply — otherwise, this may form another lower high. Watching for confirmation from price action + momentum.

BITCOIN H4 | Heading into 61.8% Fibonacci resistanceBased on the H4 chart analysis, we could see the price rise to the sell entry at 117,165.96, which is a pullback resistance that aligns with the 61.8% Fibonacci retracement and could drop from this level to our take profit.
Stop loss is at 120,590.52, which is a pullback resistance.
Take profit is at 111,694.11, which is a pullback support that is slightly above the 50% Fibonacci retracement.
High Risk Investment Warning
Trading Forex/CFDs on margin carries a high level of risk and may not be suitable for all investors. Leverage can work against you.
Stratos Markets Limited (tradu.com ):
CFDs are complex instruments and come with a high risk of losing money rapidly due to leverage. 65% of retail investor accounts lose money when trading CFDs with this provider. You should consider whether you understand how CFDs work and whether you can afford to take the high risk of losing your money.
Stratos Europe Ltd (tradu.com ):
CFDs are complex instruments and come with a high risk of losing money rapidly due to leverage. 66% of retail investor accounts lose money when trading CFDs with this provider. You should consider whether you understand how CFDs work and whether you can afford to take the high risk of losing your money.
Stratos Global LLC (tradu.com ):
Losses can exceed deposits.
Please be advised that the information presented on TradingView is provided to Tradu (‘Company’, ‘we’) by a third-party provider (‘TFA Global Pte Ltd’). Please be reminded that you are solely responsible for the trading decisions on your account. There is a very high degree of risk involved in trading. Any information and/or content is intended entirely for research, educational and informational purposes only and does not constitute investment or consultation advice or investment strategy. The information is not tailored to the investment needs of any specific person and therefore does not involve a consideration of any of the investment objectives, financial situation or needs of any viewer that may receive it. Kindly also note that past performance is not a reliable indicator of future results. Actual results may differ materially from those anticipated in forward-looking or past performance statements. We assume no liability as to the accuracy or completeness of any of the information and/or content provided herein and the Company cannot be held responsible for any omission, mistake nor for any loss or damage including without limitation to any loss of profit which may arise from reliance on any information supplied by TFA Global Pte Ltd.
The speaker(s) is neither an employee, agent nor representative of Tradu and is therefore acting independently. The opinions given are their own, constitute general market commentary, and do not constitute the opinion or advice of Tradu or any form of personal or investment advice. Tradu neither endorses nor guarantees offerings of third-party speakers, nor is Tradu responsible for the content, veracity or opinions of third-party speakers, presenters or participants.
