BTC 1H Analysis – Key Triggers Ahead | Day 3💀 Hey , how's it going ? Come over here — Satoshi got something for you !
⏰ We’re analyzing BTC on the 1-hour timeframe .
⏱ We’re analyzing Bitcoin on the 1-hour timeframe.
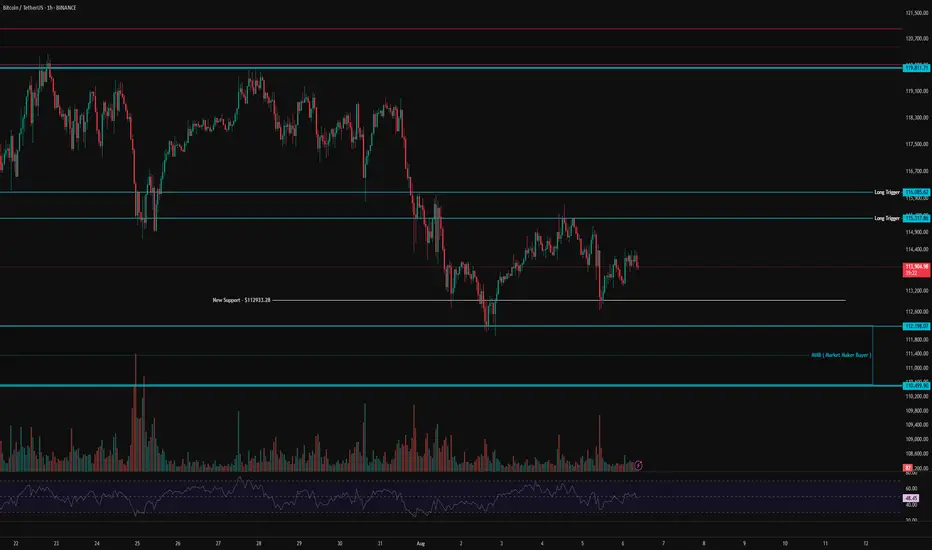
👀 After bouncing from the current $113,000 area, Bitcoin moved upward, indicating the presence of market maker buyers in this zone. A short-term support has formed at $113,000, and yesterday we saw a strong rejection from this level, which helped prevent further selling pressure.
Bitcoin now faces a resistance zone and a potential long entry trigger between $115,317 and $116,085. If long positions increase and short positions get squeezed, this resistance could be broken, potentially fueling a bullish move.
⚙️ On the RSI, our key level is the 50 range. A confirmed hold above this level could signal a higher low forming relative to the previous bottom at $112,933.
🕯 We’re seeing an increase in trading volume, and as the price moves closer to $110,499, there's a noticeable liquidity pull from long positions—more buyers are stepping in around this area.
📈 Our long position trigger lies within the resistance zone mentioned. A confirmed breakout and hold above this level, alongside RSI entering Overbought across multiple timeframes and volume expansion, would give us a solid entry for a long position.
📉 Our short position trigger is below $112,200. A sharp drop with strong selling pressure and RSI entering Oversold would justify a short entry—though I do not recommend taking this trade.
❤️ Disclaimer : This analysis is purely based on my personal opinion and I only trade if the stated triggers are activated .
Harmonic Patterns
Kakao Bullish 📊 Trade Idea: – Fibonacci Retracement + Bullish Continuation Setup
Timeframe: Daily (1D)
Chart Type: Candlestick
Strategy Type: Swing Trade / Trend Continuation
⸻
🧩 Trade Thesis:
After a strong impulsive move upwards, the price has retraced back to the 50%-61.8% Fibonacci zone, which historically acts as a key support area during trending markets. A possible bullish continuation pattern is forming, with consolidation visible near the 0.5 level.
⸻
📍 Entry, Stop Loss & Take Profit:
• Buy Entry: 56,800 (Breakout or confirmation from current support zone)
• Stop Loss (S.L): 53,300 (Below the 0.618 Fib level and recent local low)
• Take Profit (T.P): 88,500 (Based on previous swing high extension / trendline projection)
⸻
📏 Trade Metrics:
• Risk per Share: 56,800 - 53,300 = 3,500
• Reward per Share: 88,500 - 56,800 = 31,700
• Risk-to-Reward Ratio: ~1:9
A high reward/risk setup with price holding near Fibonacci support, awaiting breakout confirmation.
⸻
🔍 Technical Confluence:
• Price has respected the 61.8% Fibonacci retracement level, a key area of potential reversal.
• Volume shows signs of stabilization after the correction phase.
• Uptrend structure remains valid unless the price closes below 53,300.
• Potential bullish flag or pennant pattern in progress, signaling continuation.
⸻
⚠️ Trade Management:
• Aggressive Entry: Near current levels (anticipating breakout)
• Conservative Entry: Wait for daily candle close above 59,400 (confirmation)
• Adjust SL to Breakeven if price breaks above 65,000
• Watch for Rejection Signs if price approaches 61.8% level again
⸻
🕓 Timeline Expectation:
• Short-to-Medium Term Outlook (2–6 weeks) depending on breakout and follow-through.
⸻
📌 Note: Always review fundamental context and broader market sentiment. This is a technical idea for educational purposes only.

ENTRY USDCADDisclaimer:
This is merely a chart-based analytical trading idea and is not considered investment advice. Please manage your risks carefully and conduct your own research before making any trading decisions.

BEARS Coming Up.On a 1D TF, we have a good BAT Pattern from Harmonics strategy, and as well a very clear AB=CD Pattern, from the EW point of view we are having a good FLAT correction.
At the moment we think the market is done with the pullback and we're setting up for a free fall
This is our insight as it stands.
This isn't an investment advice, and employ your strategies and principles when deciding to join our views.

Gold - Intraday Long Setup (5M TF) | Smart Money + Elliott Struc# 🟢 Gold - Intraday Long Setup (5M TF) | Smart Money + Elliott Structure
**Pair:** Gold Spot / USD
**Timeframe:** 5M
**Session:** London / NY Overlap
**Type:** Intraday Long Idea
**Concepts:** Smart Money, Supply & Demand, Wave Analysis, SSL Confirmation
---
## 🔍 Market Context
The market is currently reacting inside a **key Demand Zone** on the 5-minute timeframe, following a strong bearish move during the London session. The structure suggests a corrective **ABC wave formation**, where the **(c) point** appears to be forming a potential higher low at demand.
- Point **(a)**: Marked the first impulse down
- Point **(b)**: Rejection at minor **Supply Zone**
- Point **(c)**: Retest of **POI at Demand**, showing signs of exhaustion in selling pressure
---
## 📈 Technical Confluences
- 🟦 **Demand Zone** active and respected
- 📏 Potential BOS (Break of Structure) upon break of the recent high
- 📊 **Vol %ile** = 83% → Above average participation
- ⚠️ Risk Level: High (tight structure, requires confirmation)
- 🧭 Entry Distance: Near
---
## 🔧 Indicators Status (SSL Hybrid)
| Indicator | Status |
|--------------------------|----------|
| SSL Channel | ✅ Bullish cross (supporting reversal)
| RSI (50) | ✅ Holding above midpoint
| MACD | ✅ Bullish crossover (early signal)
| BB Oscillator / HT / RQK | ❌ Still bearish (lagging)
---
## 🎯 Trade Idea
**Bias:** Long
**Trigger:** Break above **minor Supply** and formation of BOS
**Target Zones:**
1. **TP1:** 3,370
2. **TP2:** 3,378 (supply edge)
3. **TP3:** 3,385 (upper supply zone)
**SL:** Below point (c) @ **~3,357**
---
## 🧠 Notes
This setup is valid as long as price holds above the Demand Zone and confirms a bullish shift via BOS. Wait for clear confirmation before entering.
_This is an educational idea based on Smart Money + Elliott Wave principles – not financial advice._
---
#gold #smartmoney #supplydemand #elliottwave #sslhybrid #intraday #5mtf #tradingview

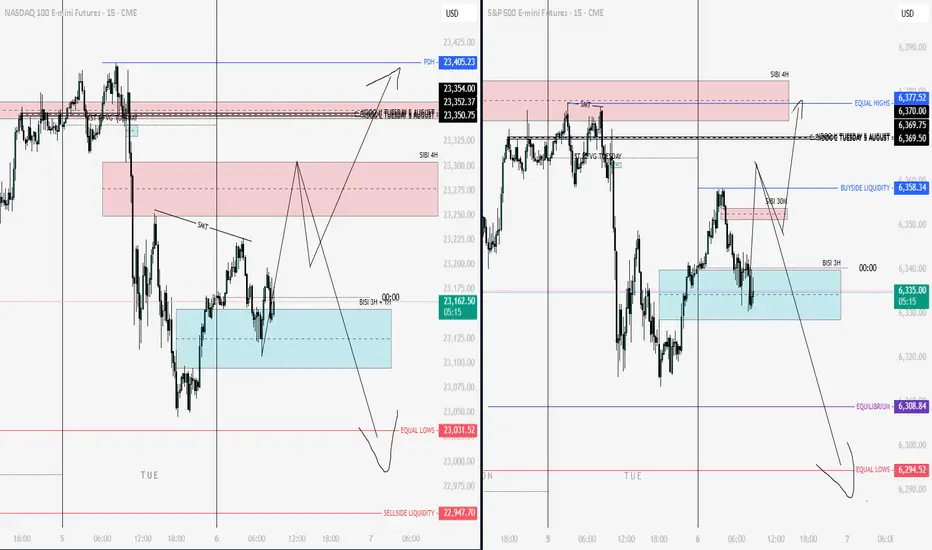
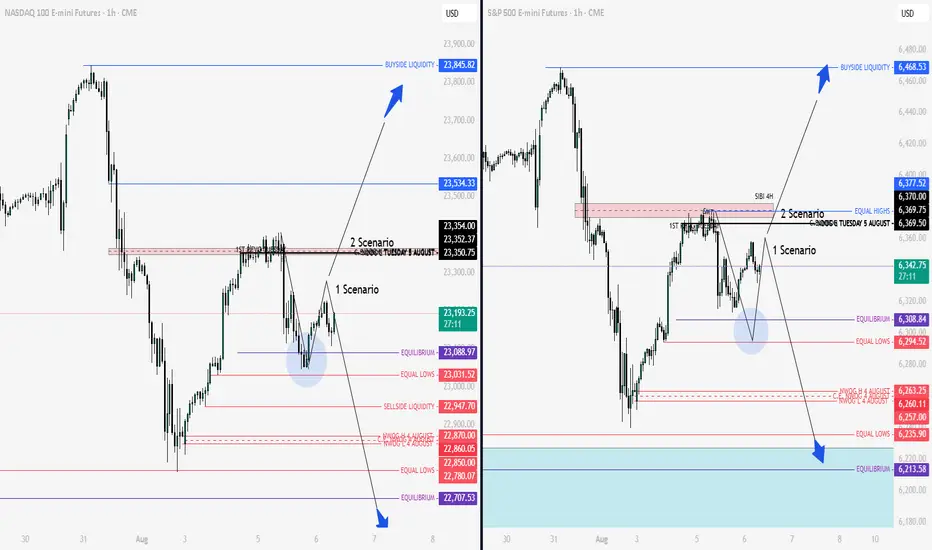
NQ & ES Key Levels 06-08-2025"To determine which of the two scenarios is more likely to play out, we first need to see how the market opens. Based on the price action and how key levels are respected, we’ll gain clarity on the setup we’re looking for. Price is currently at a critical point, with probabilities at roughly 50-50 — so there’s no clear bias yet. However, we’re well aware of the key levels and zones we’re focused on."
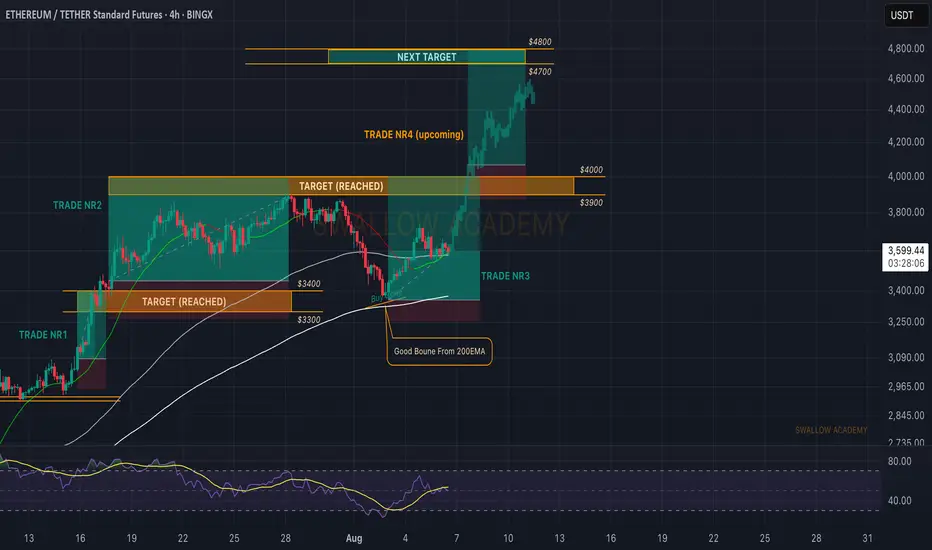
Ethereum (ETH): Seeing Struggle But Nothing Serious | Bullish AFETH still looks bullish to us, with the price staying above the local 200EMA, where last time we had a decent bounce from it.
Now, as many remember and know, we are bullish on ETH only due to 1 big reason: the liquidity of BTC has to go somewhere, and as investors have already had their fun (most of it, at least) with BTC, now they need to relocate their money and ETH is the next step.
$4000 is still our target (once again, as we already reached it once basically), and the current zone seems like a good bounce area with the 100 EMA and the middle line of the BB sitting there, in addition to lots of liquidity being distributed here (based on the order book we use)!
Swallow Academy
XAUUSD needs retest before swing highM30-H1 TIMEFRAME SETUP
Currently we have range of 3345-3380 area also we have proper CHOCH on H4 at 3335 support area
What possible scenarios we have ?
• If market remains low 3372-3378 then you can scalp a sell trades towards 3360-3350 area which I take sell with minimal risk.
• secondly I wait for drop to my Buying area where I will buy XAUUSD in dips and my optimal target will be 3402-3410.
Additional Tip:
Market is on bullish Bias ,above 3385 no sell Trade .
#XAUUSD
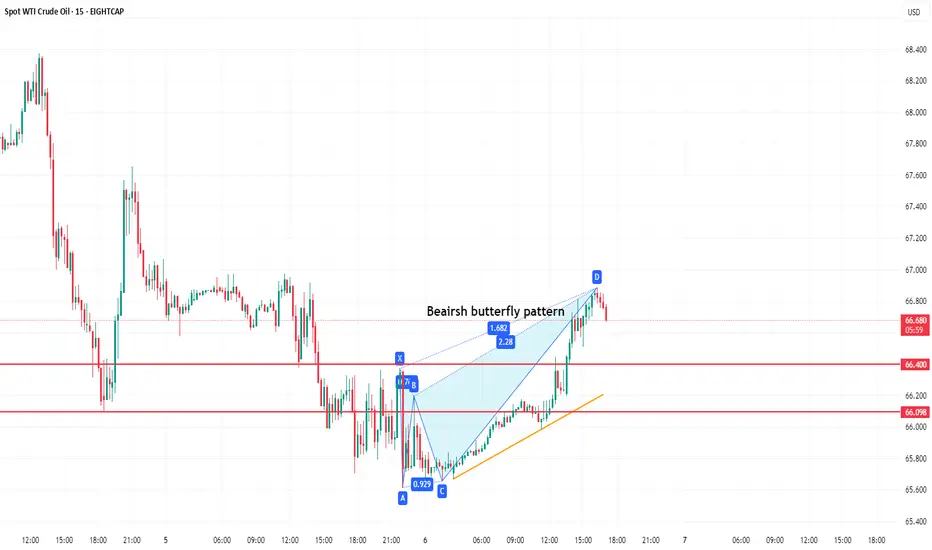
WTI SPOT CRUDEBearish butterfly appear completed, and near completion ratio once reversed, Wave wise also reversal possible wave B in lower degree appear to be completed.
After the forecast 05-08-2025Just take a look at the previous post I predicted where the price would go and see what happened and the sensitivity to these key levels. The price delivered perfectly on sensitive levels
Litecoin’s Bearish Signal: LTC dropped nearly 10%.Litecoin’s Bearish Signal: LTC dropped nearly 10%.
Litecoin formed a bearish harmonic pattern on the daily chart, completing near 129.20. This setup hints at a potential deeper correction or bearish wave—though that still needs confirmation.
Right after the pattern completed, price showed a strong rejection from the completion zone, adding weight to the bearish scenario.
Within 24 hours, LTC dropped nearly 10%.
I’m expecting a minimum pullback to 105.50. If the correction follows its natural path, price could revisit the previous key support zone near 89.
You may find more details in the chart!
Thank you and Good Luck!
PS: Please support with a like or comment if you find this analysis useful for your trading day

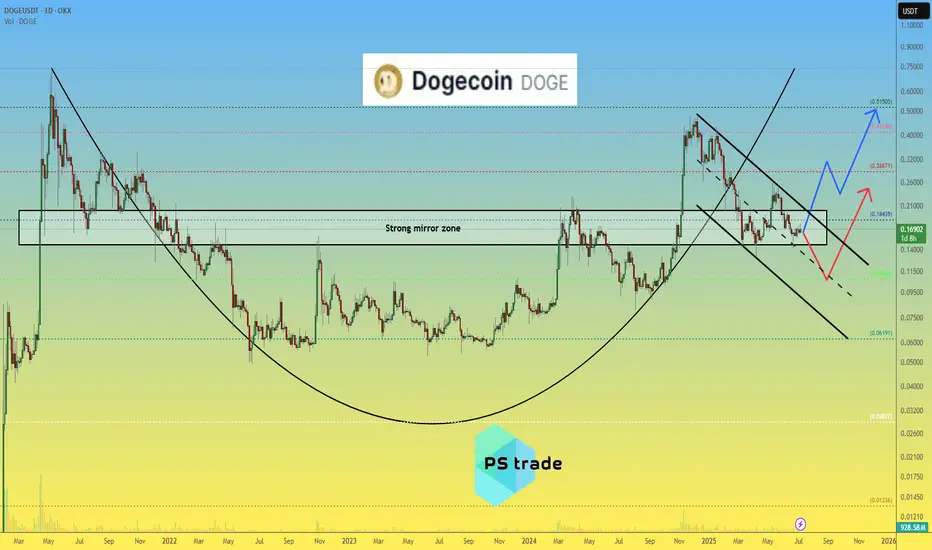
Dogecoin DOGE price analysisCRYPTOCAP:DOGE price is now in the middle of a strong mirror zone of $0.15-0.20
📈 It looks like the position is now accumulating, forming a "double bottom" and then, only a way for growth, to the highs in the region of $0.45-0.50
🐻 On the other hand, the scenario of another "leg" down fits perfectly into the TA canons. That is, it is very likely that if the price of OKX:DOGEUSDT drops below $0.15, then it is already fall to $0.10)
P.S.:
#Doge is an interesting asset, it is worth watching with one eye, and with the other eye, watch how the "battle" between Trump and Musk (who is the main influencer and "pumper" of #Dogecoin) will end.
💡 And then put the two pieces of information together and make a trading decision - "easy money" !)
_____________________
Did you like our analysis? Leave a comment, like, and follow to get more
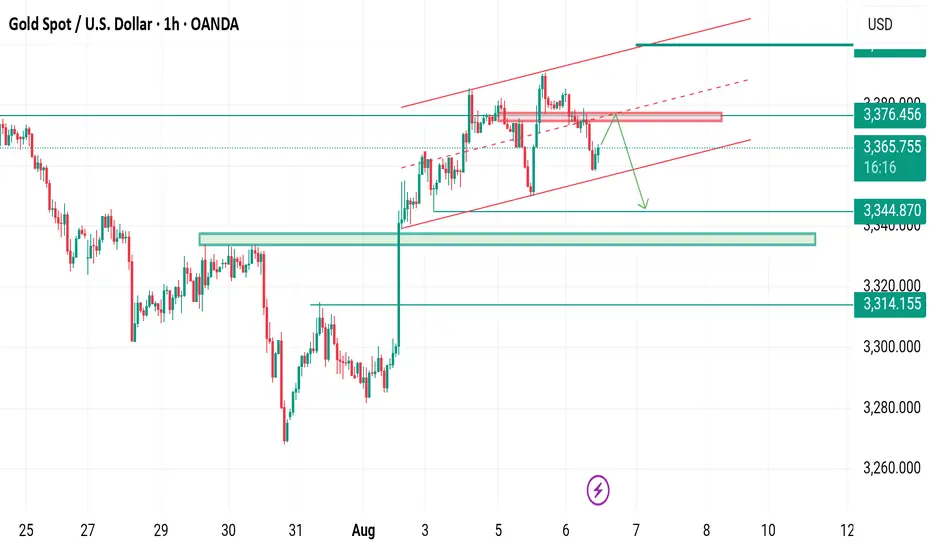
XAU/USD 06.08.25XAU/USD: Fresh Bullish Impulse Targeting $3,440 — Entry Point Confirmed
Market Overview:
After a corrective pullback to the EMA 144 and key support near $3,350, gold has confirmed a new bullish leg from point B. The recent rejection from the lows suggests a continuation toward the $3,440 target within the ABCD harmonic structure.
Technical Signals & Formations:
— 1H EMA(144) acted as dynamic support
— Strong bounce from $3,350 support zone
— Price is moving within an ascending channel
— ABCD pattern projects target around $3,440
— Breakout above $3,374 will validate further upside
Key Levels:
Support: $3,350, $3,374
Resistance: $3,440 (D1)
Scenario:
Primary: Bullish continuation to $3,440
Alternative: Short-term range between $3,360–$3,374 followed by upside breakout

Major U.S. News Ahead—Will EURUSD Pivot?Good morning, my friends 👋
Here’s my EURUSD market analysis 📉
Currently, the pair is in a downtrend. I expect this downward move to end around 1.14899 or 1.14536, where a potential buying opportunity may emerge. I personally plan to enter a buy position once price reaches those zones 💼
Also, keep an eye on major U.S. economic reports being released today—they could trigger increased volatility 🔔
Every like you send is a huge source of motivation for me to keep sharing high-quality analysis 🙏 Thanks to everyone supporting the channel 💙

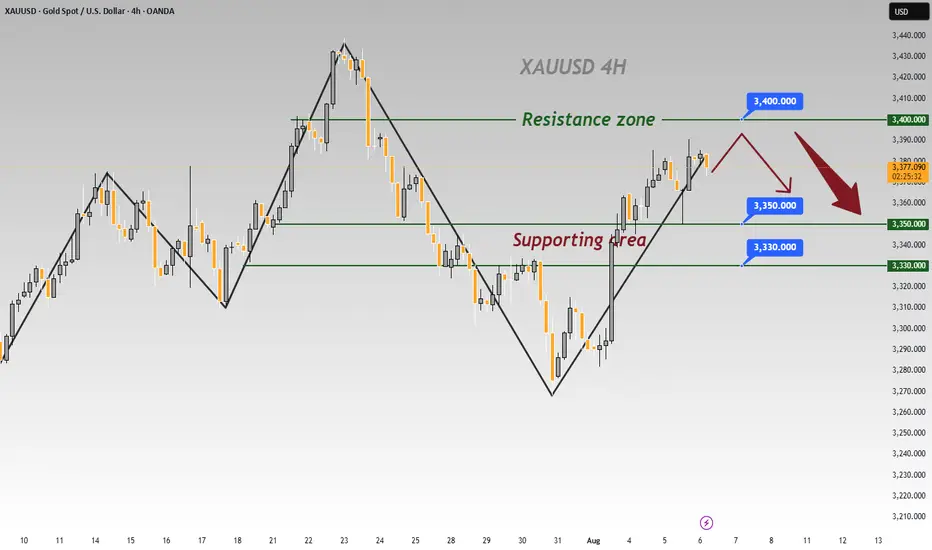
XAUUSDHello Traders! 👋
What are your thoughts on GOLD?
Gold remains trapped below the key $3,390–$3,400 resistance zone, which has rejected price multiple times in recent sessions.
A short-term pullback toward the marked support level is likely.
From that zone, we expect buyers to step in, leading to another bullish push toward the resistance, and this time, a potential breakout above the $3,400 level.
As long as the price stays above support, the bullish outlook remains intact.
A confirmed break above $3,400 could open the path toward new highs.
Don’t forget to like and share your thoughts in the comments! ❤️

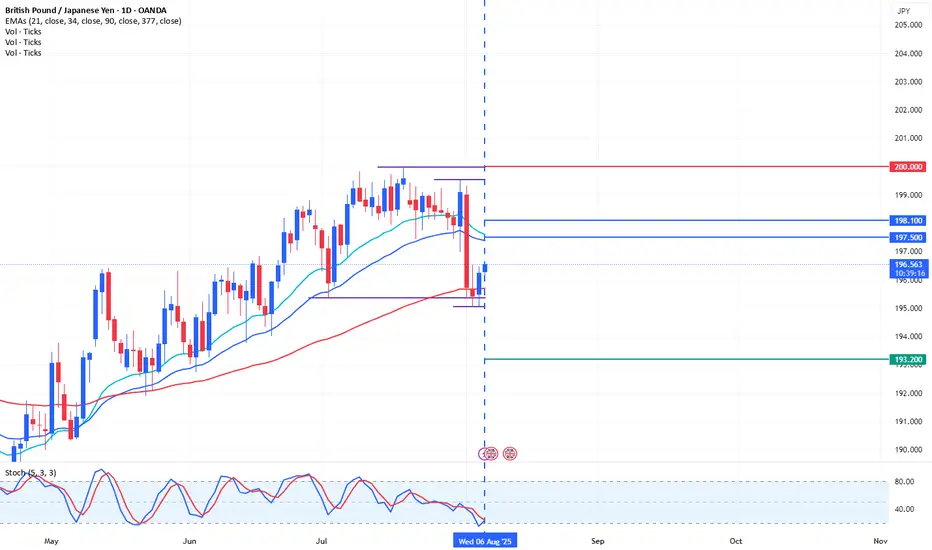
Trading Ideas GBPJPY 1D [Disc On]Fundamental Analysis:
The Fed Interest Rate: 4.50% (in line with expectation)
Bank of England Interest Rate: (release date August 7, 2025)
Note:
idk how to explain but all information is in that chart :v
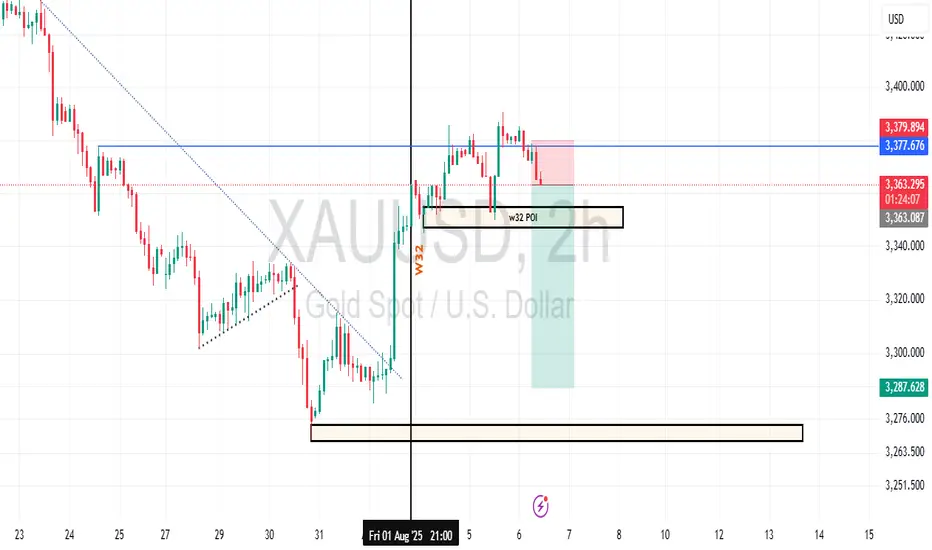
Gold Week 32 Possible reversalGold prices are in a clear downtrend, with critical support at $3,287.628 and resistance at $3,379.874. The 'W32 POI 2H' on Aug 1 highlighted a volatile 2-hour period with a sharp drop and recovery, signaling potential support strength. Fibonacci retracement levels could play a key role in identifying retracement targets. Stay disciplined with risk management as you navigate these levels.
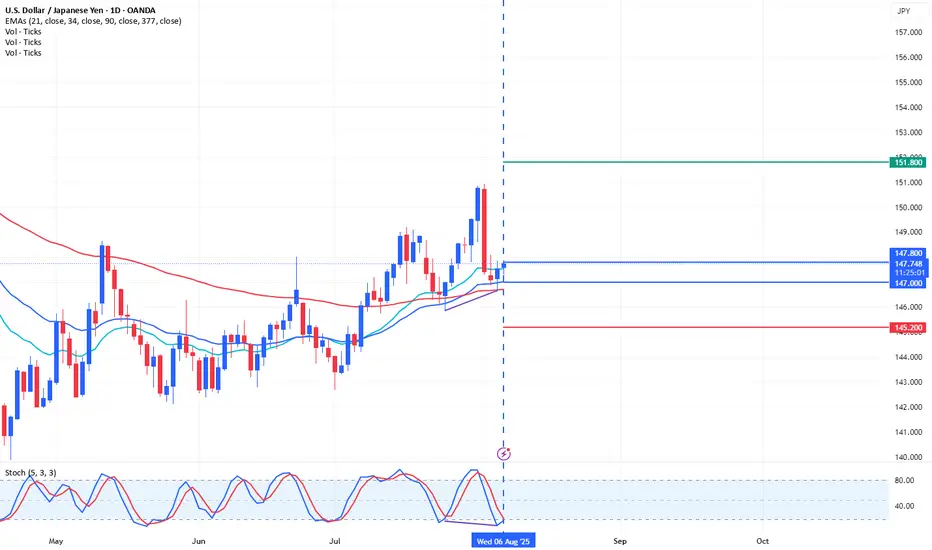
Trading Ideas USDJPY 1D [Disc On]Technical Analysis:
There is a hidden bullish stochastic divergence on the 1D timeframe, indicating a potential continuation of the previous trend. The price has also entered the Fibonacci 0.618 retracement area.
Conclusion:
There is a high probability of seeking BUY positions in the range of 147.800 – 147.000, with a Take Profit target at 151.800 and a Stop Loss at 145.200.
Dlala Holding ( DBIS ).Dlalal Stock on Explosive Level.
1st Target price ( Anti-Crab ) .
2nd Target price ( Anti-Bat ) / ( Alternate-Shark ) .
Highly recommended for Buying 👌- Strongly recommended for Buying 💥💥💥

Gold: Yesterday’s Surge & Today’s Session StrategyDuring yesterday’s U.S. trading session, gold surged to around 3390 🚀, driven by a series of tariff-related remarks from Trump, Fed personnel changes, and market expectations that the probability of a September rate cut has risen to 91% ⚡️. We successfully took profit near 3355 yesterday, locking in close to maximum gains 💰.
Today’s trading strategy:
Go short at highs during the Asian session 📉
Go long at lows during the European session 📈
Go short at highs again during the U.S. session 📉
⚡️⚡️⚡️ XAUUSD ⚡️⚡️⚡️
🚀 Sell@ 3390 - 3380
🚀 TP 3375 - 3366 - 3356
Daily updates bring you precise trading signals 📊 When you hit a snag in trading, these signals stand as your trustworthy compass 🧭 Don’t hesitate to take a look—sincerely hoping they’ll be a huge help to you 🌟 👇
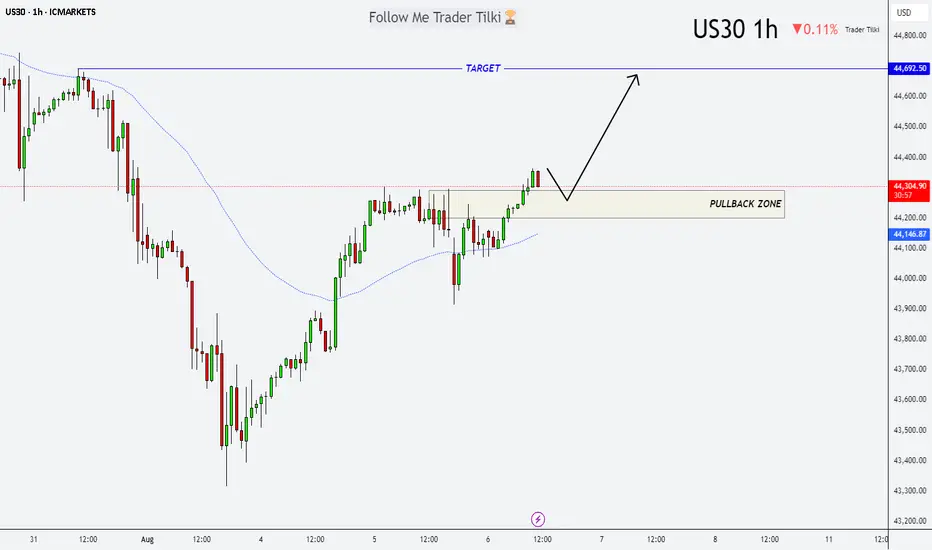
US30 at the Turn: Buy Setup from the Pullback ZoneHey friends 👋
Here’s my latest analysis on US30 (Dow Jones). I’m watching a potential pullback into the zone I marked: 44,292 – 44,190. I plan to open a buy position from that range, targeting 44,692 as my take-profit level.
Every single like you send is a huge source of motivation for me to keep sharing these insights. Big thanks to everyone supporting with a tap of appreciation 🙏
Volatile Times for GBPJPY: What’s Going On Behind the Moves?Good morning, Guys,
I’m anticipating a new short opportunity on GBPJPY once the pair reaches my sell zone level. From there, my target is set at 197.934.
Every like from you is what truly motivates me to keep sharing these insights.
Massive thanks to everyone who shows love and support!

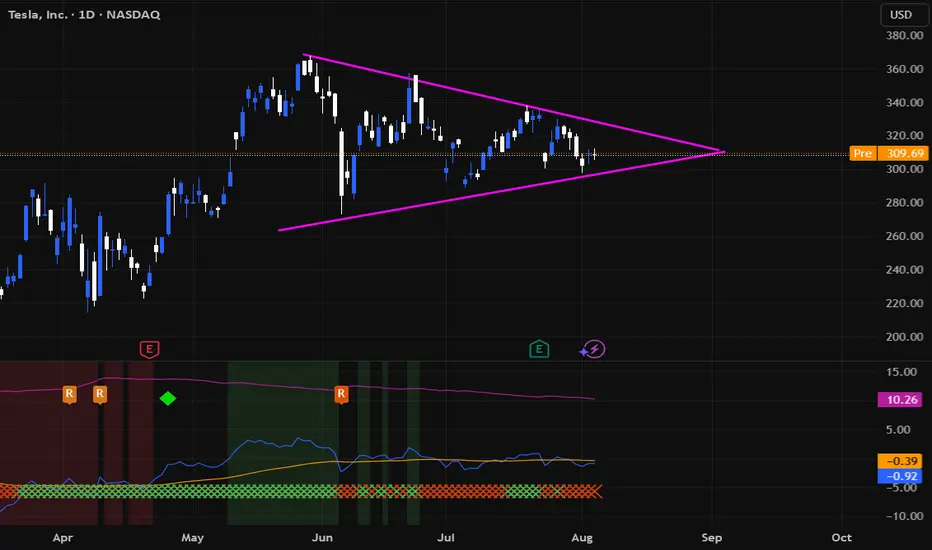
Leave your comment about TESLATesla is in a flag pattern on the daily time frame and I think there is fire under the ashes! Breaking the upper side of the triangle is good news for its holders.