Sell AUDJPYAUDJPY buy will quickly turn around and start shorting in the next few hours. Price will test the support at 94,342 soon. Price was already on a downtrend, yesterday we saw a bullish retracement to trigger sell orders.
Harmonic Patterns

XAUUSD BUY IDEA • Clear POI Identified:
Price is approaching a well-defined Point of Interest (POI) around 3,347–3,355. This zone aligns with prior demand and a potential entry point for institutions.
• Short-Term Weakness → Potential Reversal:
The market structure shows a retracement phase after a strong bullish impulse. The retrace is likely targeting discount levels within the POI.
• 50 EMA Confluence:
The 50 EMA (gray line) is rising and converging toward the POI, adding confluence for bullish continuation.
• Anticipated Reaction:
Expectation is for price to tap the POI, form an intraday reversal pattern, then continue upward toward higher liquidity zones.
⸻
🧠 Smart Money Perspective:
• Accumulation → Expansion:
Price may currently be accumulating orders before the next expansion leg.
• Low-Risk Entry Zone:
The POI offers a potential low-risk buy zone with stop-loss below the 3,347 region.

XAUUSD INTRADAY ANALYSIS – AUGUST 6, 2025Gold OANDA:XAUUSD is currently consolidating around the 3,371 zone after breaking above a descending trendline formed from late July highs. A strong bullish impulse on August 2nd with significant volume suggests renewed buying pressure. Price is now retesting the breakout area — a critical moment to determine if the bullish continuation is sustainable.
- Technical Breakdown:
1. Price Structure & Trendline:
The former resistance at Peak 1 (3,376) is now acting as new support.
A new ascending channel has formed following the breakout.
Price structure is showing higher highs and higher lows, indicating short-term bullish momentum.
2. Fibonacci & EMA:
The Fibonacci retracement of the recent bullish wave (Aug 1–5) aligns the 0.382 and 0.5 zones with strong support around 3,365 – 3,352.
Price is hovering near the EMA20, and a close above this level will further confirm upside potential.
3. RSI Indicator:
RSI is stabilizing around 50–55, reflecting neutral momentum with room for bullish continuation.
- Key Price Levels:
3,352 – 3,365: Major Support (Fib + EMA + previous lows)
3,376 – 3,380: Immediate Support (breakout retest area)
3,390: Minor Resistance
3,438: Bullish Target (Peak 2)
- Suggested Trading Strategy:
Primary Bias: BUY if price holds above 3,365
Entry Zone: Around 3,369–3,372 (retest + trendline confluence)
Stop Loss: Below 3,352
Take Profit: 3,438 (previous peak)
Risk/Reward: ~1:9 (very favorable setup)
- Look for bullish confirmation (e.g., bullish engulfing or pin bar around 3,365–3,370) for a high-probability entry.
- Alternate Scenario:
If price breaks below 3,352 with strong volume, the bullish thesis may be invalidated. In that case, consider short-term short positions targeting 3,320 area.
This chart setup presents a promising trend-continuation opportunity, with technical confluences supporting further upside. As always, wait for clear price action signals before entry and manage risk accordingly.

ENTRY EURJPYDisclaimer:
This is merely a chart-based analytical trading idea and is not considered investment advice. Please manage your risks carefully and conduct your own research before making any trading decisions.

Bitcoin Long-Term Investment Outlook 1W [Disc On]Bitcoin Long-Term Investment Outlook
Technical Analysis:
A bearish stochastic divergence has formed on the weekly (1W) chart, indicating a potential trend reversal downward toward the Fibonacci cluster support zone.
Conclusion: There is a high probability of seeking BUY positions at the psychological levels of 107,300 – 103,400 and 92,800 – 91,800, with a Take Profit target at 140,600.
(Note: Always confirm with volume and macroeconomic factors before execution.)

135K COMING! Retrograde rallies!Heres a quick update on my take on Bitcoin reacting to Mercury retrograde, the moon cycles and our lunar eclipse in early September.
We are at our last stages in this bull market before BTC starts bleeding into September. It's critical to know how we are sitting technically, so please stay calm and observe the market neutrally.
- 112K Support is holding firm, this level is critical as Mercury retrograde enters Q3, which Quarter 3 has been historically bullish for Bitcoin.
- However, bearish energy could still linger until August 14th, as that date is within a 5 day window of a full moon. From now until the 14th will be a cooling zone and consolidation zone. Our RSI is sitting nice and neutral, not reacting to much to the recent drop, meaning more room for upside.
- From August 14th - 28th, we will start to see euphoria in the market. After we are supported on the 117.5K level a 15% rally could take us to the 1.618 FIB level, i'm taking profits at 135K.
- After that, we face the second lunar eclipse of this cycle on September 7th. Historically every Lunar eclipse has bearish energy, and I'm excepting to re accumulate after a 30 - 35% correcting from the recent top out.
This will be the end of the Bitcoin rally, naturally creating a bleed from BTC into the ALT's, Bitcoin will drop as well as dominance and ALT season will kick in. Bye Bye BTC until march for a little swing...

PHAUSDT at Make-or-Break Zone Is This the Calm Before the Storm?📍 Chart Overview (6D Timeframe – Binance)
PHA/USDT is currently retesting a major historical demand zone between $0.0703 - $0.0986, highlighted by the yellow box. This zone has acted as a strong base since mid-2022, repeatedly absorbing selling pressure and bouncing the price back up.
Over the past two years, this accumulation zone has consistently held, forming a classic sideways structure, typically seen before a major breakout. However, the inability to break through the upper resistances suggests persistent bearish pressure.
Now, the market is nearing a make-or-break moment that could lead to a decisive move in either direction.
---
🔎 Pattern Identified: "Extended Accumulation + Volatility Compression"
The price is trading inside a long-term accumulation range, indicating that smart money might be quietly buying.
We're seeing signs of volatility compression, a precursor to breakout volatility.
Repeated lower wicks near the demand zone show strong buying interest on dips.
This setup may produce a “spring” scenario, where a false breakdown triggers a strong reversal rally.
---
🟢 Bullish Scenario (Rejection From Demand Zone):
If the price continues to hold above $0.0986 and forms a higher low structure:
Bullish Targets:
1. $0.1357 – Minor historical resistance
2. $0.1897 – Key horizontal resistance
3. $0.3790 – Mid-range breakout target
4. $1.0666 – Long-term retracement target
Bullish Confirmation Signals: ✅ Break and daily close above $0.1357
✅ Increased volume on breakout
✅ Bullish candle structure near support
---
🔴 Bearish Scenario (Breakdown of Accumulation Zone):
If the price fails to hold $0.0703 – $0.0986 and breaks down with strong volume:
Bearish Targets:
1. $0.0590 – Psychological support
2. Below $0.0500 – Open downside
3. Trend shifts into bearish continuation structure
Bearish Confirmation Signals: ❌ Strong close below $0.0703
❌ Volume spike on red candle
❌ Lack of bullish response
---
🧠 Strategic Notes for Traders & Investors:
This zone offers a low-risk, high-reward opportunity for speculative positioning, with a tight stop-loss below $0.0703.
Due to prolonged compression, any breakout (up or down) could be explosive.
Be cautious of false breakouts. Wait for confirmation via volume and price action.
---
🗣️ Conclusion:
PHA/USDT is sitting at a technical inflection point that has historically triggered strong market reactions. After two years of coiling price action, this extended accumulation phase is nearing its resolution.
What happens next will likely define the long-term trajectory for this asset. Don’t sleep on this setup — whether you’re bullish or bearish, this is where attention should be focused.
#PHAUSDT #PHA #CryptoAnalysis #AltcoinSetup #TechnicalAnalysis #BreakoutWatch #AccumulationZone #StrongSupport #CryptoTrading

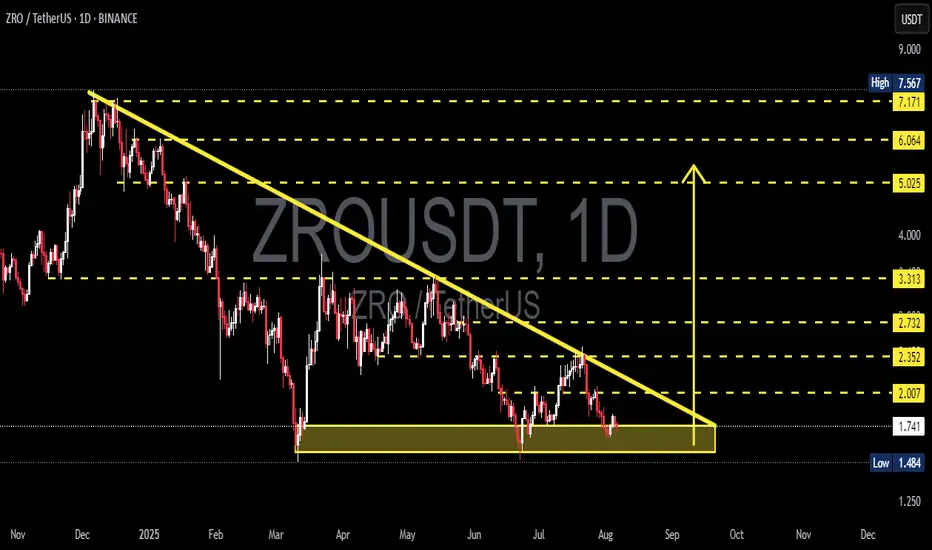
ZRO/USDT Coiled for a Major Move – Breakout or Breakdown?📌 Overview:
The ZRO/USDT pair is currently at a highly critical point. Price action has been consolidating within a large Descending Triangle for several months, and is now coiling near the apex — a classic signal of an incoming major move.
The strong support zone around 1.73 – 1.74 USDT has been tested multiple times and continues to hold, while the long-standing descending trendline from the all-time high acts as key dynamic resistance.
---
📊 Pattern & Market Structure Analysis:
🟡 Pattern: Descending Triangle
Flat horizontal support at ~1.73 USDT has acted as a demand zone.
Consistent lower highs suggest continued selling pressure and market indecision.
While typically a bearish continuation pattern, this setup can also lead to a bullish reversal breakout if resistance is breached with volume.
🧱 Key Support:
The highlighted yellow box shows clear accumulation, where buyers continue to defend the zone.
A breakdown below this support could trigger sharp downside movement and panic selling.
📉 Descending Resistance:
The downward sloping trendline is the critical breakout level.
A strong daily candle close above it would invalidate the bearish structure.
---
🚀 Bullish Scenario (Breakout):
If the price successfully breaks above the descending trendline with volume:
Short-term targets: 2.007 → 2.352 USDT
Mid-term targets: 2.732 → 3.313 USDT
Long-term bullish targets: 5.025 – 6.064 USDT and beyond
Additional confirmations: Volume spike, bullish RSI breakout, daily close above resistance.
---
🔻 Bearish Scenario (Breakdown):
If price fails to hold 1.73 USDT and breaks down:
Initial downside target: 1.484 USDT (historical support)
If that fails, ZRO may enter new low zones below 1.40
Breakdown with high volume would validate a strong bearish trend continuation.
---
🧠 Possible Strategies:
Breakout traders: Entry on daily candle close above descending trendline with volume.
Retest buyers: Wait for breakout, then enter on a successful retest of the trendline as new support.
Short sellers: Look for breakdown below 1.73 zone for short opportunities to 1.48 or lower.
Always use tight stop-loss based on volatility and support/resistance zones.
---
📈 Conclusion:
ZRO is at a make-or-break point. The market is coiling tightly within a Descending Triangle, and a massive move is likely just around the corner. Whether that move is up or down will depend on how price reacts to the descending trendline and the horizontal support.
Traders should stay alert and watch for either a confirmed breakout above the trendline, or a confirmed breakdown below the 1.73 USDT support level. The reaction here will set the tone for ZRO’s next big trend.
#ZRO #ZROUSDT #CryptoBreakout #TechnicalAnalysis #DescendingTriangle #AltcoinSetup #SupportAndResistance #CryptoChart #BreakoutWatch
06.08.25 Morning ForecastPairs on Watch -
FX:GBPAUD
FX:EURAUD
FX:EURUSD
FX:EURCAD
A short overview of the instruments I am looking at for today, multi-timeframe analysis down to what I will be looking at for an entry. Enjoy!

BITCOIN BITCOIN is cooling off from last attempted all time high at 123k 122k zone .the daily ascending trend and 4hr is giving a demand floor which will be watched on possible breakout from the structure ON 4HRS
On 4hrs we have a break out of a descending trendline and followed by two successful sell off connecting us from our current all time high. if we dont reclaim that supply roof by returning to buying floor ,then sellers will push to break the daily ascending trendline acting as dynamic support and our target from our EMA+SMA STRATEGUY IS 99-100 ZONE and on a flip side if we see buying liquidity from cooperate buying ,then we will hope for retest if 123k and extend the greed buying 128k-130k-135k will be targeted.
trading is 100% probability and any key level can fail, pls manage your risk
A trader without capital is a demo trader.
As a trader, your biggest weapon in the financial market is your capital,dont play or gamble with it.
GOODLUCK,PLS LIKE AND SHARE IF YOU LIKE THE IDEA AND INSIGHT.

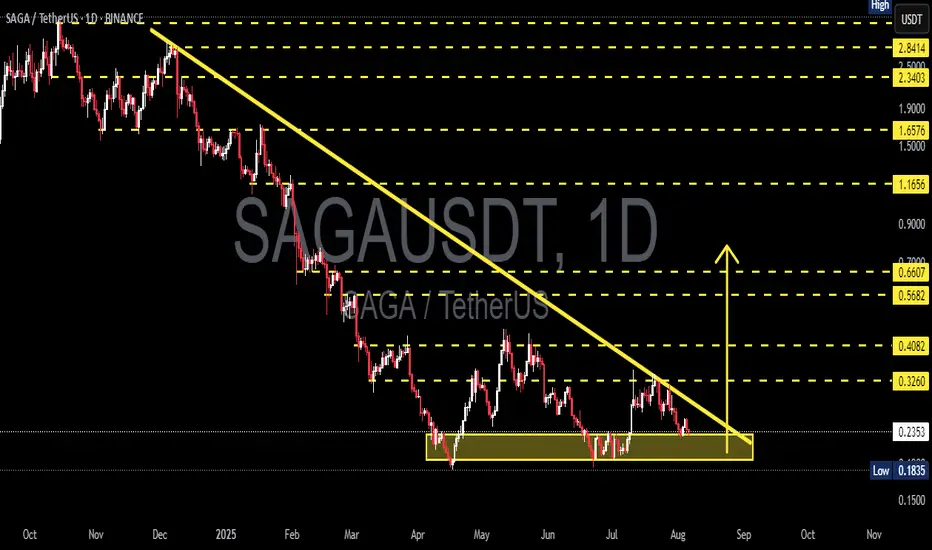
SAGA/USDT – Endgame of Descending Triangle, Big Move Coming!🧠 Overview:
SAGA/USDT has been forming a Descending Triangle pattern for nearly 6 months, reflecting sustained selling pressure while maintaining strong horizontal support between $0.2352 – $0.1835. The price is now approaching the apex of the triangle, suggesting that a major move is imminent — either a bullish breakout or a bearish breakdown.
This setup is a classic “make or break” moment that often precedes explosive price action.
---
🔍 Technical Pattern: Descending Triangle
Dynamic Resistance: Lower highs forming a clear downtrend since February 2025.
Strong Support: The base of the triangle is solidified in the $0.2352–$0.1835 zone, which has been tested multiple times.
This pattern shows increasing sell pressure, but also persistent buyer defense — tension is rising.
---
🟢 Bullish Scenario: Breakout and Trend Reversal?
A confirmed breakout above the descending trendline and resistance at $0.3260 would signal a potential trend reversal and the start of bullish momentum.
📌 Bullish Target Levels:
1. $0.4082 – first local resistance
2. $0.5682 – volume-heavy area
3. $0.6607 – measured breakout target
4. $1.1656 – medium-term resistance
5. $1.6576 to $2.34 – possible if strong altcoin rally occurs
📈 Bullish Confirmation Signals:
Strong bullish candle close above trendline
Significant volume spike
RSI bouncing from neutral or oversold area
---
🔴 Bearish Scenario: Breakdown from Support
If the price breaks below $0.2352 and fails to hold the critical level at $0.1835, it may trigger a deeper continuation of the long-term downtrend.
📌 Bearish Target Zones:
$0.1500 psychological level
Possibly lower, depending on macro sentiment
⚠️ Caution:
Watch out for false breakdowns — wait for daily candle confirmation before reacting emotionally.
---
📊 Strategic Summary:
SAGA is at a critical inflection point — either it breaks out to reverse the trend or continues the downtrend with new lows. While descending triangles are typically bearish patterns, bullish breakouts can invalidate the structure, especially if supported by volume and sentiment.
💡 Pro Tip:
Always wait for daily candle close confirmation
Use RSI/MACD to confirm momentum shifts
Set tight stop-losses, especially near support/resistance
#SAGAUSDT #CryptoAnalysis #TechnicalBreakout #DescendingTriangle #BullishSetup #Altcoins #TrendReversal #CryptoChart #BreakoutWatch #VolumeAnalysis #PriceAction
#SUI/USDT 4H: Broke out of a falling wedge with bullish momentum#SUI/USDT 4H: Broke out of a falling wedge with bullish momentum, now holding an ascending trendline. Watch for a retest around $3.40–$3.20. Holding above this zone targets $4.00 and $4.80. A break below $3.00 invalidates the setup.

MORNING FORECASTING KEY LESSONSIn depth details on the things that you need to focus on when we are doing our morning forecasting as this is very important details to consider, do let me know in the comments sections below how do you find the video.

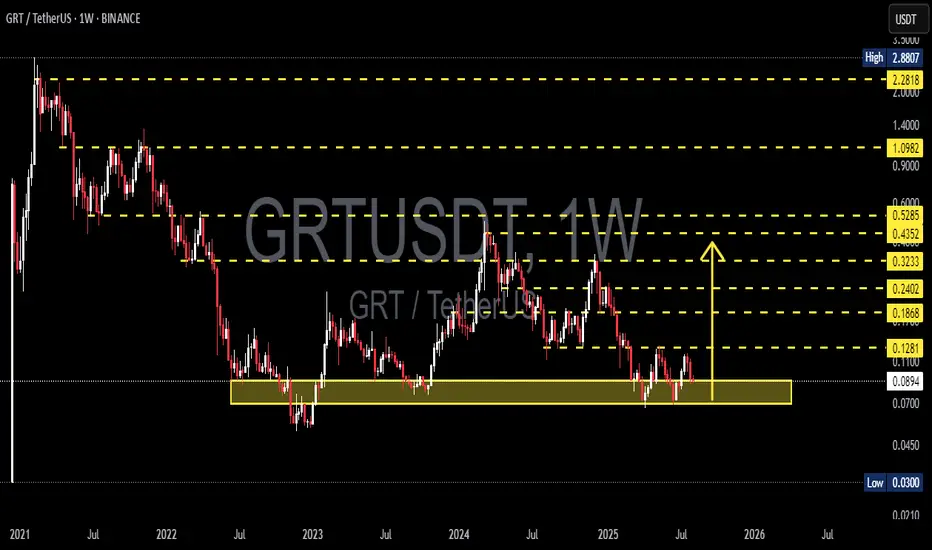
GRT/USDT Weekly Analysis — “Life or Death Zone” for The Graph!🟡 🔥 Critical Zone: Demand Area in Play!
The Graph (GRT) is retesting one of its most critical historical demand zones — the $0.0700 to $0.0897 area — a level that has acted as strong support multiple times since mid-2022.
> This zone is not just a support — it’s a make-or-break level that has defined the survival of the GRT trend on the higher timeframes.
The current price action shows hesitation, low volatility, and potential accumulation — all classic signs that a major move is brewing.
---
📊 Technical Structure & Price Behavior
GRT has been trading in a wide sideways channel after a long-term downtrend, with multiple bounce attempts off this demand zone.
No higher highs have been confirmed since the last rally towards $0.24.
Volume appears to be declining, indicating compression before expansion.
Price has failed to break and sustain above key resistance levels, hinting that buyers are cautious — or waiting for macro confirmation.
---
🐂 Bullish Scenario: Accumulation & Breakout Potential
If buyers continue to defend the $0.0700–$0.0897 zone, and GRT can break above short-term resistance at $0.1281, this could confirm a reversal structure or at least a mid-term relief rally.
🎯 Potential Bullish Targets:
1. $0.1281 – minor local resistance
2. $0.1868 – structural breakout level
3. $0.2402 – previous rejection zone
4. $0.3233 – historical supply
5. $0.4352 & $0.5285 – macro targets if momentum builds
> A breakout above $0.1868 with volume could kickstart a trend reversal towards the $0.30–$0.50 region.
---
🐻 Bearish Scenario: Breakdown Below Demand
However, if GRT loses the $0.0700 key support, this would invalidate the accumulation thesis and potentially trigger panic selling.
⚠️ Bearish Breakdown Targets:
$0.0450 – intermediate support
$0.0300 – all-time low and last line of defense
> A breakdown would likely signal a return to macro bearish sentiment and a reset of the entire structure.
---
🔄 Market Psychology: The Calm Before the Storm?
We are in a classic zone of indecision, where both bulls and bears are waiting for a confirmation. This setup is often followed by high-volatility breakout or breakdown moves.
Traders and investors alike should be watching this area very closely.
---
📌 Strategic Summary:
Strategy Type Action
Long-term Investors Accumulation with strict stop below $0.0700
Swing Traders Wait for breakout of $0.1281 with confirmation
Risk-Averse Traders Avoid until direction is clear above $0.1868 or below $0.0700
#GRT #GRTUSDT #CryptoAnalysis #AltcoinUpdate #TechnicalAnalysis #SupportAndResistance #CryptoBreakout #DemandZone #AltcoinWatchlist #CryptoReversal #TheGraph
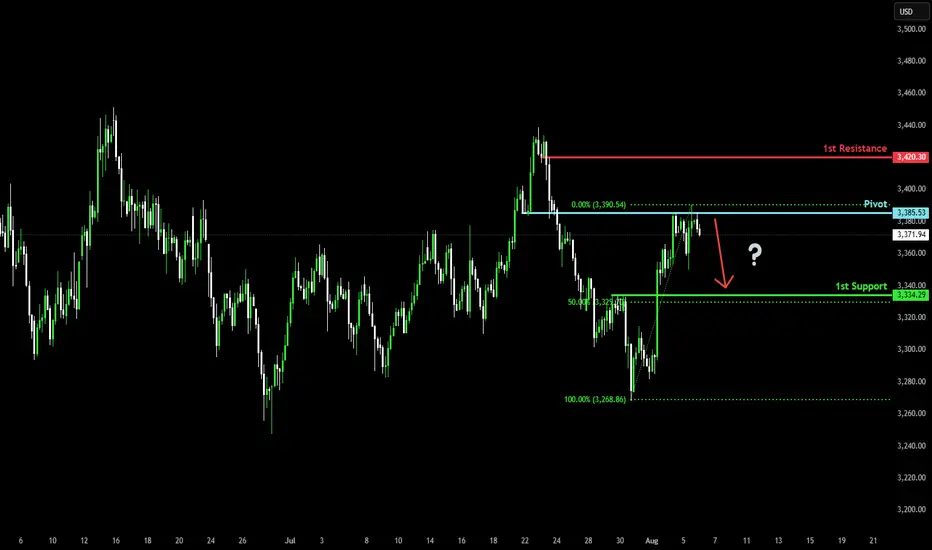
Bearish drop for the Gold?The price has rejected off the pivot which has been identified as a pullback resistance and could drop to the 50% Fibonacci support.
Pivot: 3,385.53
1st Support: 3,334.29
1st Resistance: 3,420.30
Risk Warning:
Trading Forex and CFDs carries a high level of risk to your capital and you should only trade with money you can afford to lose. Trading Forex and CFDs may not be suitable for all investors, so please ensure that you fully understand the risks involved and seek independent advice if necessary.
Disclaimer:
The above opinions given constitute general market commentary, and do not constitute the opinion or advice of IC Markets or any form of personal or investment advice.
Any opinions, news, research, analyses, prices, other information, or links to third-party sites contained on this website are provided on an "as-is" basis, are intended only to be informative, is not an advice nor a recommendation, nor research, or a record of our trading prices, or an offer of, or solicitation for a transaction in any financial instrument and thus should not be treated as such. The information provided does not involve any specific investment objectives, financial situation and needs of any specific person who may receive it. Please be aware, that past performance is not a reliable indicator of future performance and/or results. Past Performance or Forward-looking scenarios based upon the reasonable beliefs of the third-party provider are not a guarantee of future performance. Actual results may differ materially from those anticipated in forward-looking or past performance statements. IC Markets makes no representation or warranty and assumes no liability as to the accuracy or completeness of the information provided, nor any loss arising from any investment based on a recommendation, forecast or any information supplied by any third-party.
ETHUSD formed a bearish bat patternOn the daily chart, ETHUSD formed a bearish bat pattern. The price is currently declining, with the first downside target around 3082 (0.382 ratio of CD), and the second target around 2831 (0.618 ratio of CD).

Potential bearish drop?S&P500 is rising towards the pivot, which is a pullback resistance that aligns with the 61.8% Fibonacci retracement and could drop to the 1st support.
Pivot: 6,362.20
1st Support: 6,214.78
1st Resistance: 6,436.72
Risk Warning:
Trading Forex and CFDs carries a high level of risk to your capital and you should only trade with money you can afford to lose. Trading Forex and CFDs may not be suitable for all investors, so please ensure that you fully understand the risks involved and seek independent advice if necessary.
Disclaimer:
The above opinions given constitute general market commentary, and do not constitute the opinion or advice of IC Markets or any form of personal or investment advice.
Any opinions, news, research, analyses, prices, other information, or links to third-party sites contained on this website are provided on an "as-is" basis, are intended only to be informative, is not an advice nor a recommendation, nor research, or a record of our trading prices, or an offer of, or solicitation for a transaction in any financial instrument and thus should not be treated as such. The information provided does not involve any specific investment objectives, financial situation and needs of any specific person who may receive it. Please be aware, that past performance is not a reliable indicator of future performance and/or results. Past Performance or Forward-looking scenarios based upon the reasonable beliefs of the third-party provider are not a guarantee of future performance. Actual results may differ materially from those anticipated in forward-looking or past performance statements. IC Markets makes no representation or warranty and assumes no liability as to the accuracy or completeness of the information provided, nor any loss arising from any investment based on a recommendation, forecast or any information supplied by any third-party.

JOE/USDT Approaching a Major Turning Point: Will Buyers Step In?🔎 Market Overview & Structure:
JOE/USDT is currently trading within a major historical demand zone between $0.1241 – $0.1548, a level that has proven to be a strong support since early 2023. Each time the price revisits this area, we’ve seen significant bounces — indicating that buyers continue to defend this zone aggressively.
However, the macro structure still reflects a clear long-term downtrend from its all-time high.
---
🧠 Why This Zone Matters (Demand Zone Characteristics):
This zone has been tested multiple times and remains intact, showing strong buyer interest and accumulation.
It acts as the final defense before a possible major breakdown.
Institutions and smart money often accumulate in zones like this – making it a Low Risk, High Reward area.
---
🟢 Bullish Scenario – Is a Mid-Term Reversal Brewing?
If the price holds above the $0.1241 level and breaks through $0.1885:
1. A reversal pattern (base or double bottom) may form.
2. Potential upside targets:
🎯 TP1: $0.1885 → First resistance breakout
🎯 TP2: $0.2332 → Key horizontal resistance
🎯 TP3: $0.4087 → Next major supply zone
🎯 TP4 (Mid-Term): $0.6254 – $0.9569 if strong bullish momentum continues
3. A daily or 5D candle close above $0.2332 with high volume would confirm a trend shift to the upside.
---
🔴 Bearish Scenario – Danger of Breakdown:
If the price breaks below $0.1241:
A new Lower Low structure will confirm continued bearish trend.
There's no major historical support below this zone, opening the door for a sharp decline into uncharted territory.
This would signal renewed seller dominance and likely a prolonged bearish phase.
---
📐 Price Patterns & Structure:
Current price action resembles an accumulation range or base formation.
Possibility of:
🔁 Double Bottom
⏳ Adam & Eve Reversal Pattern
A breakout from this range could spark a strong upside rally.
---
💡 Strategy Insights:
Accumulation Entry Zone: $0.1241 – $0.1548 with tight stop-loss.
Bullish Confirmation: Breakout and close above $0.1885 with volume.
Bearish Confirmation: Daily close below $0.1241 → avoid longs, consider shorts.
---
📌 Conclusion:
JOE/USDT is at a make-or-break level. This is a key decision point where the price could either start a mid-term bullish reversal or fall into deeper bearish territory.
For long-term investors, this is a potential accumulation zone with favorable risk-reward. For traders, it's time to watch closely for breakout or breakdown confirmations.
#JOEUSDT #CryptoAnalysis #Altcoins #BreakoutTrading #ReversalZone #DemandZone #TechnicalAnalysis #JOEToken #CryptoSetup

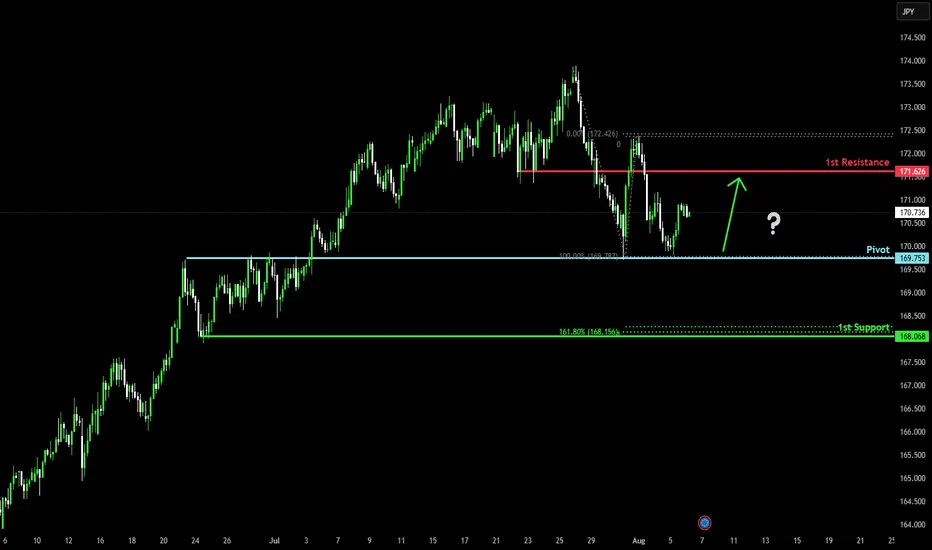
Bullish bounce off?EUR/JPY has bounced off the pivot which has been identified as an overlap support and could rise to the 1st resistance.
Pivot: 169.75
1st Support: 168.06
1st Resistance: 171.62
Risk Warning:
Trading Forex and CFDs carries a high level of risk to your capital and you should only trade with money you can afford to lose. Trading Forex and CFDs may not be suitable for all investors, so please ensure that you fully understand the risks involved and seek independent advice if necessary.
Disclaimer:
The above opinions given constitute general market commentary, and do not constitute the opinion or advice of IC Markets or any form of personal or investment advice.
Any opinions, news, research, analyses, prices, other information, or links to third-party sites contained on this website are provided on an "as-is" basis, are intended only to be informative, is not an advice nor a recommendation, nor research, or a record of our trading prices, or an offer of, or solicitation for a transaction in any financial instrument and thus should not be treated as such. The information provided does not involve any specific investment objectives, financial situation and needs of any specific person who may receive it. Please be aware, that past performance is not a reliable indicator of future performance and/or results. Past Performance or Forward-looking scenarios based upon the reasonable beliefs of the third-party provider are not a guarantee of future performance. Actual results may differ materially from those anticipated in forward-looking or past performance statements. IC Markets makes no representation or warranty and assumes no liability as to the accuracy or completeness of the information provided, nor any loss arising from any investment based on a recommendation, forecast or any information supplied by any third-party.
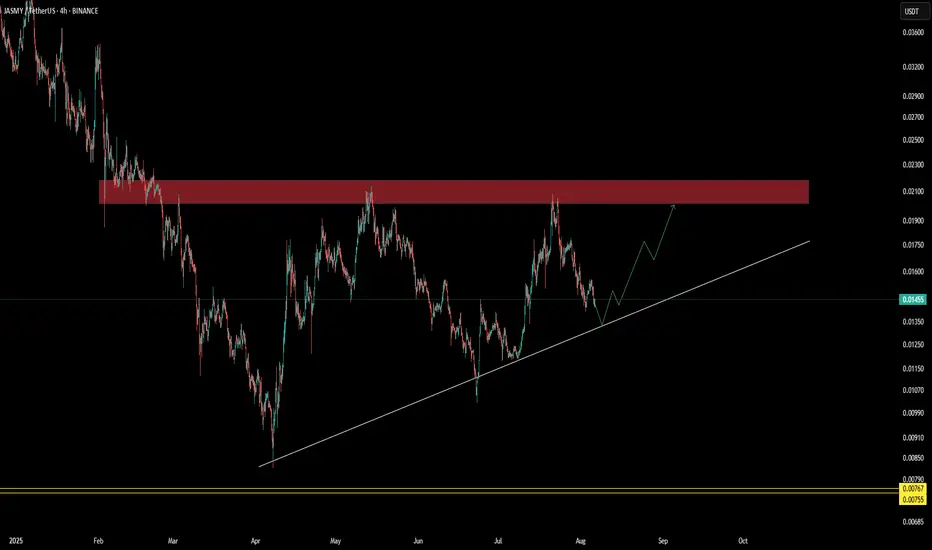
$JASMY ascending triangle patternSEED_DONKEYDAN_MARKET_CAP:JASMY price is hovering near the support trendline, and the chart is forming a bullish structure with consistent higher lows.
If the price manages to hold, this could be a good buy zone near support IMO.
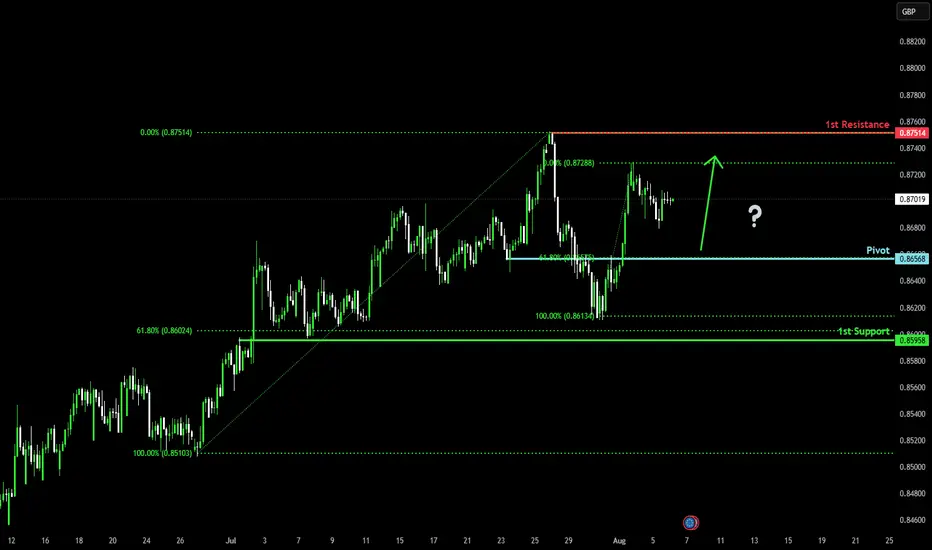
Falling towards 61.8% Fibonacci support?EUR/GBP is falling towards the pivot and could bounce to the 1st resistance which is a swing high resistance.
Pivot: 0.8656
1st Support: 0.8595
1st Resistance: 0.8751
Risk Warning:
Trading Forex and CFDs carries a high level of risk to your capital and you should only trade with money you can afford to lose. Trading Forex and CFDs may not be suitable for all investors, so please ensure that you fully understand the risks involved and seek independent advice if necessary.
Disclaimer:
The above opinions given constitute general market commentary, and do not constitute the opinion or advice of IC Markets or any form of personal or investment advice.
Any opinions, news, research, analyses, prices, other information, or links to third-party sites contained on this website are provided on an "as-is" basis, are intended only to be informative, is not an advice nor a recommendation, nor research, or a record of our trading prices, or an offer of, or solicitation for a transaction in any financial instrument and thus should not be treated as such. The information provided does not involve any specific investment objectives, financial situation and needs of any specific person who may receive it. Please be aware, that past performance is not a reliable indicator of future performance and/or results. Past Performance or Forward-looking scenarios based upon the reasonable beliefs of the third-party provider are not a guarantee of future performance. Actual results may differ materially from those anticipated in forward-looking or past performance statements. IC Markets makes no representation or warranty and assumes no liability as to the accuracy or completeness of the information provided, nor any loss arising from any investment based on a recommendation, forecast or any information supplied by any third-party.
Bitcoin Ready for Takeoff - $150K Target Ahead! MARKETSCOM:BITCOIN is showing impressive strength after successfully retesting its May high and bouncing back with conviction. This level, along with the 50 EMA, is currently acting as a strong support zone. Holding above this area signals that buyers are in control, and this zone now serves as a major support for the ongoing bullish trend.
At the moment, CRYPTOCAP:BTC is facing minor resistance in the $115K–$116K range. A decisive breakout above this level is likely to trigger strong momentum, opening the doors for a new all-time high. Once this resistance is cleared, our previous projection of $150K comes into play as the next major target.
For now, it’s crucial for MARKETSCOM:BITCOIN to hold the current support zone to maintain the bullish structure. As always, traders should manage risk effectively and place stop-losses to protect their capital in case of unexpected volatility.
Follow Our Tradingview Account for More Technical Analysis Updates, | Like, Share and Comment Your thoughts

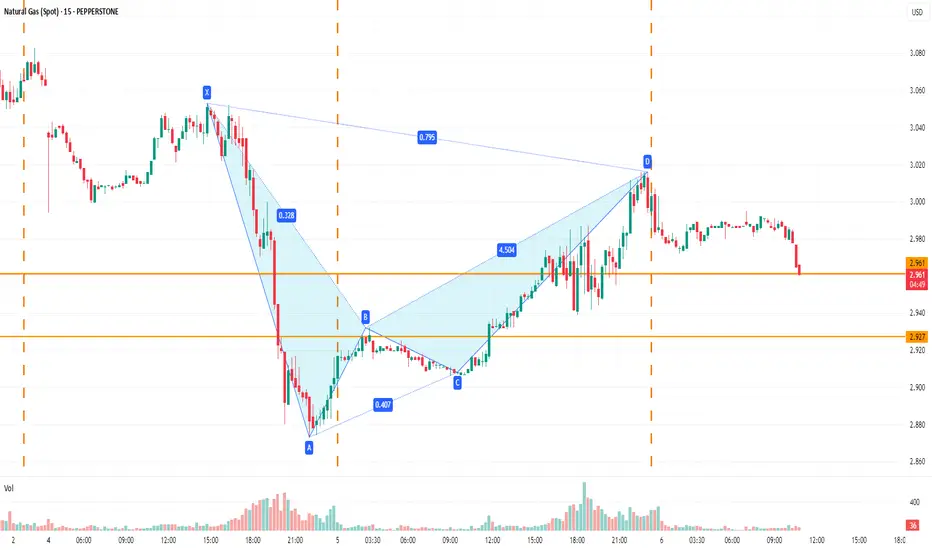
Natural GasBearish bat pattern formed though first target achieved not able to post on time when detected but still there is room and also wave B may be folding and moving for wave C new low possible but time wise still one up may come but that possibly be selling opportunity.