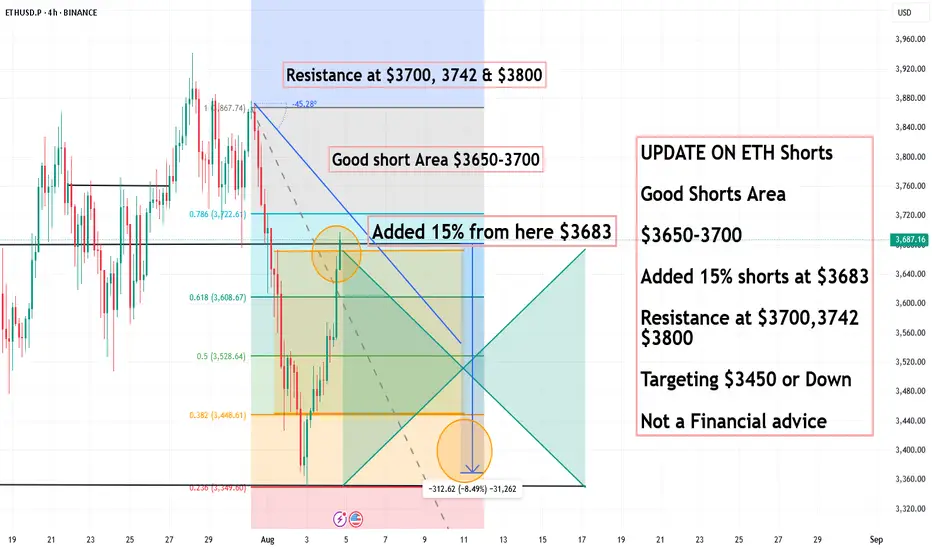
UPDATE ON ETH Shorts, Good Shorts Area $3650-3700UPDATE ON ETH Shorts
Good Shorts Area
$3650-3700
Added 15% shorts at $3683
Resistance at $3700,3742
$3800
Targeting $3450 or Down
Not a Financial advice
Harmonic Patterns
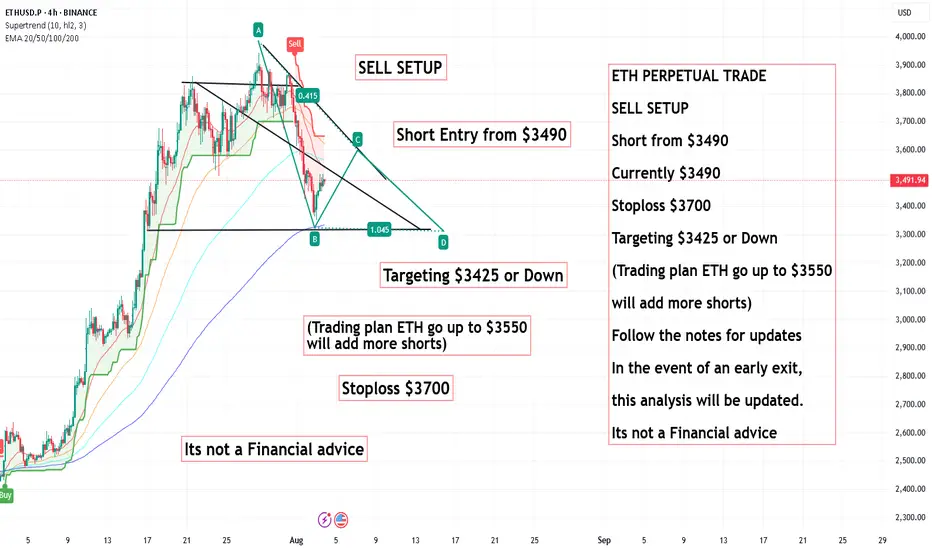
ETH PERPETUAL TRADE ,Short from $3490ETH PERPETUAL TRADE
SELL SETUP
Short from $3490
Currently $3490
Stoploss $3700
Targeting $3425 or Down
(Trading plan ETH go up to $3550
will add more shorts)
Follow the notes for updates
In the event of an early exit,
this analysis will be updated.
Its not a Financial advice
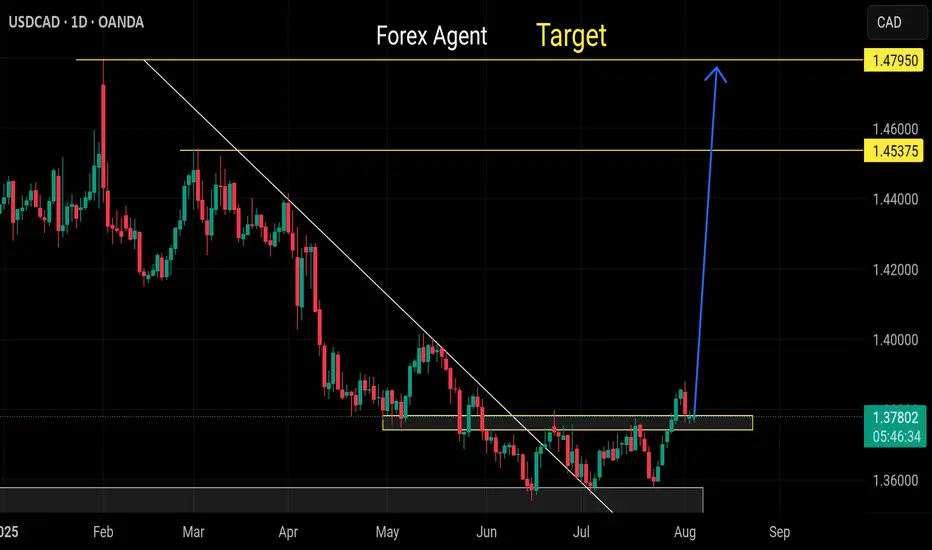
Usdcad buy Remain strong bullish
Trend broken
Respecting its support level wait for LTF confirmation the. Straight buy
Sell gbpusd Still remain bearish continuation
Trend buy already broken , lower low also broken
Respecting down trend structure

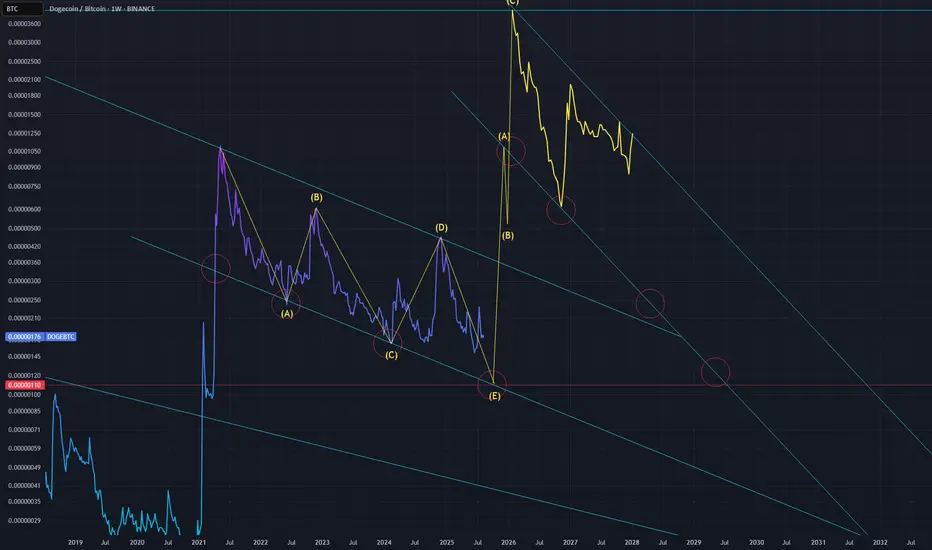
BITCOIN LOG UPDATESThis meaningful indicators on logarithmic, Since 2022- now I still used this on BITCOIN.
it works, some of my followers doubt this but its fine, we might see 170k per bitcoin by end of this year? This predictions base on the logarithmic , this indicator shows how the supply works with only 21M bitcoins, unlike other commodities. Bitcoin is the most followed commodities on this indicator I rarely used.
Youve come here so far to know bitcoin, here is my chart for this year. It will keep Bitcoin hard to buy until it reached a million per coin, then the public regret it.
Keep the word DCA. Goodluck.
Holding it is the key.

GOLD short term Analysis. - 15 mins. Gold (XAU/USD) – Harmonic Pattern Analysis (15m Chart)
As of: August 5, 2025
🔶 Pattern Observed: Bearish Harmonic (likely Gartley or Butterfly)
Pattern Completion: Near 3385–3390 zone
The price has tested the PRZ (Potential Reversal Zone) and started showing early signs of weakness.
A clear "Short only below here" marker is drawn just below 3370, signaling key support.
🔻 Short Trade Thesis:
If price breaks and sustains below 3370, bearish confirmation is triggered.
This confirms the harmonic pattern's validity and opens the path for impulsive downside targets.
🎯 Downside Targets (if 3370 breaks):
First target: 3310–3320
Second target: 3265–3270
Final target (extended move): 3180–3200
⚠️ Invalidation:
If price breaks above 3395–3400, the harmonic setup is invalidated.
In such case, avoid any short setups and re-analyze price action for new trend direction.
Conclusion:
This harmonic pattern suggests a high-probability short setup below 3370, with clean targets mapped out. However, it's critically important to wait for confirmation (break and retest or strong momentum candle) before entry. If the price starts moving up from current levels without breaching 3370, this setup becomes invalid.
⚠️ Disclaimer:
This analysis is for educational and informational purposes only and should not be considered as financial advice. Trading commodities and financial instruments involves significant risk and may not be suitable for all investors. Please perform your own due diligence or consult with a licensed financial advisor before making any trading decisions. The author is not liable for any losses incurred based on this analysis.

BUY NZDJPYA double bottom pattern has emerged on NZDJPY 1 hour chart. We will see price escalate in the next coming hours.

XAUUSD - TAKE A LOOKHere are some guidelines of what could happen. This is purely technical analysis, which may be affected by any news, but it is currently aligning with the ongoing movement.

BTC PERPETUAL TRADE ,Short from $113,700
BTC PERPETUAL TRADE
SELL SETUP
Short from $113,700
Currently $113,700
Stoploss $116,800
Targeting $111,600 or Down
(Trading plan BTC go up to $115K
will add more shorts)
Follow the notes for updates
In the event of an early exit,
this analysis will be updated.
Its not a Financial advice

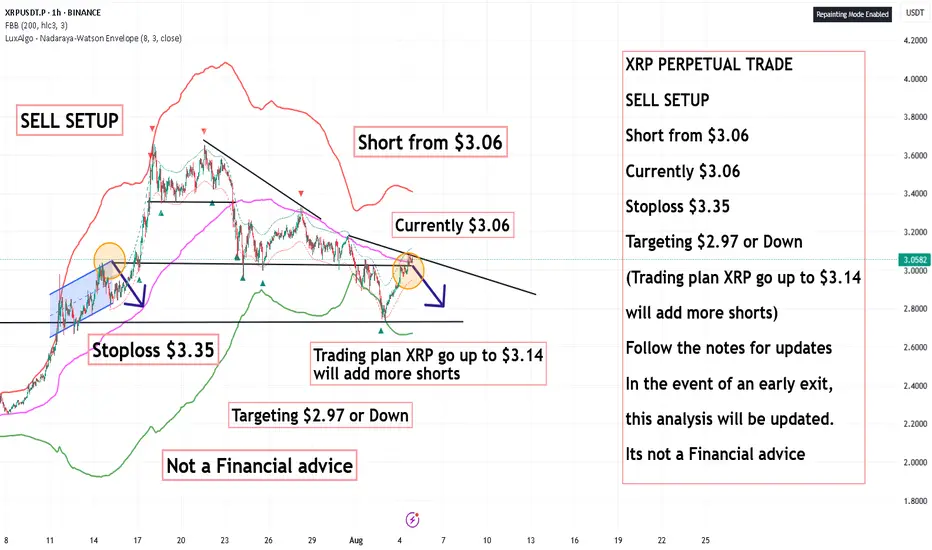
XRP PERPETUAL SELL SETUP ,Short from $3.06XRP PERPETUAL TRADE
SELL SETUP
Short from $3.06
Currently $3.06
Stoploss $3.35
Targeting $2.97 or Down
(Trading plan XRP go up to $3.14
will add more shorts)
Follow the notes for updates
In the event of an early exit,
this analysis will be updated.
Its not a Financial advice
Elon to send DOGE."Elon Musk awarded $30 billion in bid to keep him at Tesla for years." - August 5, 2025.
Make no mistake about it, Elon wants DOGE to hit every headline.
Expect to see DOGEUSD at >$5 or higher. At these valuations, DOGE would be >10% of the total marketcap. 1 trillion marketcap for DOGE is possible in this cycle - yes you heard that right.
DOGEUSD at $6.9. Why not? Just full send.
We remain bullish on gold prices today—3400+.We remain bullish on gold prices today—3400+.
As shown in Figure 4h, gold prices are actively breaking through.
Currently, the upper resistance level for gold is 3385-3390.
Going long at low prices is a good strategy.
We exited yesterday at 3380 and entered today around 3350-3360, achieving very stable profits.
Current support level for gold: 3350-3360.
Gold prices have now resumed their upward trend, indicating that bullish sentiment has returned to the primary upward trend.
Bullish sentiment will continue to strengthen.
Our target price for gold remains above 3400.
Day Trading Strategy:
1: Swing Strategy: 3350-3385 (Buy Low, Sell High)
2: Low-Price Long Strategy
Buy: 3350-3360-3370
Stop Loss: 3345
Target: 3380-3400
3: High-Price Short Strategy: (Caution is advised when trading short positions; avoid short positions)

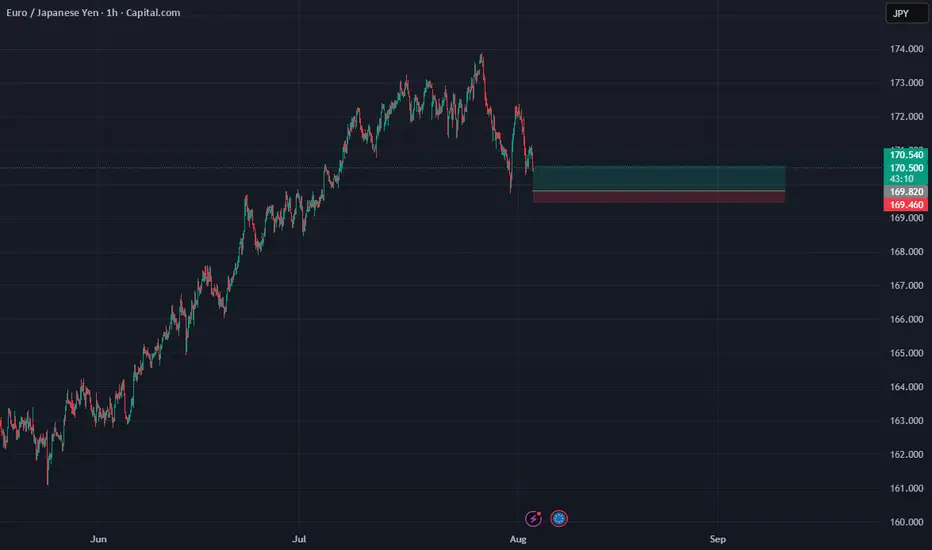
ENTRY EURJPYDisclaimer:
This is merely a chart-based analytical trading idea and is not considered investment advice. Please manage your risks carefully and conduct your own research before making any trading decisions.
Litecoin (LTC): Aiming For $145 Area Before Potential CorrectionLitecoin looks good for potential upside movement here, although trades are not the best to take but we definitely see a good shorting opportunity appening soon.
More in-depth info is in the video—enjoy!
Swallow Academy


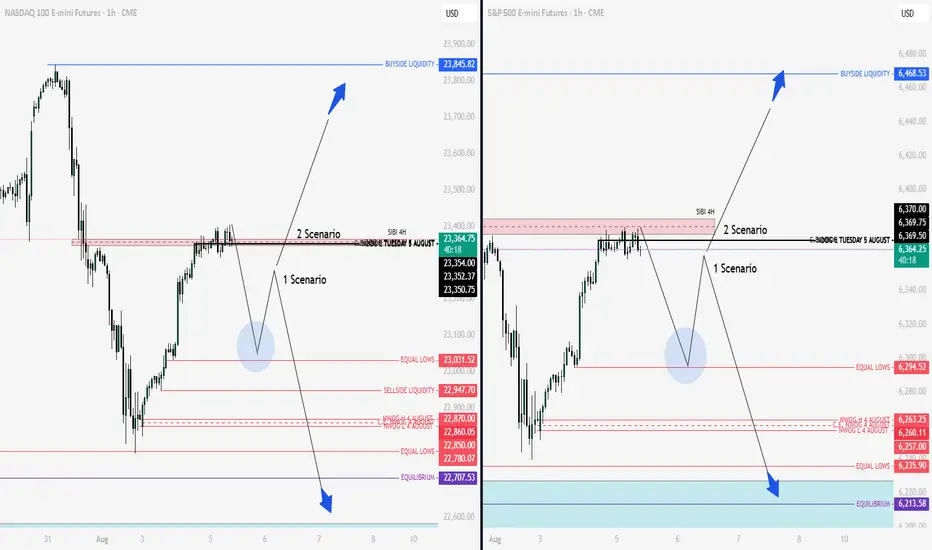
Nq & Es Key Levels and Scenarios 05-08-2025 We are currently positioned in a premium zone. This suggests that the price is likely to seek lower levels within discount areas. Therefore, upon the market opening, it will be crucial to observe price action in light of the increased volatility expected to enter the market.
The prevailing bias is that prices are likely to decline toward the predefined zones indicated on the chart. Depending on how price reacts at these key levels, we will be able to assess whether the downward movement will continue or if significant support will emerge, potentially leading to a full reversal to the upside.
In summary, there may be initial shorting opportunities, followed by potential long setups depending on the market’s reaction. Two scenarios have been outlined.
Wishing you all successful and well-considered trades.
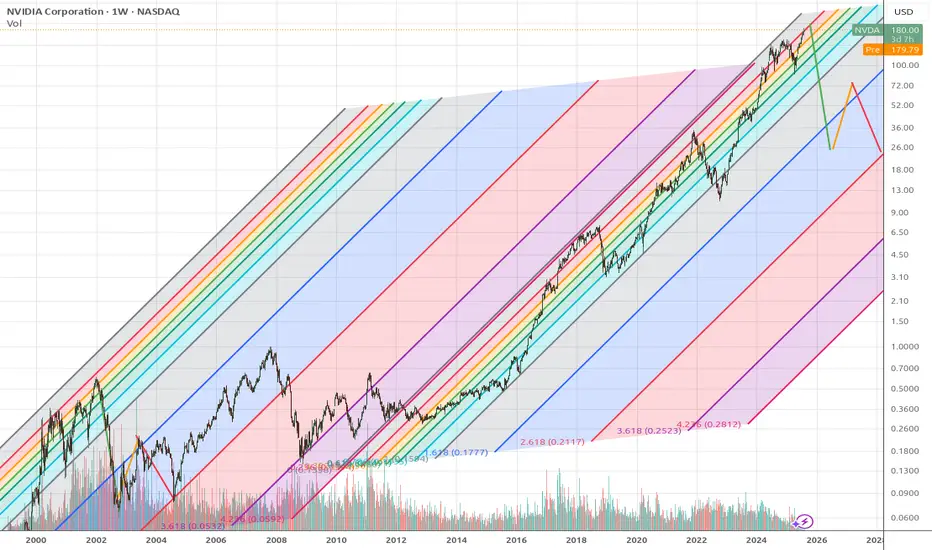
Nothing left of nvidia when quantum compute takes over graphicsNothing left of nvidia when quantum compute takes over graphics. The price would go from 200 to 20 in no time (several years)
BABA Daily Trade SetupsIn this update we review the recent price action in Alibaba and identify the next high-probability trading opportunity and price objectives to target. To review today's video analysis clcik here!

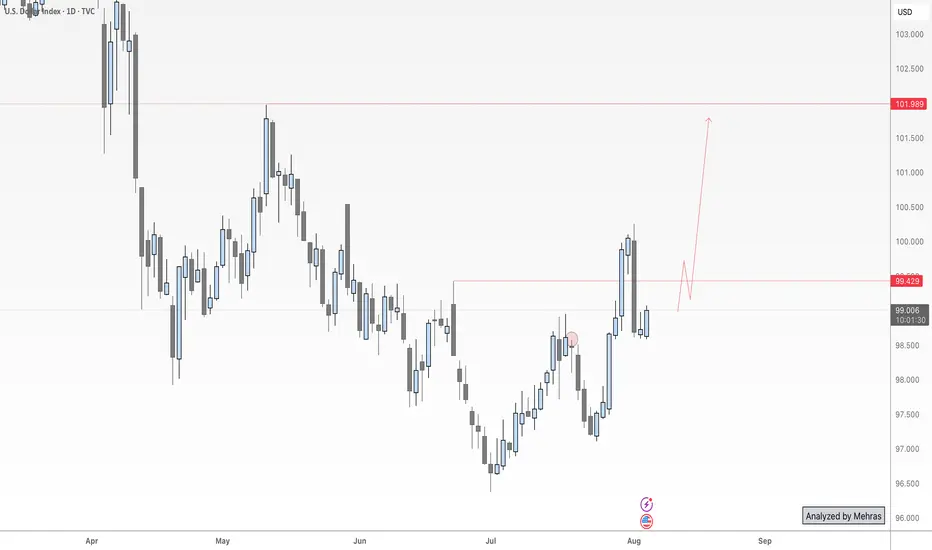
Dollar Index Update – Holding Gains After NFP Data📈 DXY Outlook – Ready for the Next Leg Up?
Last Friday, as NFP data hit the market, I published an analysis highlighting this exact move—and so far, price has respected the roadmap perfectly.
Now, with momentum building and structure aligning, the Dollar Index looks poised to continue its bullish run—first toward the 101 zone and potentially higher toward 102.
But here’s the key point for swing traders and risk-conscious setups:
🔍 If we’re aiming for higher targets with minimal drawdown, tonight’s daily candle close will be crucial.
A bullish close above yesterday’s high would not only confirm strength, but significantly reduce entry risk for long positions.
So, whether you’re already in the trade or waiting for confirmation, patience tonight could pay off.
Let’s see if the bulls can seal the deal with a strong daily close.
🔁 This analysis will be updated whenever necessary.
Disclaimer: This is not financial advice. Just my personal opinion.
EUR/NZD - Triangle Breakdown In PlayThe EUR/NZD pair has formed a classic Triangle Pattern on the 1H timeframe, indicating a period of consolidation before a potential breakout.
🔎 Key Technical Insights:
Price is compressing within the triangle, showing lower highs and higher lows.
Bearish bias is anticipated as price approaches the apex, suggesting a potential breakout to the downside.
Break below the triangle support opens the door for a move toward the target zone near 1.9425.
Resistance remains firm at 1.9619, capping bullish attempts.
🎯 Target Point: 1.9425
This aligns with previous structure and projected move size from the triangle’s base.
📌 Watch For:
Clear bearish breakout candle below triangle
Volume confirmation or follow-through momentum
This setup offers a solid opportunity for traders watching for continuation patterns and breakout plays.

Sell level audnzdOur last buying idea already running 300 pips in buy
Now we are looking for a short term bearish correction
Market gonna overbought on daily time frame and let close this week candel
After confirming sell audnzd

BTC/USDT🩸 CRYPTOCAP:BTC ⁀➷
$Bitcoin. Macro chart Another
💯 Intermediate Target — 60 500 $
🚩 Macro Target 1 — 55 000 $
🚩 Macro Target 2 — 47 000 $
🚩 Macro Target 3 — 37 000 $
- Not financial advice, trade with caution.
#Crypto #Bitcoin #BTC #Investment
✅ Stay updated on market news and developments that may influence the price of Bitcoin. Positive or negative news can significantly impact the cryptocurrency's value.
✅ Exercise patience and discipline when executing your trading plan. Avoid making impulsive decisions driven by emotions, and adhere to your strategy even during periods of market volatility.
✅ Remember that trading always involves risk, and there are no guarantees of profit. Conduct thorough research, analyze market conditions, and be prepared for various scenarios. Trade only with funds you can afford to lose and avoid excessive risk-taking.

EURUSD BEARISHTechnically:
Printing LL and LH
Support became resistance
No bullish divergence
Fundamentally:
According to the COT data Big player shorting the EU Which means longing USD
