XRP 1D – Major Support Bounce Inside Channel, Will Range Hold?XRP just defended a critical long-term support zone near $2.70 — aligning perfectly with the mid-channel range and previous breakout level. After rejecting from multi-month resistance around $3.15, price has returned to structure for a potential higher low.
🔹 Structure & Range
The macro channel (white lines) has guided price action for over 9 months.
XRP recently tagged the upper boundary, rejected, and pulled back into support around $2.70.
This zone was tested multiple times historically — it now serves as a pivot for continuation vs. reversal.
🔹 Momentum Signal
The Stoch RSI is printing a bullish cross from oversold — a classic confluence for reversal setups.
If the support zone holds, we could see price attempt another run at the $3.15–$3.30 resistance and eventually challenge the upper trendline.
🔹 Macro Outlook
Holding this structure = bullish midterm continuation.
Losing it opens the door for a drop back toward $2.00–$2.25, where the lower channel support sits.
Will XRP defend this channel — or is a breakdown back to $2.00 inevitable?
Drop your analysis in the comments 👇
Harmonic Patterns

Palantir - The unstoppable company!💣Palantir ( NASDAQ:PLTR ) is just too strong:
🔎Analysis summary:
Since mid 2022, Palantir managed to rally more than 2.500%, creating new all time highs every single month. Eventually this rally will slow down, but before this happens, Palantir could rally another +100%. This is a classic example of stock market behaviour and you should take advantage.
📝Levels to watch:
$200
SwingTraderPhil
SwingTrading.Simplified. | Investing.Simplified. | #LONGTERMVISION

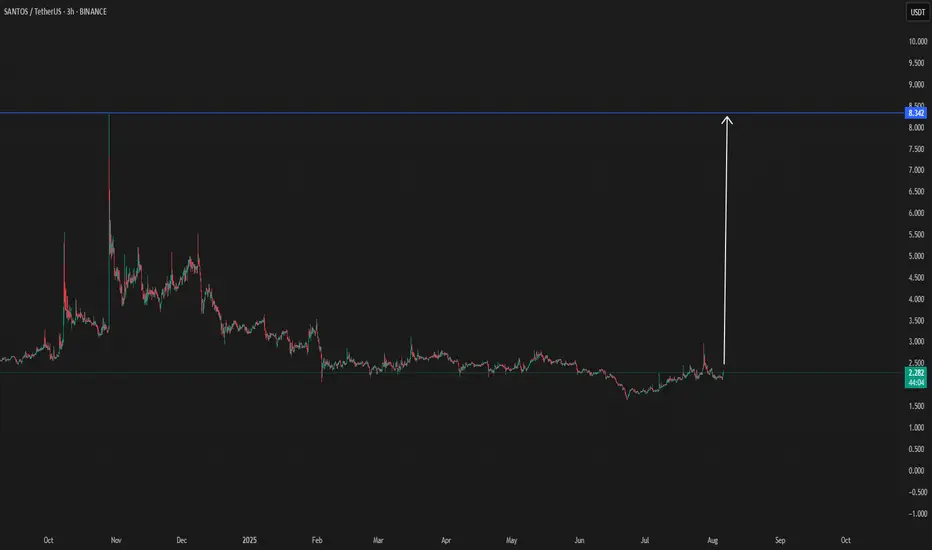
SANTOS/USDT $8 Possible targetSantos shows an interesting view since today, which can confirm a break
When there is confirmation will add here below
Like it did before, it can do it again.
Warren Glass Building Collapsed. as expected, Warren's diamond glass building collapsed, and the ultimate target for the butterfly of sellers is probably $412.

ETH 1H – Trendline + Demand Zone Converge, Will Bulls Step In?Ethereum is approaching a high-confluence zone on the 1H chart — where rising trendline support intersects with a prior demand zone that triggered the last major rally.
This area around $3,500–$3,430 represents a key test of short-term momentum and trend structure.
🔹 Technical Confluence
Strong ascending trendline from mid-July has held through 3 clean touches — and is now under pressure again.
The blue demand zone was the launchpad for ETH’s move toward $3,800, showing clear price memory.
Price is now approaching both zones while momentum is fully reset on the Stoch RSI.
🔹 Momentum & Setup
The Stoch RSI is hovering in oversold territory — just as ETH returns to structure.
A higher low in this zone would confirm buyer interest and setup a potential breakout toward $3,900+.
🔹 Scenario to Watch
A clean bounce + reclaim of local structure would confirm a bullish continuation setup.
Failure to hold this level could trigger a trendline break and deeper retracement — invalidating short-term bullish structure.
Will ETH defend this zone and continue the trend — or is a breakdown brewing?
Let me know your thoughts in the comments 👇

Updated chart: 1050 days of bull, 380 days of bearEach cycle fits quite neatly into ca. 1050 days of bull market and 375 days of bear. Sell in Sep/Oct 2025. Buy in Nov 2026.
An argument can be made that 2021 was a botched bull run. By the time we got to the second peak, Bitcoin was already running out of steam. One single peak would have topped around 100k. I blame SBF/Alameda.
People who are trying to extrapolate/do curve fitting through that 2021 peak will underestimate 2025.
2021 should be ignored as an exception.

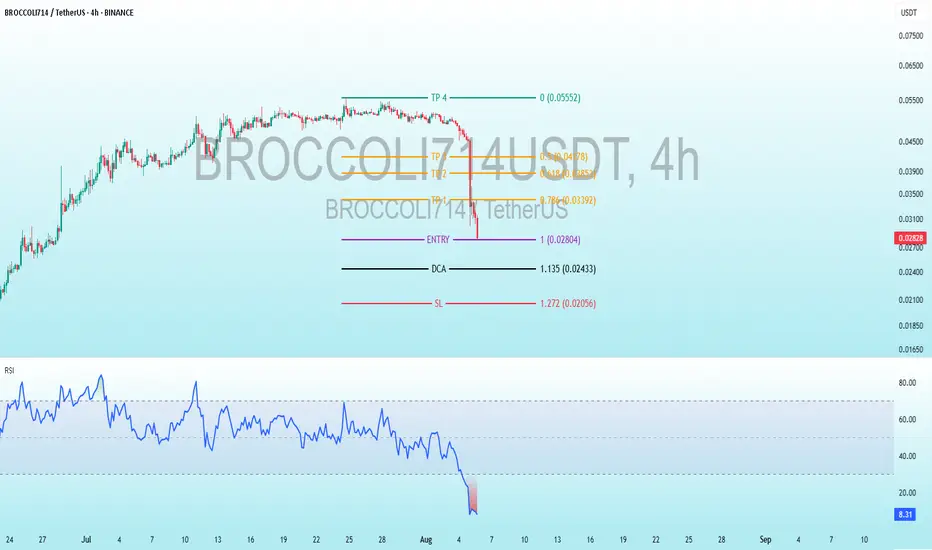
BROCCOLI714 Bullish DivergenceBINANCE:BROCCOLI714USDT
Trade Setup:
Target 1: 0.03392 (0.786 Fibonnaci Golden Zone).
Target 2: 0.03853 (0.618 Fibonnaci Golden Zone).
Target 3: 0.04178 (0.5 Fibonnaci Golden Zone).
Target 4: 0.05552 (0 Fibonnaci).
DCA : 0.02433 (1.135 Fibonacci)
Stop Loss: 0.0.02056 (1.272 Fibonnaci).
RSI Analysis: The RSI is showing a bullish divergence, suggesting potential bullish momentum. The current RSI is around 8.36, approaching oversold territory, so caution is advised.
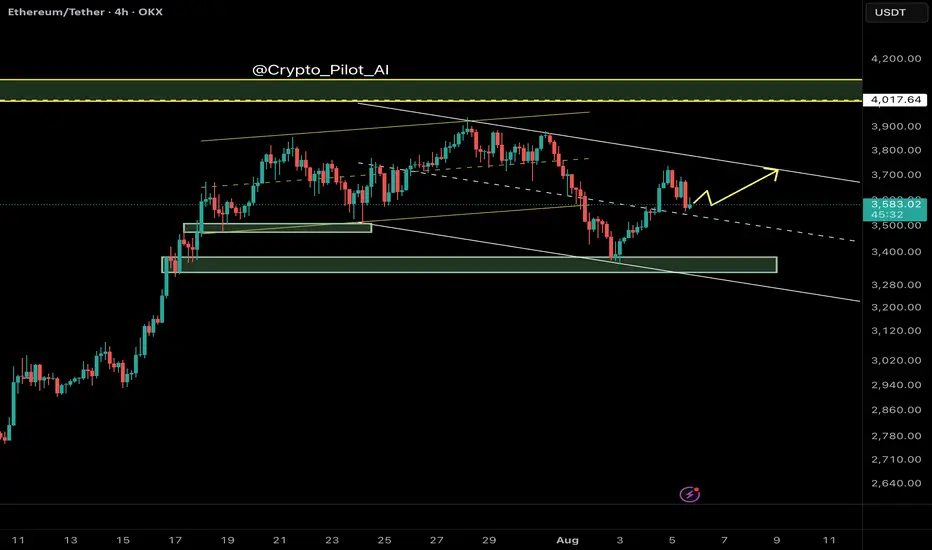
Ethereum (ETH/USDT) – Midline Break Retest and Channel Top in Si🔍 Technical Overview
Ethereum has recently broken above the midline of its descending channel, indicating a potential bullish shift within the short-term corrective structure. The price action suggests that we are currently witnessing a retest of the broken midline, which is now acting as dynamic support.
This behavior is consistent with smart money principles — where a previously broken internal structure gets tested before continuation.
⸻
🧠 NEoWave Context
Structurally, ETH appears to be developing a Contracting Corrective pattern, with the current leg likely evolving as Wave D. This wave typically exhibits strength and complexity, often stretching toward the channel top while still respecting broader consolidation boundaries.
⸻
💡 Smart Money Insights
• ✅ BOS already confirmed on LTF (1H, 4H) with higher lows
• 🔄 Price has reclaimed the internal broken structure (midline) and is retesting it
• 🔋 Bullish OB around $3,480–$3,510 acted as a launch zone for current leg
• 📍 Next resistance is the channel top near $3,740
⸻
📊 Trade Scenarios
🟩 Bullish Scenario (Preferred):
If the retest of the midline holds, ETH is likely to continue its move toward the upper boundary of the descending channel (~$3,730–$3,750). This aligns with Wave D expectations in complex corrections.
🟥 Bearish Invalidations:
A breakdown back below $3,520 and loss of the internal bullish structure would negate this short-term bullish scenario and reopen downside potential toward $3,350.
⸻
⚠️ Trader Tip:
Retests of internal structures like midlines or internal trendlines often provide low-risk continuation setups — if confirmed by bullish internal BOS.
⸻
✅ Conclusion
Ethereum remains technically corrective but with bullish momentum building within the channel. As long as the midline holds, we expect continuation toward the channel top, completing Wave D structure before potential reversal.
💬 Drop your alt counts or thoughts in the comments.
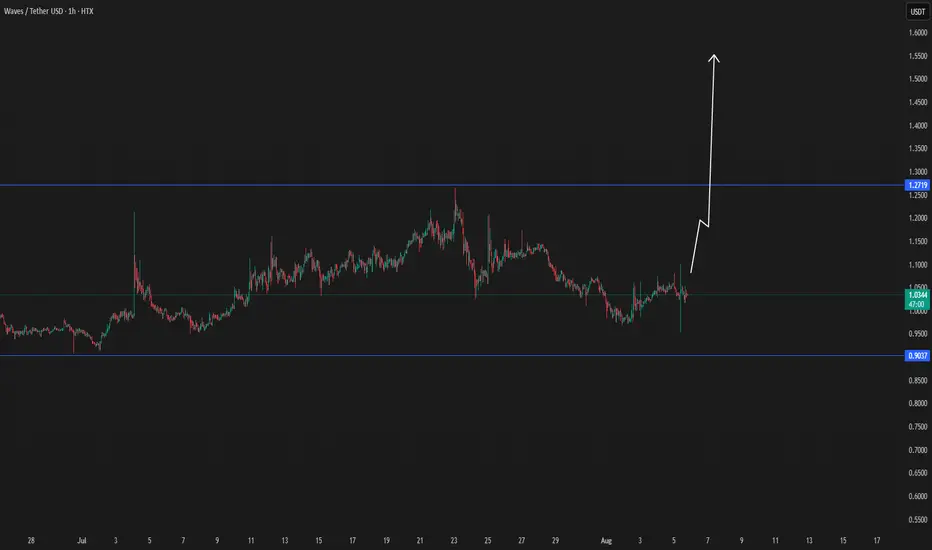
WAVES/USDT BREAK 3.0There is good chance for wave break and focus goes there to check it in the coming time frames.
GAIA Crypto BullrunGAIA AI recently launched their mainnet and was added to 10 major centralized exchanges. Since then it has been dumping and has found a bottom. GAIA currently has a 7 million dollar marketcap and will likely be over 100 million at some point in the not too distant future. If it makes it into the top 200 coins, that will be a 30x gain from here. Get in under .75!!!

ETH/USDT Bearish Setup – Rising Wedge Breakdown & RetestEthereum (ETH/USDT) has broken down from a rising wedge — a classic bearish pattern — and is now showing signs of rejection after a clean retest of the broken trendline around $3,679.
Structure:
Rising wedge pattern on the higher timeframe
Breakdown confirmed with retest of lower trendline as resistance
No bullish follow-through after retest
Trade Plan:
Bias: Bearish below $3,680
Entry Zone: Anywhere below $3,670–3,680 if rejection is confirmed
Stop Loss: Above $3,720 (invalidation)
Targets:
Target 1: $3,298
Target 2: $2,880
Target 3: $2,640
Key Notes:
If ETH reclaims and holds above $3,680, the setup gets invalidated
Watch BTC behavior — ETH tends to follow
Volume shows no strength from bulls post-breakdown
This setup presents a high-risk, high-reward opportunity if the price continues to decline from this zone.
Conclusion:
Stay cautious, as the market could see more downside if ETH stays below $3,680. Manage risk accordingly.
DYOR | Not Financial Advice

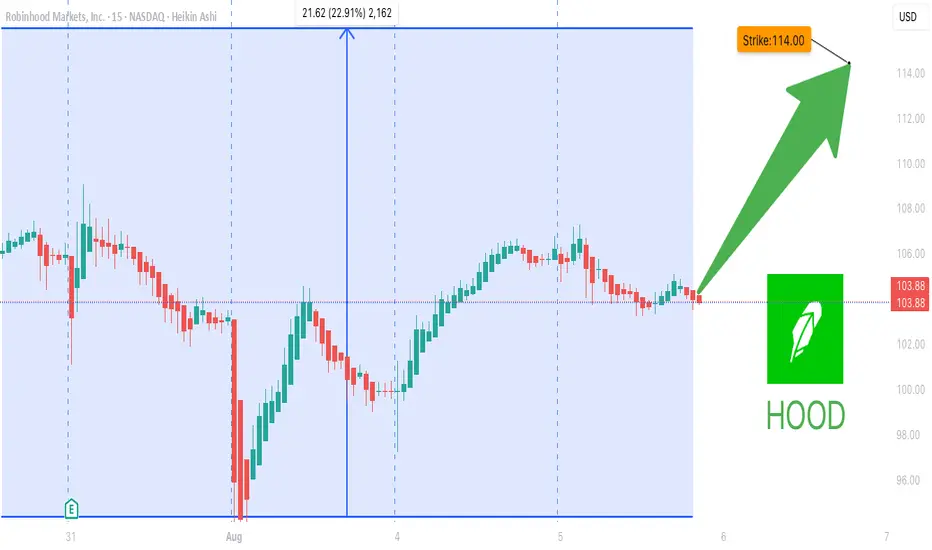
HOOD Lifetime Setup--Will You Miss It Again?### 🟢 **HOOD Options Flow Explodes: 2.05 Call/Put Ratio Sparks Bullish Firestorm 🔥**
**Will \$114 Be Breached This Week? Smart Money Thinks So.**
📈 **HOOD Weekly Options Breakdown – Aug 5, 2025**
---
#### 🔍 Market Snapshot:
* **Total Calls**: 178,756
* **Total Puts**: 87,243
* **C/P Ratio**: 2.05 → **BULLISH**
* **RSI**: Daily – 60.2, Weekly – 77.3 → **Uptrend Confirmed**
* **Volume**: 1.5x Previous Week → **Institutional Flow Detected**
* **Gamma Risk**: 🟡 Moderate
* **VIX**: 17.5 → Ideal for Weekly Plays
* **Time Decay**: 🔥 Accelerating
---
### 🧠 Consensus:
✅ All models confirm **strong bullish momentum**
⚠️ Some debate: Is rising volume accumulation or distribution?
---
### 🎯 Recommended Trade Setup:
> **Naked Call – HOOD \$114C (Exp: 2025-08-08)**
* **Entry**: \$0.79
* **Stop Loss**: \$0.40
* **Profit Target**:
* 🥇 Base: \$1.03 (+30%)
* 🥈 Stretch: \$1.58 (+100%)
* **Confidence Level**: 80%
* **Timing**: Enter @ market open
---
### 🔖 Tags (Hashtags for TradingView & Socials):
`#HOOD #OptionsFlow #CallOptions #BullishSentiment #WeeklyOptions #TradingStrategy #VolumeBreakout #RSI #Gamma #Robinhood #SmartMoneyMoves #HOODTradeIdea #TechnicalAnalysis #StockOptions #ViralTradeSetup`
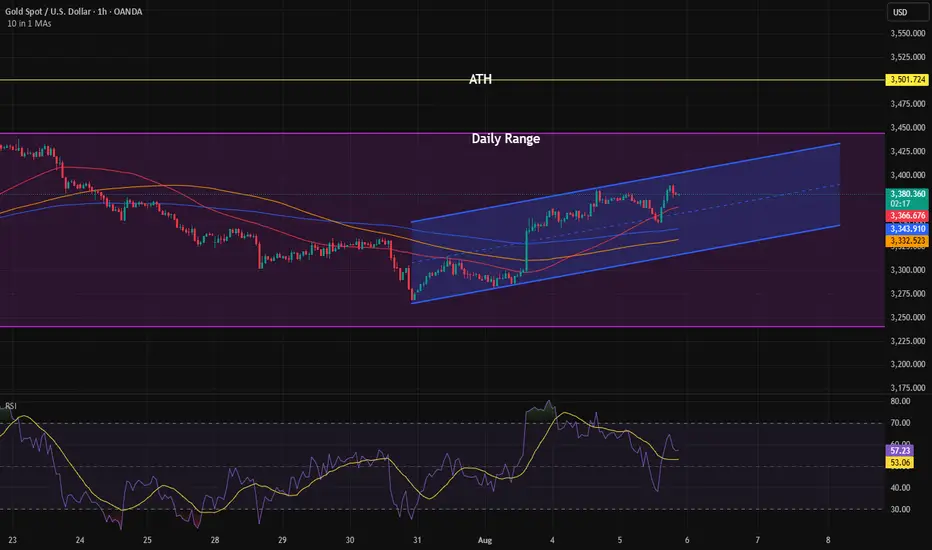
Waiting for a Channel BreakoutGold has been stuck in a long-term range for quite some time.
It was about to break its all-time high, but last week's news affected it slightly and slowed down its momentum.
Still, there are signs showing a willingness to break out of this range and head toward a new all-time high.
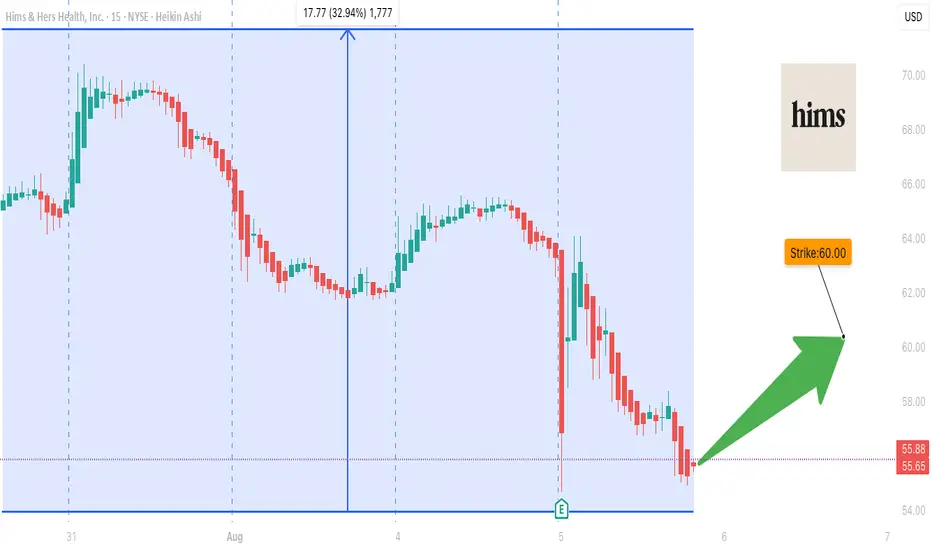
Grok Bets Big on HIMS $60 Calls
**HIMS \$60C in Play! Mixed Models, But Grok Goes Bullish 💥 \ **
---
### 🧠 TradingView-Ready Caption:
**HIMS Weekly Trade Alert 🚨 | Aug 8 Expiry**
> While most models stay cautious, **Grok/xAI pulls the trigger** on a bullish call. Weekly RSI rising, volume weak but stable. Entry at market open, eyeing that \$60 breakout.
📈 **Trade Setup:**
* **Instrument:** \ NYSE:HIMS
* **Direction:** CALL (Bullish)
* **Strike:** \$60.00
* **Expiry:** Aug 8, 2025
* **Entry Price:** \$7.00
* **Target:** \$8.00
* **Stop Loss:** \$3.50
* **Confidence:** 65%
🧊 Risk: Gamma decay with 3 DTE, mixed signals across models.
🔥 Reward: Only Grok model signals upside — the contrarian bet.
---
### 🏷️ Suggested Tags:
`#HIMS #OptionsTrading #CallOption #HIMS60C #TradingSetup #StockMarket #TechnicalAnalysis #GrokAI #WeeklyTrade #BullishPlay #TradingView #RSI #GammaRisk #EventRisk #SPY #AIModels`
Could the price bounce from here?EUR/CAD has bounced off the pivot which is a pullback support, and could rise to the 1st resistanc,e which is a multi-swing high.
Pivot: 1.58922
1st Support: 1.57671
1st Resistance: 1.61066
Risk Warning:
Trading Forex and CFDs carries a high level of risk to your capital and you should only trade with money you can afford to lose. Trading Forex and CFDs may not be suitable for all investors, so please ensure that you fully understand the risks involved and seek independent advice if necessary.
Disclaimer:
The above opinions given constitute general market commentary, and do not constitute the opinion or advice of IC Markets or any form of personal or investment advice.
Any opinions, news, research, analyses, prices, other information, or links to third-party sites contained on this website are provided on an "as-is" basis, are intended only to be informative, is not an advice nor a recommendation, nor research, or a record of our trading prices, or an offer of, or solicitation for a transaction in any financial instrument and thus should not be treated as such. The information provided does not involve any specific investment objectives, financial situation and needs of any specific person who may receive it. Please be aware, that past performance is not a reliable indicator of future performance and/or results. Past Performance or Forward-looking scenarios based upon the reasonable beliefs of the third-party provider are not a guarantee of future performance. Actual results may differ materially from those anticipated in forward-looking or past performance statements. IC Markets makes no representation or warranty and assumes no liability as to the accuracy or completeness of the information provided, nor any loss arising from any investment based on a recommendation, forecast or any information supplied by any third-party.

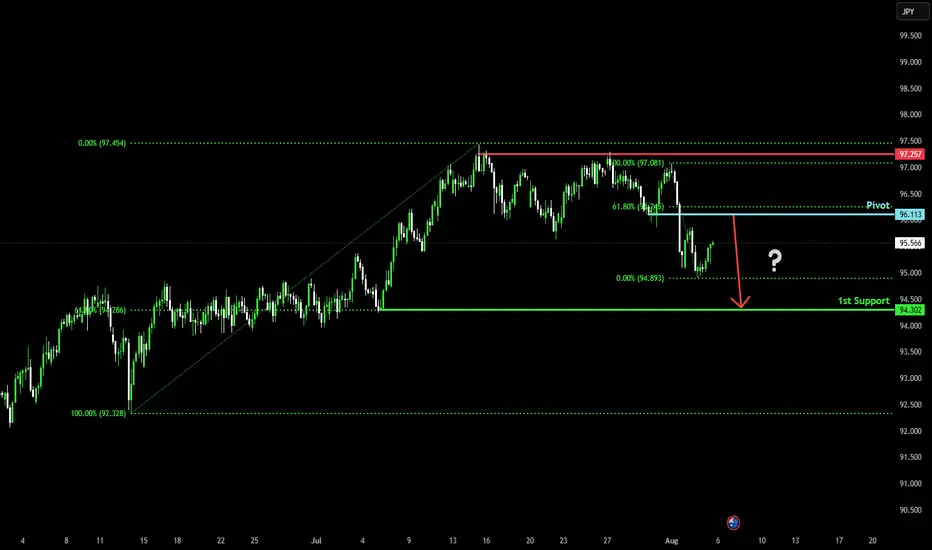
Bearish reversal off 61.8% Fibonacci resistance?AUD/JPY is rising towards the pivot which acts as a pullback resistance and could reverse to the 1st support, which aligns with the 61.8% Fibonacci retracement.
Pivot: 96.11
1st Support: 94.30
1st Resistance: 97.25
Risk Warning:
Trading Forex and CFDs carries a high level of risk to your capital and you should only trade with money you can afford to lose. Trading Forex and CFDs may not be suitable for all investors, so please ensure that you fully understand the risks involved and seek independent advice if necessary.
Disclaimer:
The above opinions given constitute general market commentary, and do not constitute the opinion or advice of IC Markets or any form of personal or investment advice.
Any opinions, news, research, analyses, prices, other information, or links to third-party sites contained on this website are provided on an "as-is" basis, are intended only to be informative, is not an advice nor a recommendation, nor research, or a record of our trading prices, or an offer of, or solicitation for a transaction in any financial instrument and thus should not be treated as such. The information provided does not involve any specific investment objectives, financial situation and needs of any specific person who may receive it. Please be aware, that past performance is not a reliable indicator of future performance and/or results. Past Performance or Forward-looking scenarios based upon the reasonable beliefs of the third-party provider are not a guarantee of future performance. Actual results may differ materially from those anticipated in forward-looking or past performance statements. IC Markets makes no representation or warranty and assumes no liability as to the accuracy or completeness of the information provided, nor any loss arising from any investment based on a recommendation, forecast or any information supplied by any third-party.
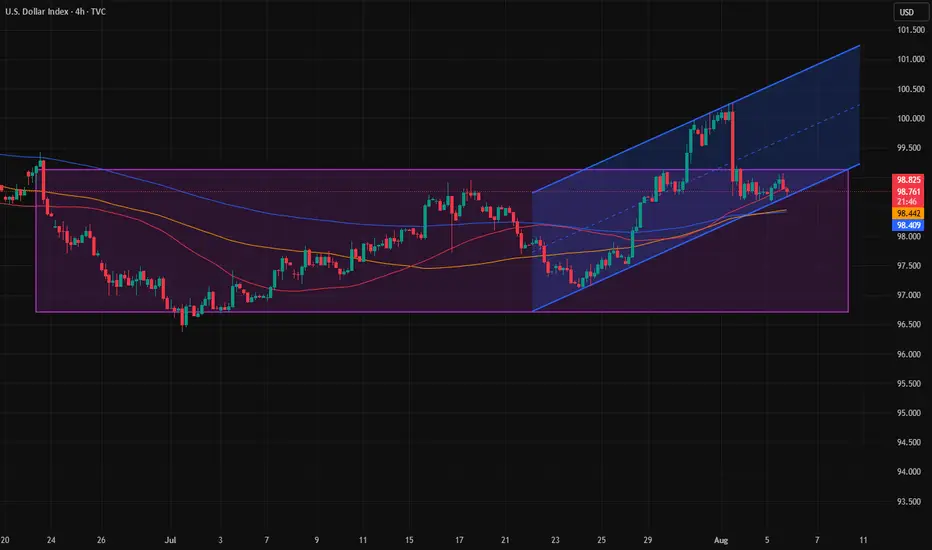
Breakout from the channel again?After a long period of ranging, the DXY finally managed to break the range's ceiling last week and even gave us a channel confirmation afterward. But if you remember, there were several major news events last week, with the last one on Friday causing the price to fall back into the range. Now we can see that an ascending channel has formed inside the range, and the price is currently at the bottom of that channel. If it manages to break out of the channel again, there’s a chance that this time the trend might truly reverse.
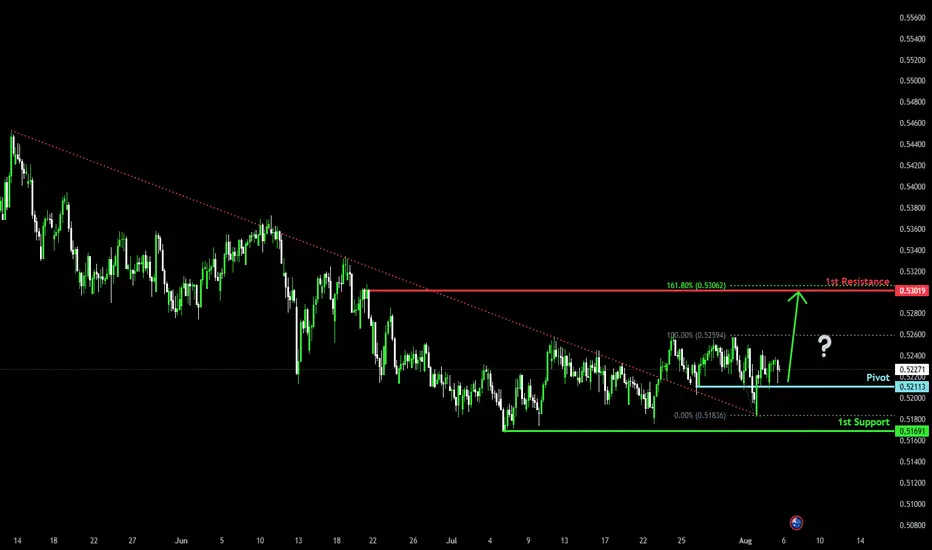
Bullish reversal?AUD/CHF is falling towards the pivot and could bounce to he 1st resistance which is a pullback resistance that lines up with the 161.8% Fibonacci extension.
Pivot: 0.52113
1st Support: 0.51691
1st Resistance: 0.53019
Risk Warning:
Trading Forex and CFDs carries a high level of risk to your capital and you should only trade with money you can afford to lose. Trading Forex and CFDs may not be suitable for all investors, so please ensure that you fully understand the risks involved and seek independent advice if necessary.
Disclaimer:
The above opinions given constitute general market commentary, and do not constitute the opinion or advice of IC Markets or any form of personal or investment advice.
Any opinions, news, research, analyses, prices, other information, or links to third-party sites contained on this website are provided on an "as-is" basis, are intended only to be informative, is not an advice nor a recommendation, nor research, or a record of our trading prices, or an offer of, or solicitation for a transaction in any financial instrument and thus should not be treated as such. The information provided does not involve any specific investment objectives, financial situation and needs of any specific person who may receive it. Please be aware, that past performance is not a reliable indicator of future performance and/or results. Past Performance or Forward-looking scenarios based upon the reasonable beliefs of the third-party provider are not a guarantee of future performance. Actual results may differ materially from those anticipated in forward-looking or past performance statements. IC Markets makes no representation or warranty and assumes no liability as to the accuracy or completeness of the information provided, nor any loss arising from any investment based on a recommendation, forecast or any information supplied by any third-party.
Sell USDJPYWe will try to sell USDJPY again. After waiting the whole day for bearish movement, I believe price will finally fall during NY session.

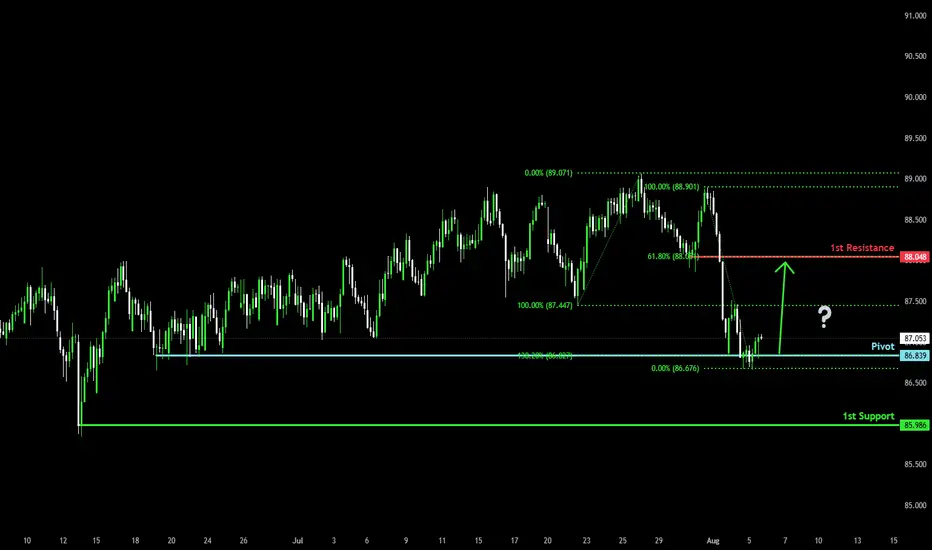
Bullish reversal?NZD/JPY is reacting off the pivot and could bounce to the 1st resistance which acts as a pullback resistance.
Pivot: 86.83
1st Support: 85.98
1st Resistance: 88.04
Risk Warning:
Trading Forex and CFDs carries a high level of risk to your capital and you should only trade with money you can afford to lose. Trading Forex and CFDs may not be suitable for all investors, so please ensure that you fully understand the risks involved and seek independent advice if necessary.
Disclaimer:
The above opinions given constitute general market commentary, and do not constitute the opinion or advice of IC Markets or any form of personal or investment advice.
Any opinions, news, research, analyses, prices, other information, or links to third-party sites contained on this website are provided on an "as-is" basis, are intended only to be informative, is not an advice nor a recommendation, nor research, or a record of our trading prices, or an offer of, or solicitation for a transaction in any financial instrument and thus should not be treated as such. The information provided does not involve any specific investment objectives, financial situation and needs of any specific person who may receive it. Please be aware, that past performance is not a reliable indicator of future performance and/or results. Past Performance or Forward-looking scenarios based upon the reasonable beliefs of the third-party provider are not a guarantee of future performance. Actual results may differ materially from those anticipated in forward-looking or past performance statements. IC Markets makes no representation or warranty and assumes no liability as to the accuracy or completeness of the information provided, nor any loss arising from any investment based on a recommendation, forecast or any information supplied by any third-party.
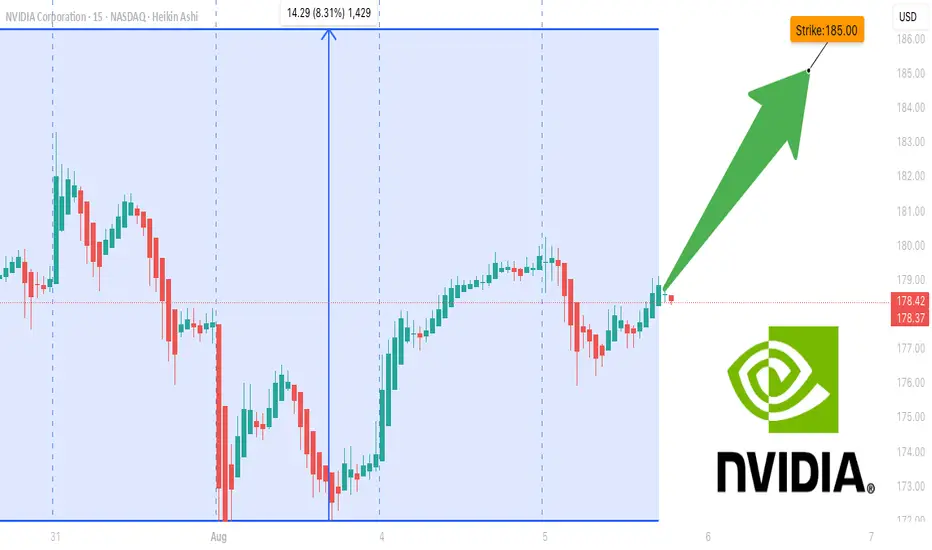
NVDA Don't Miss Out !!!!
**NVDA \$185C Weekly Momentum Surge ⚡ All Models Aligned – 75% Confidence Setup 🔥**
---
### 📊 **Post Body (Optimized for TradingView):**
**NVDA Weekly Call Play — Aug 8 Expiry (3 DTE) 🔥**
📈 **Momentum Snapshot:**
* **Weekly RSI:** 🔼 Above 50 and climbing
* **Daily RSI:** 🔻 Falling — short-term caution
* **Volume:** 1.2x previous week (🟢 Institutional flow)
* **Volatility (VIX):** <22 — favorable setup
* **Gamma Risk:** 🟠 Moderate
---
🧠 **Model Scorecard Summary:**
* **Grok / xAI:** 4/5 Bullish 🟢
* **Gemini (Google):** 3/5 Bullish with 80% confidence 🟢
* **Claude (Anthropic):** 5/5 Bullish 💯
* **LLaMA (Meta):** 4/5 Bullish 💪
* **DeepSeek:** 5/5 Bullish 🚀
✅ **Consensus:** Strong Bullish 🔥
---
### 💡 **Trade Setup:**
* 🎯 **Strategy:** Long CALL
* 🟢 **Strike:** \$185
* 📅 **Expiry:** Aug 8, 2025
* 💵 **Entry Price:** \$0.96
* 📈 **Target Exit:** \$1.90 (100% gain)
* 🛑 **Stop Loss:** \$0.48 (50% risk cap)
* 📏 **Size:** 1 contract
* ⏰ **Timing:** Market Open
* 📊 **Confidence Level:** 75%
---
⚠️ **Key Risks to Watch:**
* Time decay – Only 3 DTE ⏳
* Daily RSI divergence 😬
* Gamma risk & market volatility (track \ TVC:VIX )
---
### 🧾 **Auto-Logger JSON (for tracking):**
```json
{
"instrument": "NVDA",
"direction": "call",
"strike": 185.00,
"expiry": "2025-08-08",
"confidence": 0.75,
"profit_target": 1.90,
"stop_loss": 0.48,
"size": 1,
"entry_price": 0.96,
"entry_timing": "open",
"signal_publish_time": "2025-08-05 09:43:22 UTC-04:00"
}
```
---
### 🏷️ **Suggested Hashtags (TradingView Style):**
`#NVDA #OptionsTrading #WeeklyOptions #CallOptions #MomentumStocks #AIStocks #TechLeaders #TradingSetup #RSISignal #GammaSqueeze #NVIDIA #OptionAlert #HighConviction #TradeIdeas #TechBreakout`
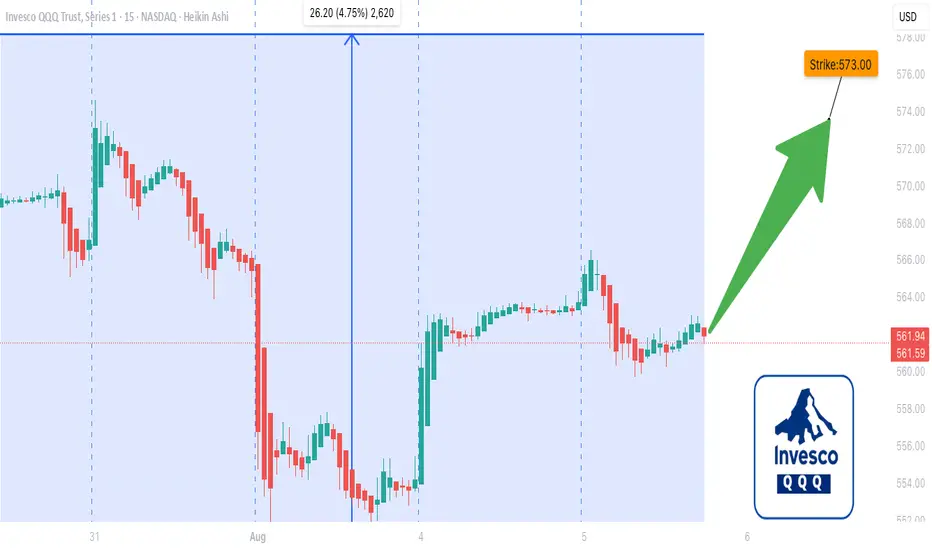
QQQ $573C Looking HOT **QQQ \$573C Looking HOT 🔥 Weekly RSI Surges – Models Align on Call Setup 🚀**
---
### 📊 **Post Body (Formatted for TradingView):**
**QQQ Weekly Options Play — Aug 8 Expiry (3DTE) 💥**
📈 **Momentum Snapshot:**
* **Weekly RSI:** 🔼 67.9 and rising
* **Daily RSI:** ⚖️ Mixed (short-term weakness)
* **Volume Trend:** Mixed — bullish accumulation OR institutional selling
* **Gamma Risk:** ⚠️ Moderate
* **Time Decay:** ⏳ Accelerating
---
🧠 **Model Consensus Summary:**
* **Grok / Claude / Llama:** 🔥 Bullish — Weekly RSI + volume support
* **Gemini (Google):** 🧊 No trade — Conflicted volume view
* **DeepSeek:** 😐 Bullish with caution — Volume red flag acknowledged
✅ **Consensus Direction:** **Moderate Bullish**
🛠️ **Trade Setup:** Long CALL
---
### 🧾 **Trade Specs:**
* 🟢 **Instrument:** QQQ
* 📈 **Strike:** \$573
* 📅 **Expiry:** Aug 8, 2025
* 💵 **Entry Price:** \$0.86
* 🎯 **Target:** \$1.30
* 🛑 **Stop:** \$0.43
* 📏 **Size:** 2 contracts
* 💪 **Confidence Level:** 70%
* ⏰ **Entry:** Market Open
* 🕒 **Posted:** 2025-08-05 08:03 EDT
---
🚨 **Risk Notes:**
* Institutional selling may cap upside 📉
* Mixed RSI suggests staying nimble ⚠️
* Only 3 DTE — exit FAST if it runs 💨
---
📦 **Trade JSON (Copy for Auto-Loggers):**
```json
{
"instrument": "QQQ",
"direction": "call",
"strike": 573.00,
"expiry": "2025-08-08",
"confidence": 0.70,
"profit_target": 1.30,
"stop_loss": 0.43,
"size": 2,
"entry_price": 0.86,
"entry_timing": "open",
"signal_publish_time": "2025-08-05 08:03:16 EDT"
}
```
---
### 🏷️ **Tags (TradingView Format):**
`#QQQ #OptionsAlert #WeeklyOptions #CallOptions #TechStocks #MomentumTrading #RSI #EarningsPlay #OptionsFlow #GammaSqueeze #TradingSignals #QQQTrade #Nasdaq100 #TradingStrategy #SPYQQQ`
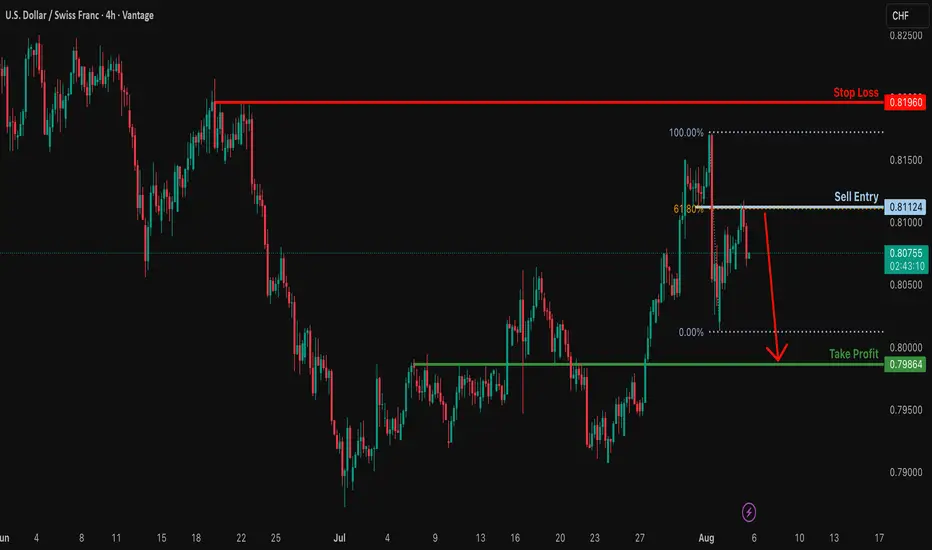
Potential bearish drop?USD/CHF has rejected off the resistance level which is a pullback resistance that lines up with the 61.8% Fibonacci retracement and could drop from this level to our take profit.
Entry: 0.8112
Why we like it:
There is a pullback resistance that lines up with the 61.8% Fibonacci retracement.
Stop loss: 0.8196
Why we like it:
There is a swing high resistance.
Take profit: 0.7986
Why we like it:
There is a pullback support.
Enjoying your TradingView experience? Review us!
Please be advised that the information presented on TradingView is provided to Vantage (‘Vantage Global Limited’, ‘we’) by a third-party provider (‘Everest Fortune Group’). Please be reminded that you are solely responsible for the trading decisions on your account. There is a very high degree of risk involved in trading. Any information and/or content is intended entirely for research, educational and informational purposes only and does not constitute investment or consultation advice or investment strategy. The information is not tailored to the investment needs of any specific person and therefore does not involve a consideration of any of the investment objectives, financial situation or needs of any viewer that may receive it. Kindly also note that past performance is not a reliable indicator of future results. Actual results may differ materially from those anticipated in forward-looking or past performance statements. We assume no liability as to the accuracy or completeness of any of the information and/or content provided herein and the Company cannot be held responsible for any omission, mistake nor for any loss or damage including without limitation to any loss of profit which may arise from reliance on any information supplied by Everest Fortune Group.