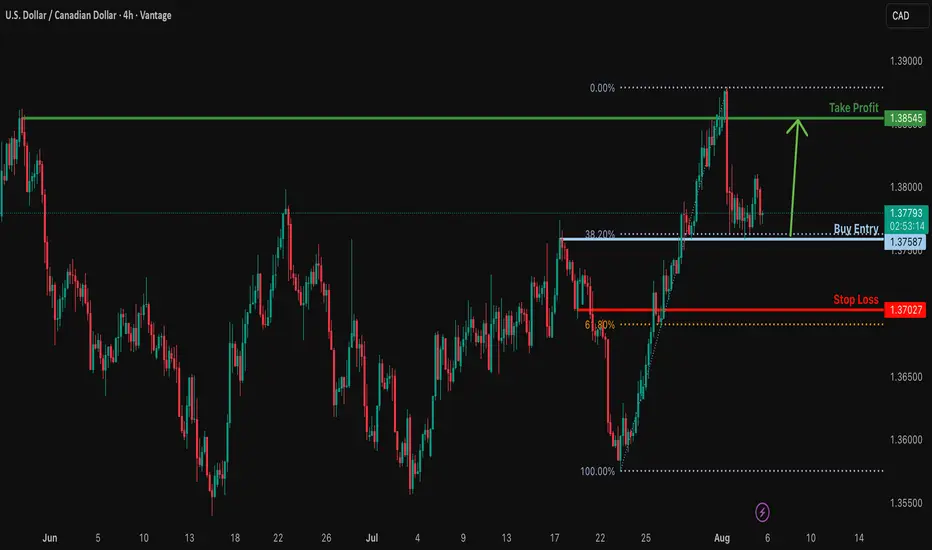
Bullish bounce off for the Loonie?The price is falling towards the support which is a pullback support that aligns with the 38.2% Fibonacci retracement and could bounce from this level to our take profit.
Entry: 1.3758
Why we like it:
There is a pullback support that lines up with the 38.2% Fibonacci retracement.
Stop loss: 1.3702
Why we like it:
There is a pullback support that is slightly above the 61.8% Fibonacci retracement.
Take profit: 1.3854
Why we like it:
There is a pullback resistance.
Enjoying your TradingView experience? Review us!
Please be advised that the information presented on TradingView is provided to Vantage (‘Vantage Global Limited’, ‘we’) by a third-party provider (‘Everest Fortune Group’). Please be reminded that you are solely responsible for the trading decisions on your account. There is a very high degree of risk involved in trading. Any information and/or content is intended entirely for research, educational and informational purposes only and does not constitute investment or consultation advice or investment strategy. The information is not tailored to the investment needs of any specific person and therefore does not involve a consideration of any of the investment objectives, financial situation or needs of any viewer that may receive it. Kindly also note that past performance is not a reliable indicator of future results. Actual results may differ materially from those anticipated in forward-looking or past performance statements. We assume no liability as to the accuracy or completeness of any of the information and/or content provided herein and the Company cannot be held responsible for any omission, mistake nor for any loss or damage including without limitation to any loss of profit which may arise from reliance on any information supplied by Everest Fortune Group.
Harmonic Patterns
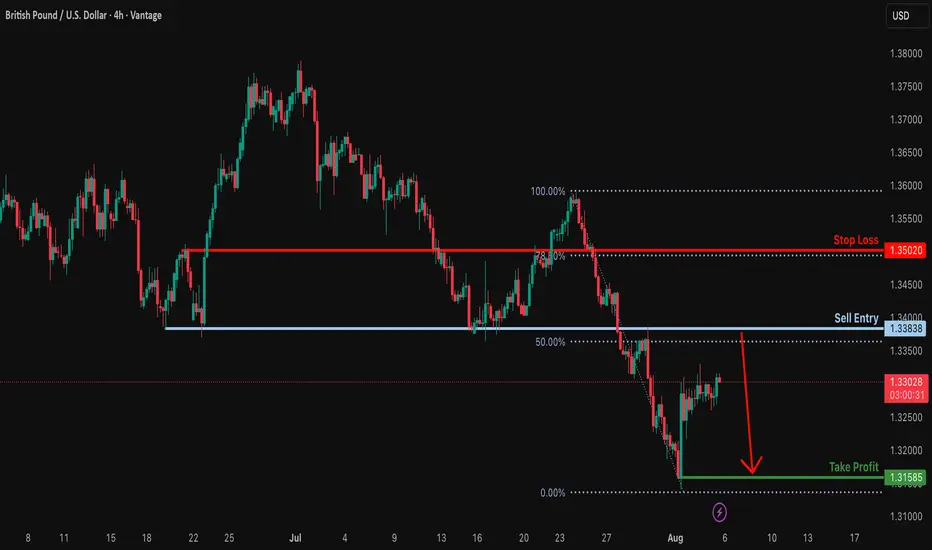
Bearish reversal off pullback resistance?GBP/USD is rising towards the resistance level, which is a pullback resistance that is slightly above the 50% Fibonacci retracement and could drop from this level to our take profit.
Entry: 1.3383
Why we like it:
There is a pullback resistance that is slightly above the 50% Fibonacci retracement.
Stop loss: 1.3502
Why we like it:
There is a pullback resistance that lines up with the 78.6% Fibonacci retracement.
Take profit: 1.3158
Why we like it:
There is a swing low support.
Enjoying your TradingView experience? Review us!
Please be advised that the information presented on TradingView is provided to Vantage (‘Vantage Global Limited’, ‘we’) by a third-party provider (‘Everest Fortune Group’). Please be reminded that you are solely responsible for the trading decisions on your account. There is a very high degree of risk involved in trading. Any information and/or content is intended entirely for research, educational and informational purposes only and does not constitute investment or consultation advice or investment strategy. The information is not tailored to the investment needs of any specific person and therefore does not involve a consideration of any of the investment objectives, financial situation or needs of any viewer that may receive it. Kindly also note that past performance is not a reliable indicator of future results. Actual results may differ materially from those anticipated in forward-looking or past performance statements. We assume no liability as to the accuracy or completeness of any of the information and/or content provided herein and the Company cannot be held responsible for any omission, mistake nor for any loss or damage including without limitation to any loss of profit which may arise from reliance on any information supplied by Everest Fortune Group.
EURUSD live intraday trade with break down 6k profit EUR/USD remains offered near 1.1550 after US ISM data
EUR/USD is trading in negative territory on Tuesday, hovering around 1.1550 on the back of a decent comeback in the US Dollar. The data from the US showed that the ISM Services PMI edged lower to 50.1 in July from 50.8 in June, helping the pair limit its losses.

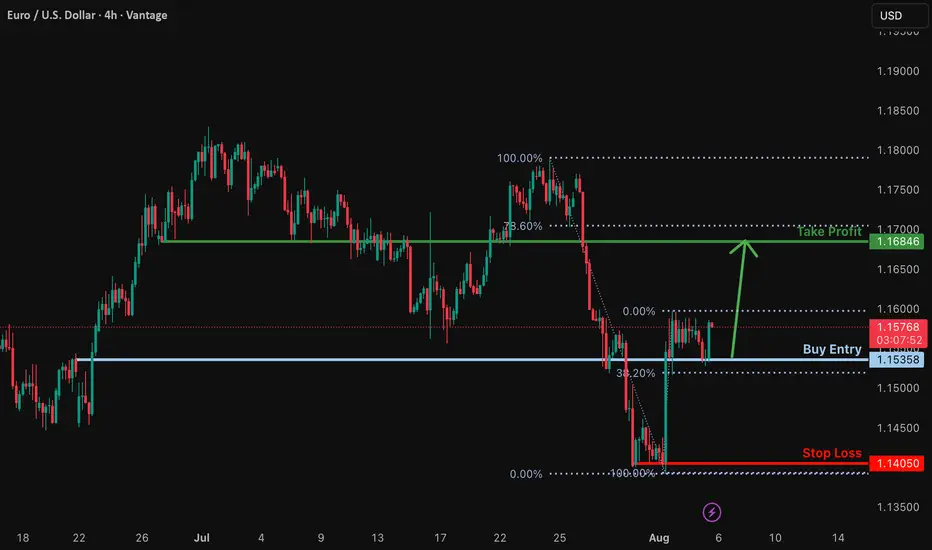
Bullish rise?EUR/USD has bounced off the support level, which is a pullback support that is slightly above the 38.2% Fibonacci retracement, and could rise from this level to our take profit.
Entry: 1.1535
Why we like it:
There is a pullback support that is slightly above the 38.2% Fibonacci retracement.
Stop loss: 1.1405
Why we like it:
There is a swing low support.
Take profit: 1.1684
Why we like it:
There is a pullback resistance that is slightly below the 78.6% Fibonacci retracement.
Enjoying your TradingView experience? Review us!
Please be advised that the information presented on TradingView is provided to Vantage (‘Vantage Global Limited’, ‘we’) by a third-party provider (‘Everest Fortune Group’). Please be reminded that you are solely responsible for the trading decisions on your account. There is a very high degree of risk involved in trading. Any information and/or content is intended entirely for research, educational and informational purposes only and does not constitute investment or consultation advice or investment strategy. The information is not tailored to the investment needs of any specific person and therefore does not involve a consideration of any of the investment objectives, financial situation or needs of any viewer that may receive it. Kindly also note that past performance is not a reliable indicator of future results. Actual results may differ materially from those anticipated in forward-looking or past performance statements. We assume no liability as to the accuracy or completeness of any of the information and/or content provided herein and the Company cannot be held responsible for any omission, mistake nor for any loss or damage including without limitation to any loss of profit which may arise from reliance on any information supplied by Everest Fortune Group.
$GAS is showing strong long-term accumulation — a major move migHOSE:GAS is showing strong long-term accumulation — a major move might be loading.

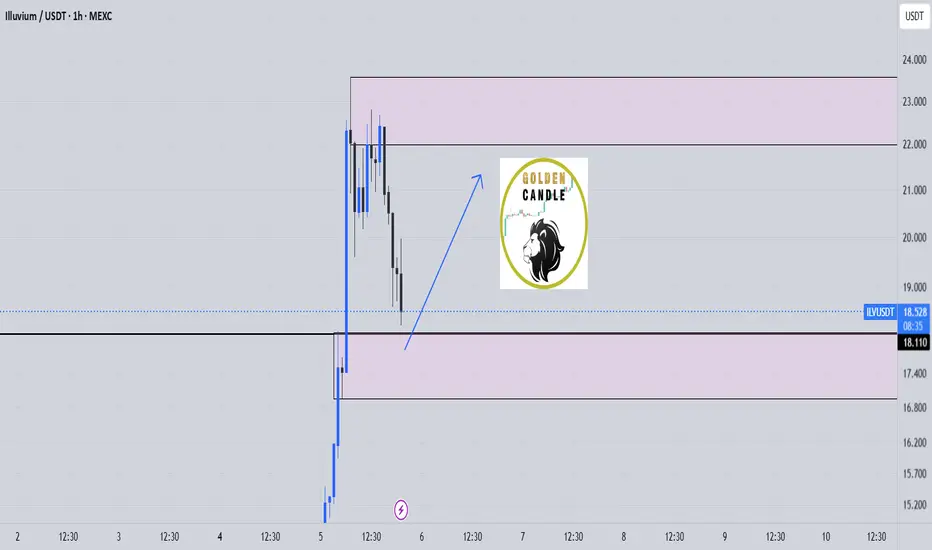
ilv buy midterm"🌟 Welcome to Golden Candle! 🌟
We're a team of 📈 passionate traders 📉 who love sharing our 🔍 technical analysis insights 🔎 with the TradingView community. 🌎
Our goal is to provide 💡 valuable perspectives 💡 on market trends and patterns, but 🚫 please note that our analyses are not intended as buy or sell recommendations. 🚫
Instead, they reflect our own 💭 personal attitudes and thoughts. 💭
Follow along and 📚 learn 📚 from our analyses! 📊💡"
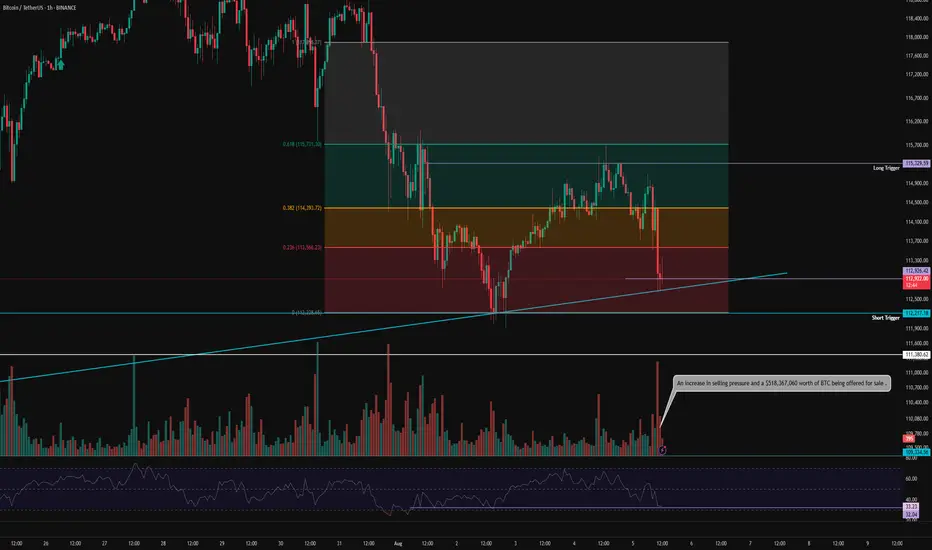
BTC 1H Analysis – Key Triggers Ahead | Day 2💀 Hey , how's it going ? Come over here — Satoshi got something for you !
⏰ We’re analyzing BTC on the 1-hour timeframe .
👀 After the strengthening of the US dollar , Bitcoin experienced a drop and formed a short-term support bottom around the $113,000 level . It is currently completing a pullback to the levels of this recent decline .
🎮 Our Fibonacci retracement is drawn from the breakout zone to the $112,200 bottom . Bitcoin broke below the 0.236 level and then found support . The best potential entry trigger, based on Fibonacci, is at the 0.382 level, or around $115,000 . If Bitcoin breaks above this level , it could form a higher high and a higher low in this timeframe .
⚙️ The RSI is showing a support level around 32 , which is currently preventing Bitcoin from entering the oversold zone . However , if this support is lost , Bitcoin could move into oversold territory .
📈 Our long position trigger is at the 0.382 Fibonacci level . A confirmed breakout of this level , combined with RSI overbuying and increased volume , would be our entry signal .
📉 Our short position trigger is around $113,000 . If this support breaks , we may open a short position . However, the main short trigger is at the 0 Fibonacci level ( support at $112,200 ) . If selling pressure increases and RSI enters the oversold zone , we will consider entering a short position with confirmation .
❤️ Disclaimer : This analysis is purely based on my personal opinion and I only trade if the stated triggers are activated .
NASDAQ 100 BOUNCE OFF SUPPORT FROM BUY ZONE!Hey Traders so today looking again at the Nasdaq 100 looks like we got a bounce right off the level of support that I thought it could hold 22,806.
Why that level?
I trade off the daily charts so every candle is one day and I believe that price action is everything in these markets it's all about support and resistance. The market tried 9 days to test that level from 07/03-07/15. But it kept getting rejected then it rallied off it so I just felt that maybe thats a level that the market might halt some of the selling. Ok so maybe I got it right yay!
Guess what? Sometimes we will get it completely wrong! So getting market direction right is only half the battle. The key is risk management.
I have learned it's not how we enter a trade that counts but how we exit. Can we get out with a profit? Ok enough of the classroom for today. 🤓
So where are we market bounced off support at 22,800 yes you are in profit if you took buy zone but we also have risk still in the trade so I say lower the risk by moving the stop about half way up from 22,533 to 22,700. That way if there is a market reversal we don't get stopped out at full loss. Then try to stay 3 days behind the market so it has room to breathe if it can test the all time high again at 22,830 that would be a great place to take some profits!
This is the way I stay 3 days behind the market. But if you have another profit strategy that works better then continue to do what works for you.
However if bearish way until market breaks a strong support level before consider selling into rally.
COT REPORT
LARGE SPECS = NET LONG 34,954
So lets see what happens this week.
Good Luck & Always use Risk Management!
(Just in we are wrong in our analysis most experts recommend never to risk more than 2% of your account equity on any given trade.)
Hope This Helps Your Trading 😃
Clifford

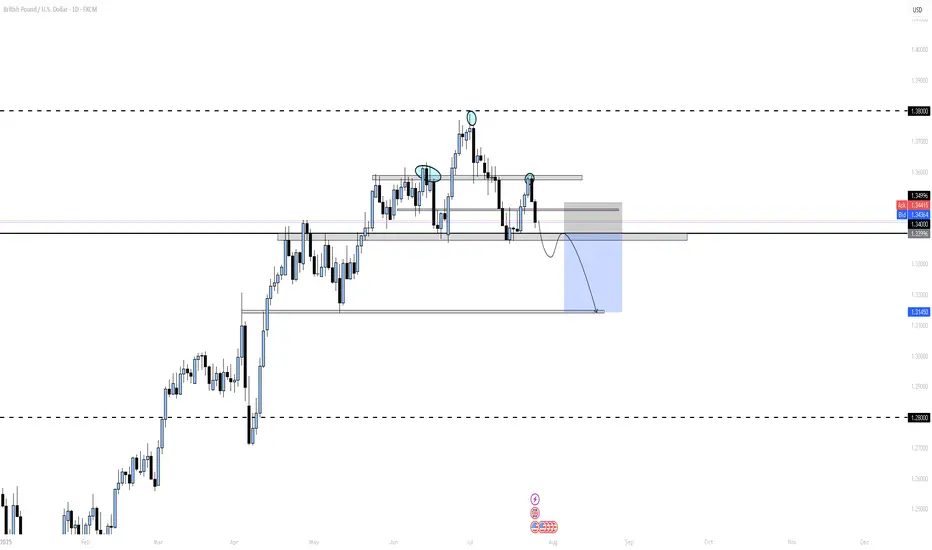
GBP/USD Short Bias – Bearish Fundamentals + Smart Money StructurThe macro environment continues to favor USD strength and GBP weakness, setting up a clean short scenario both fundamentally and technically.
Fundamentals First:
Bank of England is expected to cut rates in the coming months as inflation falls and growth slows. June CPI came in lower than expected, and consumer spending remains weak.
UK GDP growth is flatlining, and PMI data continues to signal contraction in services and manufacturing.
IMF has warned the UK about fiscal imbalances and productivity issues, adding bearish pressure to GBP outlook.
Meanwhile, the Fed remains on hold, with strong U.S. labor data, robust consumer spending, and persistent core inflation — supporting the USD.
Institutional Outlook:
JPMorgan and Citi see GBP/USD downside risks as BoE policy shifts from restrictive to accommodative.
ING and BofA have noted bearish positioning building in GBP against the USD.
Technical Setup:
On the 4H chart, we’re watching a clean Head & Shoulders structure
A break and retest of the neckline confirms downside continuation.
Setup is backed by:
Institutional sentiment
Macro data divergence (UK vs U.S.)
Smart money structure + liquidity zones
EUR/USD Trading Idea – Key Breakout Levels in FocusNeutral bias with breakout potential
Technical Analysis
EUR/USD is currently trading just below the key resistance zone of 1.1600, consolidating in a tight range.
A break and close above 1.1600 could confirm bullish momentum and open the door toward the next targets at:
-1.1700 (mid-term resistance/imbalance)
-1.1800 (extension target from recent swing low).
On the bearish side, the pair remains capped by the:
-50-day EMA and 200-day EMA, both still above current price
-These moving averages signal potential resistance if the breakout fails and could drag EUR/USD lower toward 1.1200–1.1400 support.
Fundamental Drivers
+Bullish Case for EUR/USD
Dovish Fed outlook after U.S. Non-Farm Payrolls missed expectations (+73K), increasing speculation of a rate cut by September
Political pressure on the Fed and questions around U.S. data credibility are eroding dollar confidence (Reuters, Aug 5)
ECB expected to pause rate hikes, but not cut imminently, with July inflation steady at ~2.0–2.3%
JPMorgan, Goldman Sachs, and MUFG forecast EUR/USD to reach 1.17–1.22 by year-end, with medium-term structural weakness in the USD
Bearish Risk Factors
EMA 50/200 above price suggest momentum is still fragile
Technical rejection at or near 1.1600 could trigger another pullback to 1.1200-1.1400 support
Wells Fargo and SocGen still expect downside risk toward parity (1.00) if U.S. resilience surprises or eurozone growth weakens again
Conclusion
EUR/USD is approaching a decisive moment around the 1.1600 resistance.
A confirmed breakout could realign the pair with institutional upside targets, while failure below the EMAs could drag it back into range or deeper correction.
Watch 1.1600 for clean confirmation.

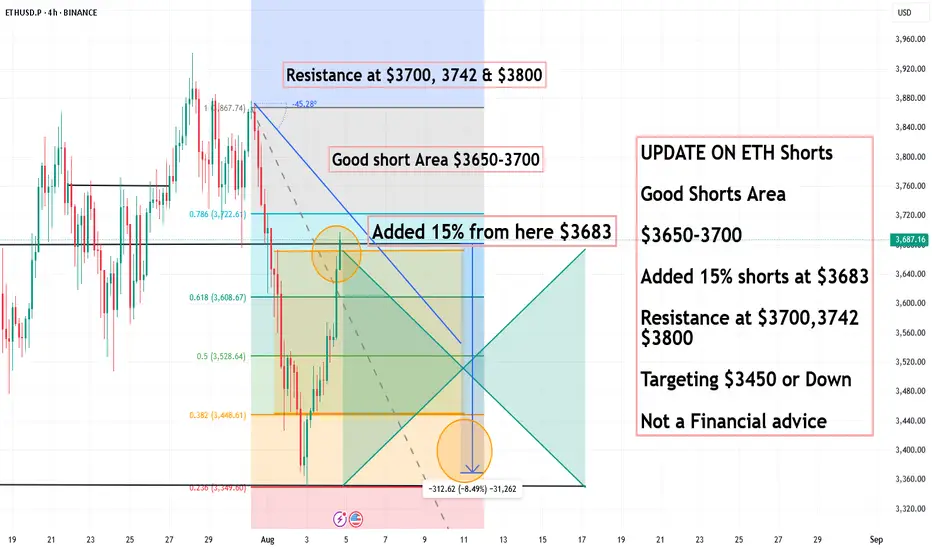
UPDATE ON ETH Shorts, Good Shorts Area $3650-3700UPDATE ON ETH Shorts
Good Shorts Area
$3650-3700
Added 15% shorts at $3683
Resistance at $3700,3742
$3800
Targeting $3450 or Down
Not a Financial advice
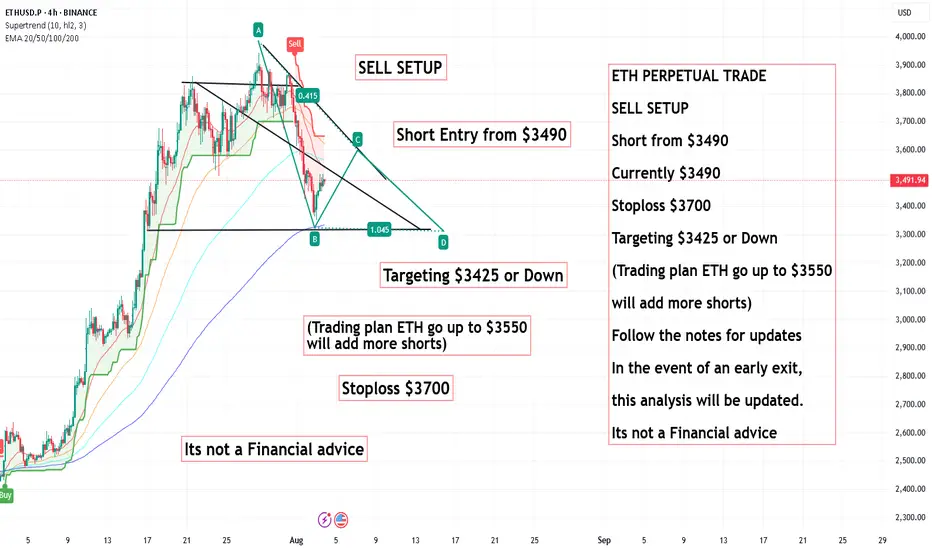
ETH PERPETUAL TRADE ,Short from $3490ETH PERPETUAL TRADE
SELL SETUP
Short from $3490
Currently $3490
Stoploss $3700
Targeting $3425 or Down
(Trading plan ETH go up to $3550
will add more shorts)
Follow the notes for updates
In the event of an early exit,
this analysis will be updated.
Its not a Financial advice
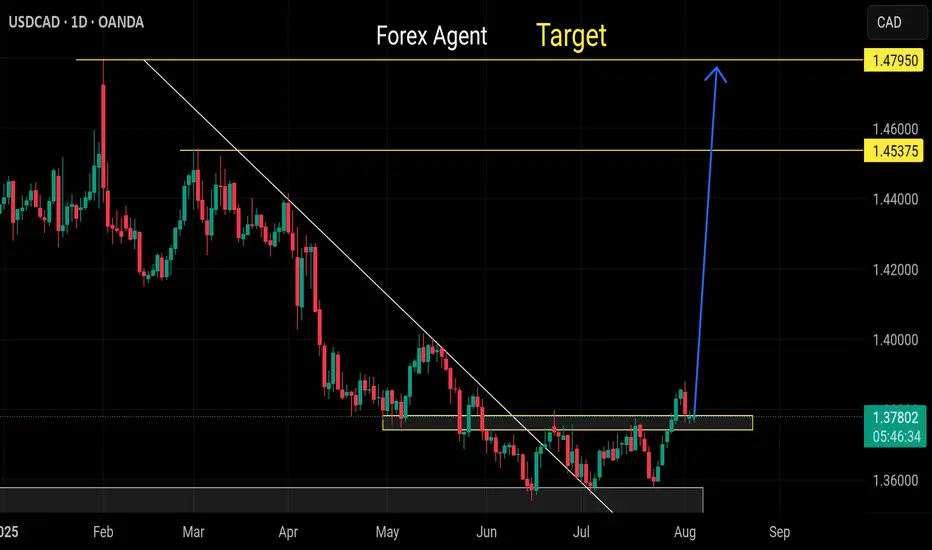
Usdcad buy Remain strong bullish
Trend broken
Respecting its support level wait for LTF confirmation the. Straight buy
Sell gbpusd Still remain bearish continuation
Trend buy already broken , lower low also broken
Respecting down trend structure

BITCOIN LOG UPDATESThis meaningful indicators on logarithmic, Since 2022- now I still used this on BITCOIN.
it works, some of my followers doubt this but its fine, we might see 170k per bitcoin by end of this year? This predictions base on the logarithmic , this indicator shows how the supply works with only 21M bitcoins, unlike other commodities. Bitcoin is the most followed commodities on this indicator I rarely used.
Youve come here so far to know bitcoin, here is my chart for this year. It will keep Bitcoin hard to buy until it reached a million per coin, then the public regret it.
Keep the word DCA. Goodluck.
Holding it is the key.

GOLD short term Analysis. - 15 mins. Gold (XAU/USD) – Harmonic Pattern Analysis (15m Chart)
As of: August 5, 2025
🔶 Pattern Observed: Bearish Harmonic (likely Gartley or Butterfly)
Pattern Completion: Near 3385–3390 zone
The price has tested the PRZ (Potential Reversal Zone) and started showing early signs of weakness.
A clear "Short only below here" marker is drawn just below 3370, signaling key support.
🔻 Short Trade Thesis:
If price breaks and sustains below 3370, bearish confirmation is triggered.
This confirms the harmonic pattern's validity and opens the path for impulsive downside targets.
🎯 Downside Targets (if 3370 breaks):
First target: 3310–3320
Second target: 3265–3270
Final target (extended move): 3180–3200
⚠️ Invalidation:
If price breaks above 3395–3400, the harmonic setup is invalidated.
In such case, avoid any short setups and re-analyze price action for new trend direction.
Conclusion:
This harmonic pattern suggests a high-probability short setup below 3370, with clean targets mapped out. However, it's critically important to wait for confirmation (break and retest or strong momentum candle) before entry. If the price starts moving up from current levels without breaching 3370, this setup becomes invalid.
⚠️ Disclaimer:
This analysis is for educational and informational purposes only and should not be considered as financial advice. Trading commodities and financial instruments involves significant risk and may not be suitable for all investors. Please perform your own due diligence or consult with a licensed financial advisor before making any trading decisions. The author is not liable for any losses incurred based on this analysis.

BUY NZDJPYA double bottom pattern has emerged on NZDJPY 1 hour chart. We will see price escalate in the next coming hours.

XAUUSD - TAKE A LOOKHere are some guidelines of what could happen. This is purely technical analysis, which may be affected by any news, but it is currently aligning with the ongoing movement.

BTC PERPETUAL TRADE ,Short from $113,700
BTC PERPETUAL TRADE
SELL SETUP
Short from $113,700
Currently $113,700
Stoploss $116,800
Targeting $111,600 or Down
(Trading plan BTC go up to $115K
will add more shorts)
Follow the notes for updates
In the event of an early exit,
this analysis will be updated.
Its not a Financial advice

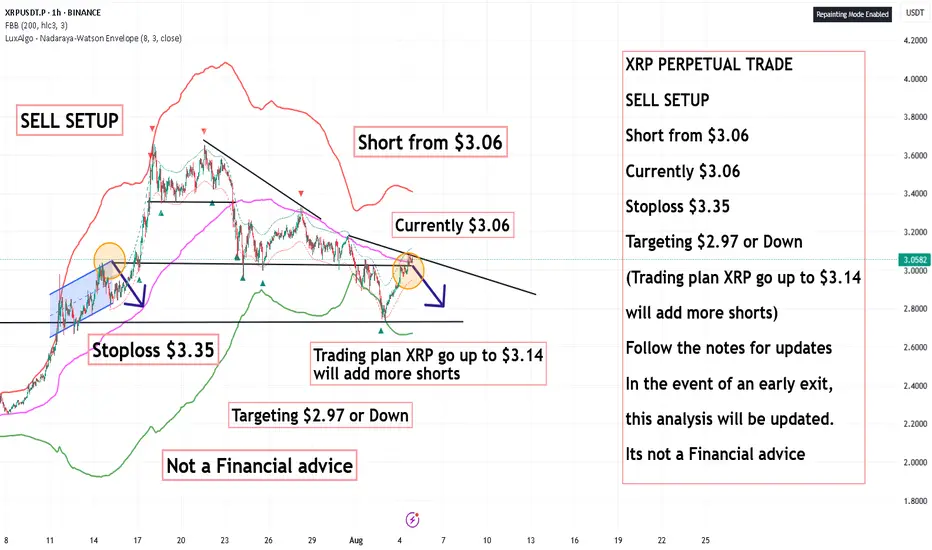
XRP PERPETUAL SELL SETUP ,Short from $3.06XRP PERPETUAL TRADE
SELL SETUP
Short from $3.06
Currently $3.06
Stoploss $3.35
Targeting $2.97 or Down
(Trading plan XRP go up to $3.14
will add more shorts)
Follow the notes for updates
In the event of an early exit,
this analysis will be updated.
Its not a Financial advice
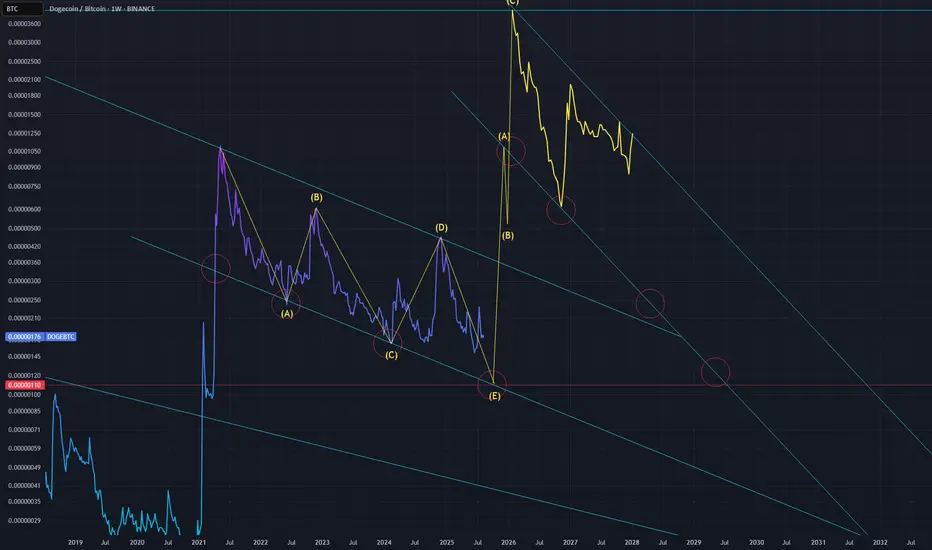
Elon to send DOGE."Elon Musk awarded $30 billion in bid to keep him at Tesla for years." - August 5, 2025.
Make no mistake about it, Elon wants DOGE to hit every headline.
Expect to see DOGEUSD at >$5 or higher. At these valuations, DOGE would be >10% of the total marketcap. 1 trillion marketcap for DOGE is possible in this cycle - yes you heard that right.
DOGEUSD at $6.9. Why not? Just full send.
We remain bullish on gold prices today—3400+.We remain bullish on gold prices today—3400+.
As shown in Figure 4h, gold prices are actively breaking through.
Currently, the upper resistance level for gold is 3385-3390.
Going long at low prices is a good strategy.
We exited yesterday at 3380 and entered today around 3350-3360, achieving very stable profits.
Current support level for gold: 3350-3360.
Gold prices have now resumed their upward trend, indicating that bullish sentiment has returned to the primary upward trend.
Bullish sentiment will continue to strengthen.
Our target price for gold remains above 3400.
Day Trading Strategy:
1: Swing Strategy: 3350-3385 (Buy Low, Sell High)
2: Low-Price Long Strategy
Buy: 3350-3360-3370
Stop Loss: 3345
Target: 3380-3400
3: High-Price Short Strategy: (Caution is advised when trading short positions; avoid short positions)

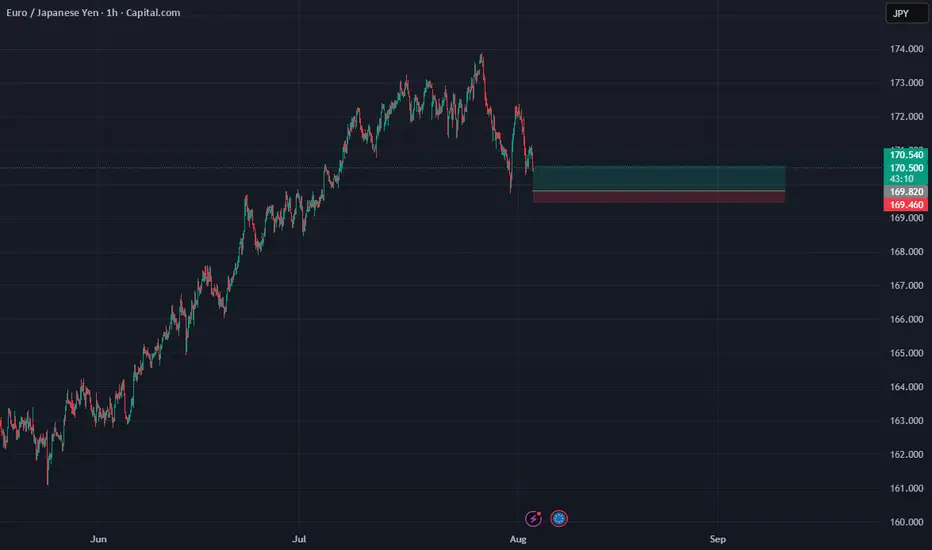
ENTRY EURJPYDisclaimer:
This is merely a chart-based analytical trading idea and is not considered investment advice. Please manage your risks carefully and conduct your own research before making any trading decisions.