NZDUSD long trade dated 29 July 2025- Breakout of last LH will suggest that the odds are in favour of the long trade
- Presence of a bullish AB=CD pattern increases our chances. However entry set via Buy Stop after confirmed trend reversal
Harmonic Patterns

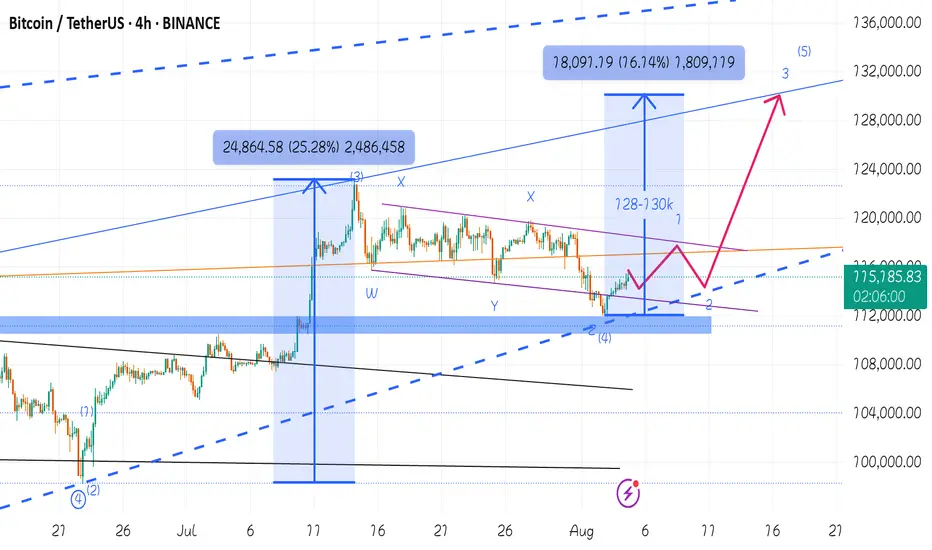
You don't know what's going on , 130K waiting for youI have shown in my previous post that Bitcoin is looking for a correction of wave 4 from wave 5 of the main wave 3 of Elliott waves, I said wait for 112k and then buy altcoins. It seems that the Elliott wave 4 micro-wave has completed its correction with the 50% Fibonacci percentage, I predict Bitcoin will touch the 128-130k levels at the end of Elliott wave 5. as I said before altcoins season is in the midway
EURUSDI open the long position in EURUSD in 1min tf
sl and Tp's are mentioned
follow the Risk Managements

#CGPT/USDT#CGPT
The price is moving within an ascending channel on the 1-hour frame, adhering well to it, and is on track to break it strongly upwards and retest it.
We have support from the lower boundary of the ascending channel, at 0.0888.
We have a downtrend on the RSI indicator that is about to break and retest, supporting the upside.
There is a major support area in green at 0.0881, which represents a strong basis for the upside.
Don't forget a simple thing: ease and capital.
When you reach the first target, save some money and then change your stop-loss order to an entry order.
For inquiries, please leave a comment.
We have a trend to hold above the 100 Moving Average.
Entry price: 0.0900.
First target: 0.0909.
Second target: 0.0922.
Third target: 0.0938.
Don't forget a simple thing: ease and capital.
When you reach your first target, save some money and then change your stop-loss order to an entry order.
For inquiries, please leave a comment.
Thank you.

Is the current Bitcoin price a good place to buy?Bitcoin has been falling since last night towards $112,000. I don't think it will go below that. I think $113,000 is a good price to buy. Of course, with a stop loss of 111,500. This is not a financial offer. Don't get into futures trading because you might lose all your money.

Crypto: BNBUSDT to hit 800 this weekLike I told on ETHUSDT in my last trade which hit TP level exactly with no drawdown:
, this is same trade like ETH on BNBUSDT, with my back testing of this strategy, BNBUSDT need to touch 800 this week or next monday.
This is good trade.
Don't overload your risk like Greedy gambler!!!
Be Disciplined Trader, what what you can afford.
Use proper risk management
Disclaimer: only idea, not advice

Soybean Long to hit 1011 CAPITALCOM:SOYBEAN Long trade, with my back testing of this strategy, Soybean need to touch 1011
This is good trade.
Don't overload your risk like Greedy gambler!!!
Be Disciplined Trader, what what you can afford.
Use proper risk management
Looks like good trade.
Lets monitor.
Use proper risk management.
Disclaimer: only idea, not advice

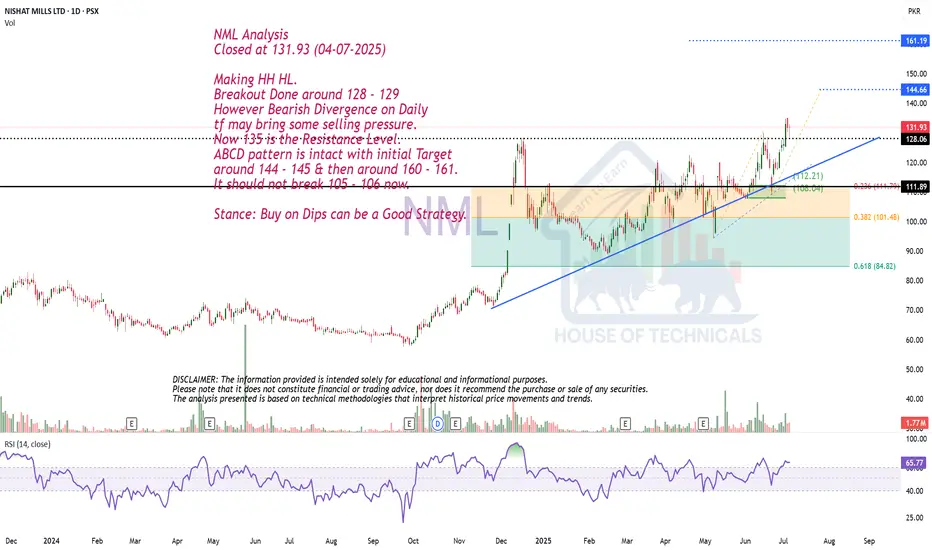
Making HH HL.NML Analysis
Closed at 131.93 (04-07-2025)
Making HH HL.
Breakout Done around 128 - 129
However Bearish Divergence on Daily
tf may bring some selling pressure.
Now 135 is the Resistance Level.
ABCD pattern is intact with initial Target
around 144 - 145 & then around 160 - 161.
It should not break 105 - 106 now.
Stance: Buy on Dips can be a Good Strategy.
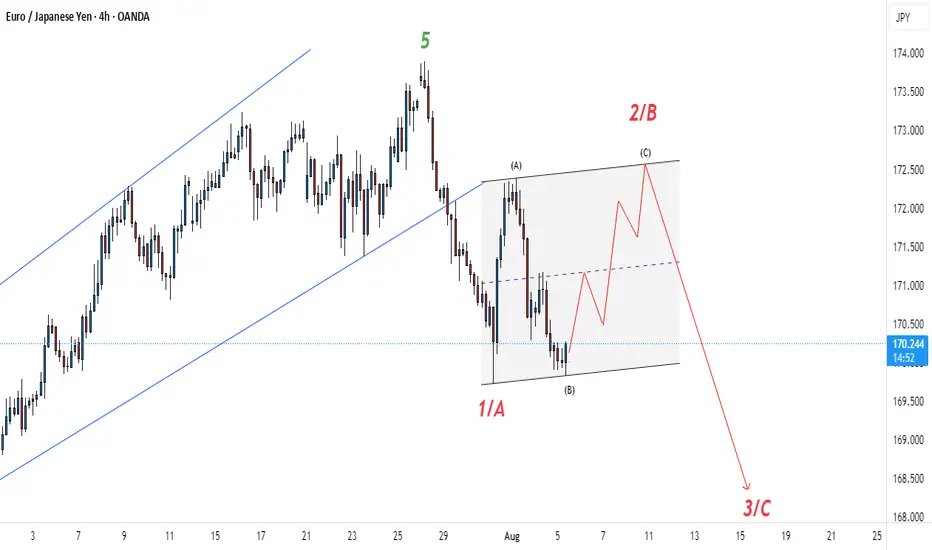
Bulls KnockigDespite the long term downstairs anticipation, we think that we're going for a little pullback, and we think a flat correction is cooking out before we proceed to the downside. Until then, kindly employ your trading strategies and this is strictly not investment advice.
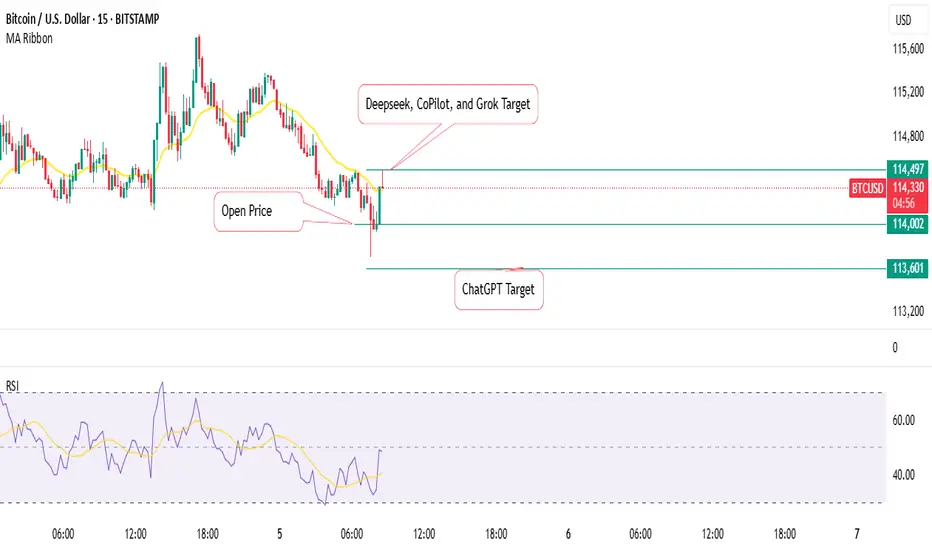
We have the Winner: AI Predicting Bitcoin PricesI asked Grok, CoPilot, ChatGPT, and Deepseek to predict the Bitcoin price with the indicators of their choice.
Only ChatGPT ended up losing.
BITSTAMP:BTCUSD
#VET/USDT Ascending Broadening Wedge #VET
The price is moving within an ascending channel on the 1-hour frame, adhering well to it, and is poised to break it strongly upwards and retest it.
We have support from the lower boundary of the ascending channel, at 0.02290.
We have a downtrend on the RSI indicator that is about to break and retest, supporting the upward move.
There is a key support area (in green) at 0.02278, which represents a strong basis for the upward move.
Don't forget one simple thing: ease and capital.
When you reach the first target, save some money and then change your stop-loss order to an entry order.
For inquiries, please leave a comment.
We have a trend of stability above the Moving Average 100.
Entry price: 0.02306
First target: 0.02339
Second target: 0.02378
Third target: 0.02423
Don't forget one simple thing: ease and capital.
When you reach the first target, save some money and then change your stop-loss order to an entry order.
For inquiries, please leave a comment.
Thank you.

BUY XAUUSD ....GOLDBUY XAUUSD price gas reached a potential strong bullish orderblock and a well structured demand zone
use proper risk management

It is a time for FISUSDT? 30% profit - 0.15 USDThe analysis of the FIS/USDT chart on Mexc shows that the current price is around 0.11534 USD, close to a local low after a recent decline. A clear downtrend is visible since the July peak, but recent days suggest a potential rebound, which could mark the start of an upward movement. A suggested rise to 0.15 USD (approximately 30% from the current level) is possible if the price breaks through the resistance around 0.12 USD and stays above the 50-day moving average, currently acting as dynamic support. This move could be supported by increasing volume and positive signals from the oscillator at the bottom of the chart, if it indicates an exit from the oversold zone. A key support level is at 0.11 USD – a drop below this could invalidate the bullish scenario. It is recommended to monitor the breakout above resistance and confirm the trend in the upcoming sessions.
Potential TP: 0.15 $

Asking Deepseek to Predict BTC priceI asked Grok to choose 2 indicators and then predict the next Move of
BITSTAMP:BTCUSD
We'll check back soon

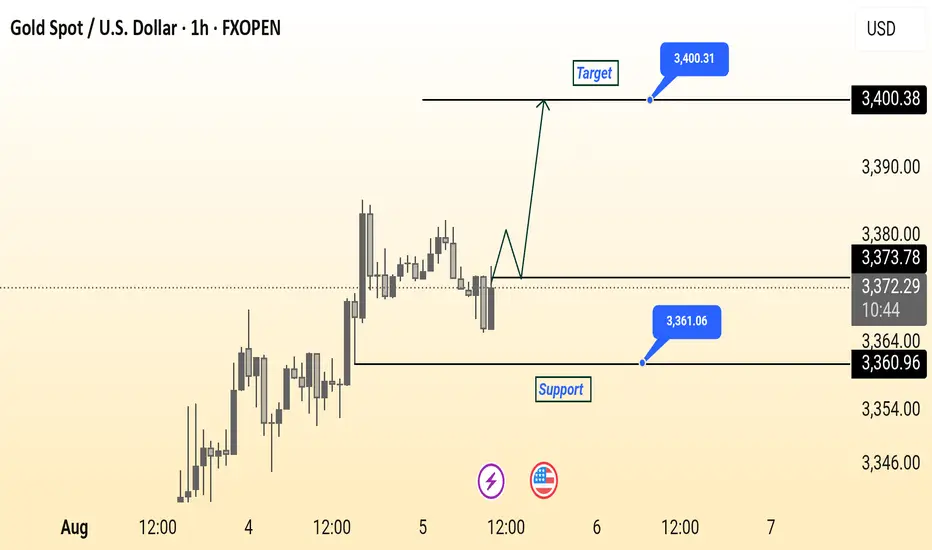
Gold Spot (XAU/USD) 1-Hour Chart Analysis – Potential Upside TowThis 1-hour chart for Gold Spot (XAU/USD) from FXOPEN shows a key support level at $3,360.96 and a potential target at $3,400.31. The current price is hovering around $3,372.04, just below the minor resistance of $3,373.78. A bullish breakout from this zone could initiate a move toward the target, as illustrated by the projected upward path. The support zone marked in blue suggests a strong buying interest that could act as a rebound area if prices dip. Watch for price action confirmation near support for potential long entries.
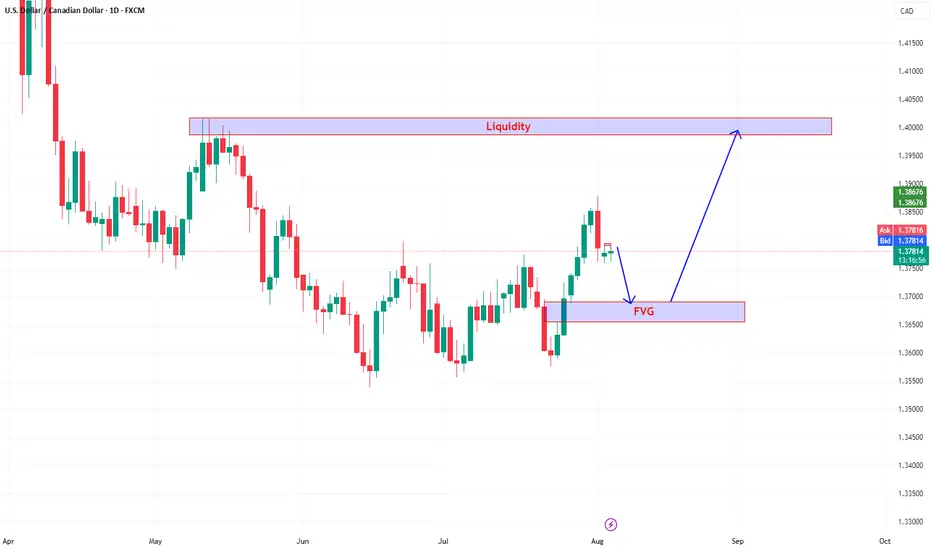
USDCAD is forming a bullish structure.We can a clear bullish structure forming after a series of higher highs and higher lows, indicating bullish momentum building. Recently, price rejected from a key swing high and appears to be pulling back. This pullback is targeting a Fair Value Gap (FVG) marked in the blue zone then bounce from the FVG zone back toward the overhead Liquidity Zone.
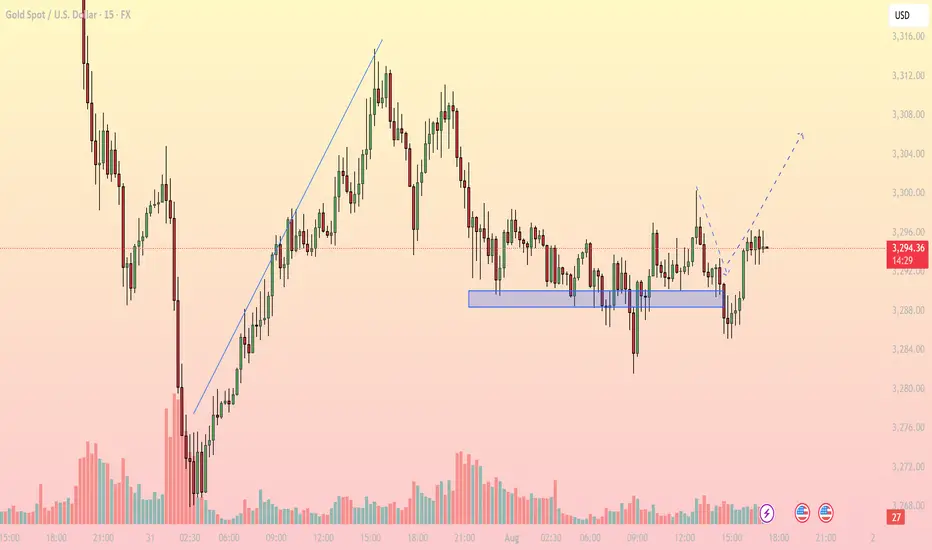
Bullish Rejection from Support, Upside in FocusMarket Overview: On the M15 timeframe, XAUUSD shows signs of a short-term bullish reversal after a prolonged sideways range around the key support zone of 3,286 – 3,289 USD. Price faked out below this support but quickly recovered, forming a V-shape reversal, suggesting strong buying interest has returned.
Key Levels to Watch:
Support Zones:
- 3,286 – 3,289: Strong intraday support, tested multiple times with sharp rejections
- 3,274: Next significant support if the above zone fails
Resistance Zones:
- 3,300 – 3,304: First resistance target aligned with the recent high
- 3,308 – 3,312: Higher resistance area where supply may emerge
Technical Indicators:
EMA: Price has reclaimed the short-term EMAs, indicating bullish momentum on lower timeframes
RSI: Rising above 50 but not yet overbought – there’s room for further upside
Volume: Increasing volume during the bounce confirms buying strength
Trading Strategy:
- Bullish Scenario (Preferred): Entry Zone: Watch for pullback toward 3,290 – 3,292
Stop Loss: Below 3,285
Take Profit 1: 3,300
Take Profit 2: 3,304
Extended Target: 3,308 – 3,312 (if bullish momentum continues beyond breakout zone)
- Bearish Scenario (Alternate): Only valid if price breaks and closes strongly below 3,286
Short Target: 3,274 – 3,270
Note: Counter-trend strategy – higher risk, requires strong confirmation
Conclusion: Gold is showing a bullish price structure on the 15-minute chart. As long as price holds above the 3,286 – 3,289 support zone, the path of least resistance appears to be upward, with 3,300 and 3,304 as the next logical targets. Monitor price action closely during the U.S. session for a potential long setup.
- Follow for more real-time gold trading strategies and save this idea if you find it helpful!
NAS100 – Supply Zone Rejection Trade IdeaPrice has entered a strong supply zone (highlighted in blue), where previous selling pressure originated. A sharp move up has now slowed within this zone, potentially signaling a distribution phase or exhaustion of bullish momentum.
🔰 Key Levels:
🟦 Supply Zone: 23,170 – 23,260
🔵 Mid Support: 22,995.13 (Potential retracement level)
🟧 Demand Zone: 22,680 – 22,750
🔽 Red arrows indicate potential downside targets.
🧠 Smart Money Perspective:
Price has filled the Fair Value Gap (FVG) and tapped into a low-volume node on the visible range volume profile.
Signs of liquidity sweep and exhaustion within the supply zone.
Possible short setup forming if price confirms a Change of Character (CHOCH) on LTF (e.g., break of short-term bullish structure).
💡 Trade Idea:
Short Entry: On confirmation inside supply zone
SL: Above 23,260
TP1: 22,995 (reaction level)
TP2: 22,737 (major demand zone)
Watch for a reaction at the 22,995 level; if price slices through, the next destination may be the orange demand block.
⚠️ Disclaimer:
This is for educational purposes only, not financial advice. Always use proper risk management.
🔖 Hashtags:
#NAS100 #SmartMoney #PriceAction #SupplyZone #OrderBlock #CHOCH #LuxAlgo #FrankFx14 #TradingView #US100

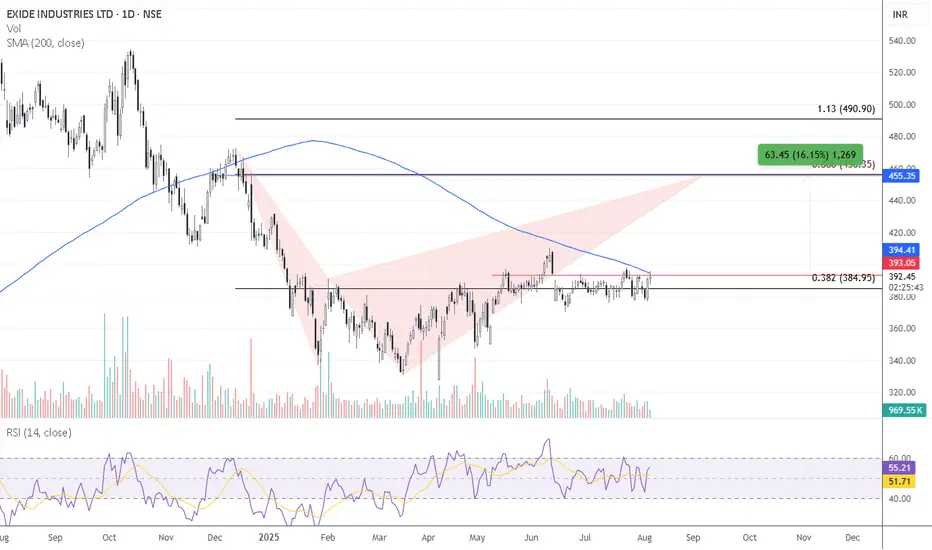
Exide Ltd is currently trading near its 200-day moving averageExide Ltd – Technical Outlook
Exide Ltd is currently trading near its 200-day moving average, which is acting as a key resistance level. A decisive breakout above this level could trigger a positional upmove of approximately 15%, making it a strong candidate for a medium-term long trade.
Additionally, the stock has been consolidating within a narrow 5% range, indicating a phase of accumulation. A breakout from this sideways range could present a short-term swing trading opportunity.
Actionable Insight:
Keep Exide Ltd on your watchlist for both positional and swing long trades, contingent on a breakout above key resistance levels.
Xau Usd Neyork time buy set up (05/08/2025)XAU USD Can buy with below level as swing as well as intraday
BUY FROM 3352/58
tp1- 3272
tp-2-3284
tp3-3393
tp4- 3410
SL- 3347/45 (for swing i prefer to hold
i use SMC/ fib tools. and truly a price action method for this entry
DOGEUSD Long Setup – Bounce from Strong Demand ZoneDogecoin is currently showing signs of a potential bullish bounce off a major demand zone (green area between $0.18049 – $0.19795). This zone previously served as a launchpad for the previous rally and is structurally significant for Smart Money participants.
🔑 Key Levels:
🟩 Demand Zone (POI): $0.18049 – $0.19795
🔵 First Resistance (TP1): $0.23329
🔵 Second Resistance (TP2): $0.27070
🔴 Current Price: $0.20494
📌 Smart Money Concept (SMC) Notes:
Break of Structure (BOS): Happened after the bullish rally from this same green zone.
Return to Discount: Price has now retraced into a discount level within the original demand zone.
Liquidity Grab: Sell-side liquidity likely swept from previous lows before showing signs of bullish intent.
🛠️ Trade Plan:
Entry: Inside the green zone upon bullish confirmation
Stop Loss: Below $0.18049 (structure break)
TP1: $0.23329
TP2: $0.27070
🔮 Forecast:
If buyers step in around the demand zone, DOGEUSD may begin a bullish impulse wave, targeting the upper resistance zones and potentially forming a new higher high.
🛑 Disclaimer:
This is not financial advice. For educational purposes only. Use proper risk management.
📎 Hashtags:
#DOGEUSD #Dogecoin #CryptoAnalysis #SmartMoney #PriceAction #OrderBlock #BOS #DemandZone #FrankFx14 #TradingView

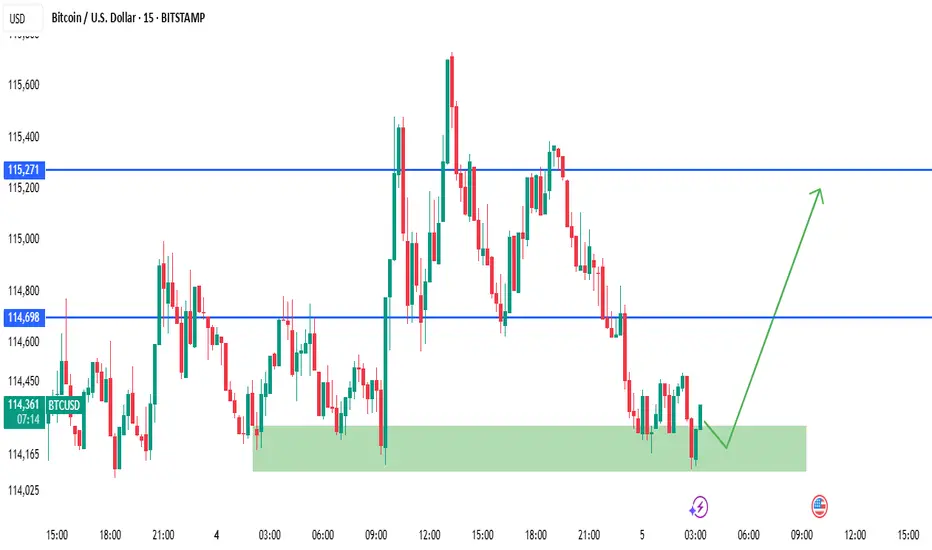
BTCUSD Rejection from Demand Zone – Bullish Play Ahead?Bitcoin just tapped into a strong intraday demand zone (green zone) after a clean selloff. This area has previously acted as a reaction point and is showing signs of holding again.
🔰 Key Levels:
🟩 Demand Zone (Buy Zone): $114,050 – $114,200
🔵 Intraday Resistance: $114,698
🔵 Final Target (Liquidity Pool): $115,271
💡 Bullish Plan:
Entry: Inside demand zone ($114,050 – $114,200)
SL: Below $114,000 (structure invalidation)
TP1: $114,698
TP2: $115,271
The green arrow shows a potential bullish move towards liquidity resting above recent highs if price shows rejection or bullish candle confirmation (e.g., engulfing, pin bar).
📊 SMC Notes (Optional for Advanced Traders):
This is a possible mitigation of a bullish order block from earlier structure.
Price may be completing a liquidity sweep before internal structure break and rally.
Watch for a Change of Character (CHOCH) on lower timeframes for refined entry.
⚠️ Disclaimer:
This is not financial advice. Always use proper risk management and confirm your entries. This is for educational and analysis purposes only.
🔖 Tags:
#BTCUSD #Bitcoin #SmartMoney #PriceAction #OrderBlock #CryptoSignals #RejectionTrade #FrankFx14 #TradingView
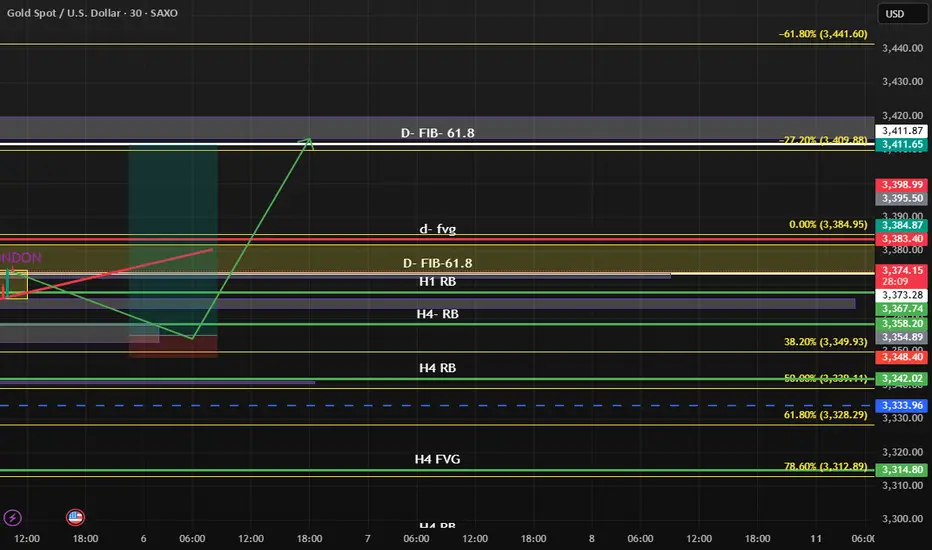
XAUUSD Smart Money Concept (SMC) Setup – 15min We had a clear break of structure (BOS) to the downside after price formed a lower high around the 3,430 level. Price then swept liquidity below the 3,290 area before aggressively rallying.
🔸 Liquidity Grab + Return to Premium:
That strong bullish move was likely engineered to grab liquidity from trapped sellers and induce breakout buyers. Now price is approaching a premium zone (the red supply zone), which aligns with a previous demand turned supply area – a perfect spot for institutional order blocks.
🔸 Order Block:
The red zone (around 3,375–3,385) represents a bearish order block, which caused the previous drop. Price is now retracing into it.
🔸 Internal Structure:
While approaching this zone, price is showing signs of bullish exhaustion. If we get a change of character (CHOCH) inside that zone, it confirms redistribution and signals entry.
📌 Trade Idea (SMC-Based Plan):
POI (Point of Interest): 3,375 – 3,385 (Supply / Order Block)
Confirmation: CHOCH / Rejection wick / Bearish engulfing
Entry: On confirmation inside red zone
SL: Just above the order block (~3,392)
TP1: 3,320 (first internal liquidity pool)
TP2: 3,290 (external liquidity sweep area)
🔽 Expectation:
Price to react to the supply zone, break internal structure, and begin a bearish move back to the demand zone, filling the imbalance left during the previous pump.
🛑 Risk Disclaimer:
This is not financial advice. Trade at your own risk. Use proper risk management and wait for confirmation before entering.
