#COS/USDT : Breakout setup ? #COS
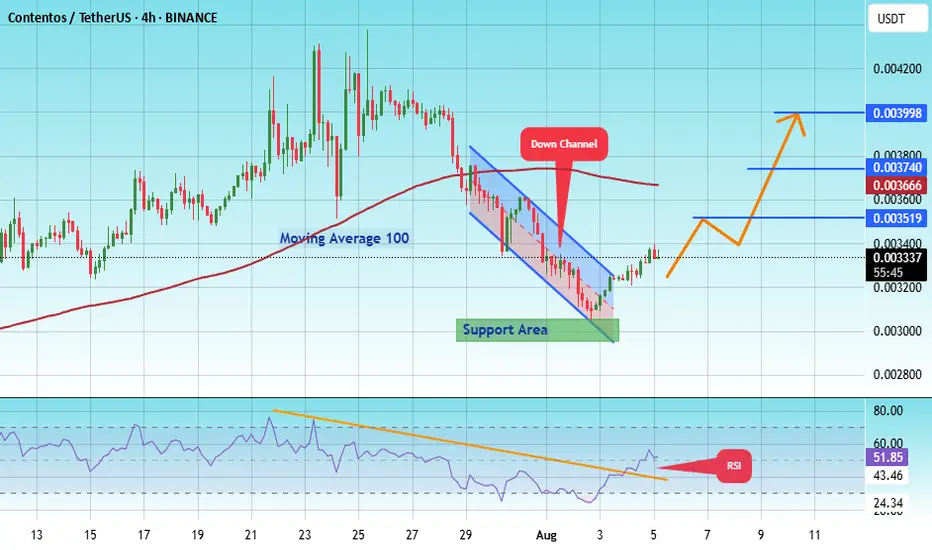
The price is moving within an ascending channel on the 1-hour frame, adhering well to it, and is poised to break it strongly upwards and retest it.
We have support from the lower boundary of the ascending channel, at 0.003071.
We have a downtrend on the RSI indicator that is about to break and retest, supporting the upward trend.
There is a key support area (in green) at 0.002970, which represents a strong basis for the upward trend.
Don't forget one simple thing: ease and capital.
When you reach the first target, save some money and then change your stop-loss order to an entry order.
For inquiries, please leave a comment.
We have a trend of stability above the Moving Average 100.
Entry price: 0.003339
First target: 0.003520
Second target: 0.003740
Third target: 0.004000
Don't forget one simple thing: ease and capital.
When you reach the first target, save some money and then change your stop-loss order to an entry order.
For inquiries, please leave a comment.
Thank you.
Harmonic Patterns
ENTRY EURJPYDisclaimer:
This is merely a chart-based analytical trading idea and is not considered investment advice. Please manage your risks carefully and conduct your own research before making any trading decisions.

BUY AUDUSDAUDUSD BUY Idea
Session: London
Target: 0,64796
We can expect a bullish liquidity grab in the next few hours

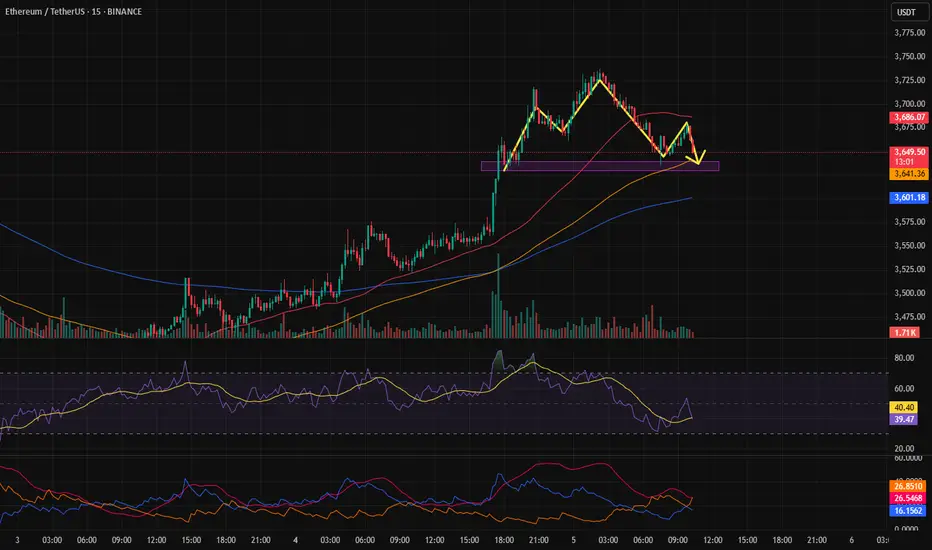
Pattern formationA head and shoulders pattern has formed on Ethereum. If it gets activated, the price is likely to drop. However, if it fails to activate, it will itself be a bullish signal.
AUDUSD BUY
AUD/USD rises to near 0.6480 as accelerating Fed dovish bets weigh on US Dollar
The AUD/USD pair moves higher to near 0.6480 during the European trading session on Monday. The Aussie pair gains as demand for risk-perceived assets has increased, following an increase in market expectations that the Fed could resume its monetary expansion cycle in the September meeting
The AUD/USD currency pair, commonly known as the “Aussie”, represents how many US dollars (the quote currency) are needed to purchase one Australian dollar (the base currency). Alongside the New Zealand Dollar (NZD) and the Canadian Dollar (CAD), the AUD is considered a commodity currency due to Australia’s significant exports of raw materials such as precious metals, Oil, and agricultural products.
The Reserve Bank of Australia (RBA) has historically maintained higher interest rates compared to other industrialized nations. Combined with the relatively high liquidity of the AUD, this has made the AUD attractive for carry traders looking for higher yields.
SUPPORT 0.64852
SUPPORT 0.65074
SUPPORT 0.65285
RESISTANCE 0.64498

SOLUSDT📊 #SOLUSDT
⏱ TIME: 1D
⭕️risk: mid
📍The initial buying market: 168-169
📌TP1: 192$
📌TP2: 224$
⛔️SL: 144$
❌These analyzes are just to give a better perspective for you dear ones
Do not base on buying and selling❌

Which altcoin hits the $50 club first? $INJ or $DOT? Which altcoin hits the $50 club first? CRYPTOCAP:INJ or CRYPTOCAP:DOT ? 🚀
3W HTF Technical Breakdown:
1⃣ CRYPTOCAP:INJ (@injective )
✔ Reclaimed structure above $13.31
✔ Targeting $31 → $52.98
✔ Clean 385% R:R setup
⚠ Invalidation below $8.79
2⃣ CRYPTOCAP:DOT (@Polkadot )
✔ Bounced from multi-year TL + demand zone
✔ Hold above $3: Targets $16.67 → $24.37 → $55
✔ Monster 1,660% setup loading
Both charts are screaming high-conviction breakout.
The $50 race is on…
NFA & DYOR

Sell USDJPYWe can expect USDJPY to fall deeper into the support on Tuesday. A bearish flag indicates price is ready to decline.

Trading Ideas GBPUSD 1D [Disc On]Technical Analysis:
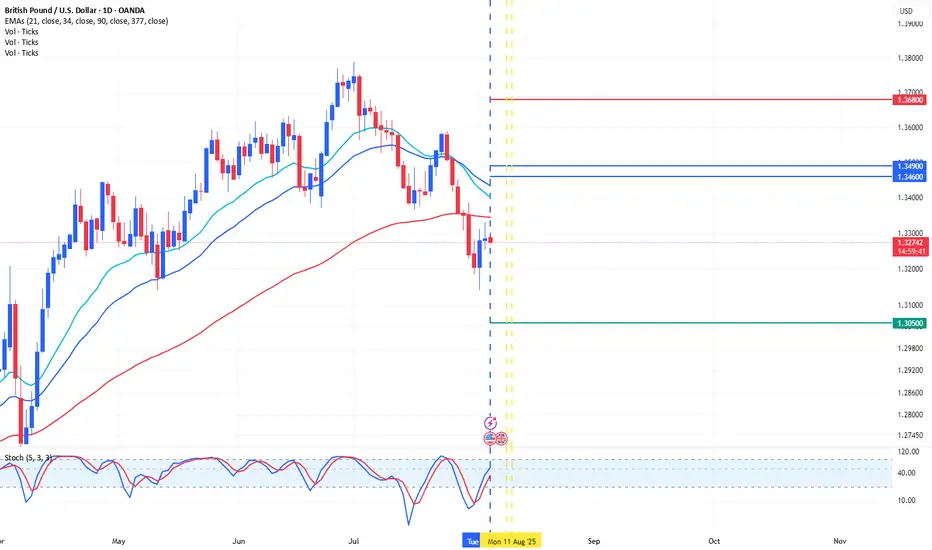
A bearish pattern has formed on the daily (1D) timeframe, with price action potentially targeting the Fibonacci cluster zone at the psychological level 1.3600 - 1.3490.
Fundamental Analysis:
Fed Interest Rate: 4.50% (in line with expectations)
BoE Interest Rate: (Release date: 7 August 2025)
Conclusion:
High probability for SELL entries in the 1.3600 - 1.3490 zone, with:
(SL): 1.3680
(TP): 1.3050
SOLUSDT- Golden Pocket Bounce: Bullish Phase or Another Fakeout?🔍 In-Depth Technical Analysis (1D Timeframe)
The SOL/USDT pair is currently showing a highly significant technical reaction as price bounces from the Fibonacci Retracement 0.5 - 0.618 zone (also known as the Golden Pocket), located between $166.63 - $157.13.
This level also aligns perfectly with a historical demand zone that has previously acted as a strong support during high-volume selloffs, creating a powerful confluence area.
---
🧩 Market Structure & Pattern
✅ Golden Pocket + Demand Zone: This overlap strengthens the probability of a valid bullish reversal.
🟠 Previous Movement: Price dropped from the recent swing high near $188 after failing to break through major resistance.
📉 Short-Term Downtrend: Currently in a corrective phase after an earlier bullish run.
---
🟢 Bullish Scenario (Rebound Confirmed from Golden Pocket)
If the price manages to hold above the $157 - $166 range and prints a bullish candle with volume confirmation:
1. A bullish breakout above $179 and more importantly $187.80 could open the door to further upside.
2. Potential midterm bullish targets:
🎯 Target 1: $205.69 (key psychological + structural level)
🎯 Target 2: $218.13 (previous reaction zone)
🎯 Target 3: $257.10
🎯 Target 4 (macro): $295.14
> The current zone offers an attractive risk-to-reward opportunity for swing traders, as long as the higher low structure is maintained.
---
🔴 Bearish Scenario (Breakdown from Key Support Zone)
Should the price break below $157 with strong selling volume:
1. That would invalidate the bullish setup and suggest a shift in structure.
2. Potential deeper correction targets include:
⚠️ Support 1: $140 (minor support from past structure)
⚠️ Support 2: $122 - $110 (major support zone from March–April 2025)
> A confirmed breakdown here would likely initiate a lower high – lower low structure, signaling a possible shift into a bearish medium-term trend.
---
📌 Additional Key Indicators to Watch
🔄 Volume Spike: Essential for validating any breakout or breakdown.
📉 Daily RSI: If RSI shows bullish divergence or bounces from oversold territory, that would strengthen the bullish case.
⏳ Daily Candle Close: Monitor the next 2–3 daily candle closes around this key zone for directional confirmation.
---
💡 Conclusion
SOL is at a crucial inflection point. The reaction around the $157 - $166 support confluence will likely determine the medium-term trend:
Bullish: If price reclaims $179–$188 zone with strong momentum
Bearish: If price breaks below $157 and closes with volume
This could be a high-reward opportunity for technical traders if confirmed properly.
---
🧠 Suggested Strategy:
🔹 Entry: Upon bullish confirmation in current demand zone
🔹 Stop Loss: Below $155 (for swing setups)
🔹 Take Profit Zones: $179 → $205 → $218 → $257+
#SOLUSDT #Solana #CryptoTechnicalAnalysis #FibonacciLevels #GoldenPocket #PriceAction #CryptoReversal #SwingTradeSetup #Altcoins #CryptoChart

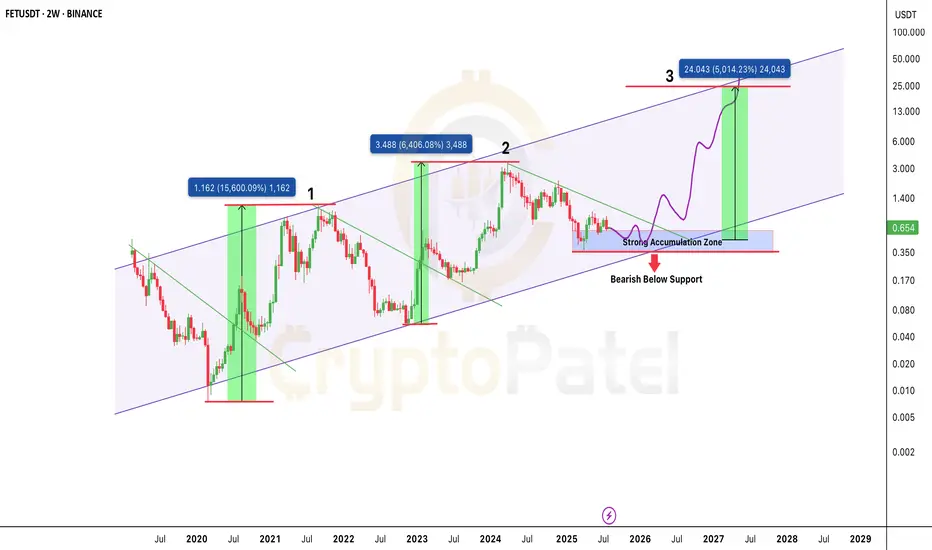
$FET is back in the zone that sparked 15,000%+ rallies?NYSE:FET is back in the zone that sparked 15,000%+ rallies. Same setup. 50x incoming?
FET continues to respect its multi-year ascending channel structure, active since 2020.
Price Action History:
🔹 Wave 1 (2020–2021): +15,600% rally from channel support to resistance
🔹 Wave 2 (2022–2024): +6,400% move following a similar breakout pattern.
🔹 Current Cycle (2025): Price is consolidating in the same accumulation range of $0.35–$0.65.
Key Demand Zone: $0.35–$0.65
Upside Target: ~$24.00 (5,000%+ potential)
🔻 Breakdown Level: Below $0.35 = Structure invalidation
Structure Insight:
Each macro move begins with:
🔹 Accumulation at channel support
🔹 Break of falling trendline
🔹 Aggressive expansion toward the upper boundary
The projected Wave 3 follows this same path if demand zone holds. The structure remains bullish as long as price stays above $0.35.
FET is trading at a high probability accumulation level within a valid macro trend. If history repeats, this could be the next major leg up.
✅ Favor long accumulation strategies
❌ Exit plan needed below $0.35
NFa & DYOR
Bitcoin (BTC): Either $108K or Back Above $117KBTC is in a volatile position, where purely on a chart we can't really tell whether we might be heading up or down from here.
What we noticed, though, is the order books orders near lower zones, where buyers have set few buys, possibly hinting to potential bullish movement to happen.
So what to keep in mind here?
1) Keep an eye on that bearish CME gap, which might be filled and marked as smaller target for short
2) Before we see either a breakout from the 117K area or a breakdown from the $108K zone, we should not enter into any early trades here on the current timeframe.
Swallow Academy

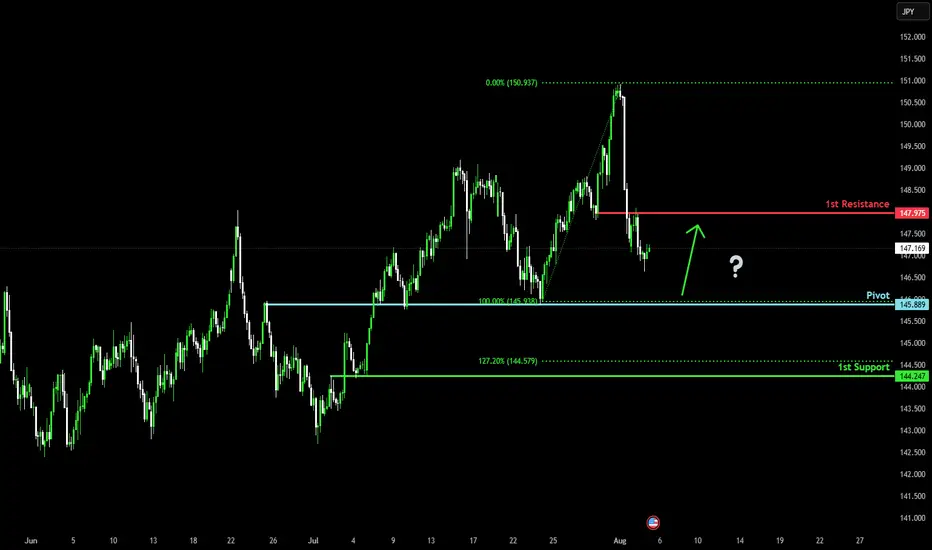
Falling towards major support?USD/JPY is falling towards the pivot, which has been identified as an overlap support and could bounce to the 1st resistance.
Pivot: 145.88
1st Support: 144.24
1st Resistance: 147.97
Risk Warning:
Trading Forex and CFDs carries a high level of risk to your capital and you should only trade with money you can afford to lose. Trading Forex and CFDs may not be suitable for all investors, so please ensure that you fully understand the risks involved and seek independent advice if necessary.
Disclaimer:
The above opinions given constitute general market commentary, and do not constitute the opinion or advice of IC Markets or any form of personal or investment advice.
Any opinions, news, research, analyses, prices, other information, or links to third-party sites contained on this website are provided on an "as-is" basis, are intended only to be informative, is not an advice nor a recommendation, nor research, or a record of our trading prices, or an offer of, or solicitation for a transaction in any financial instrument and thus should not be treated as such. The information provided does not involve any specific investment objectives, financial situation and needs of any specific person who may receive it. Please be aware, that past performance is not a reliable indicator of future performance and/or results. Past Performance or Forward-looking scenarios based upon the reasonable beliefs of the third-party provider are not a guarantee of future performance. Actual results may differ materially from those anticipated in forward-looking or past performance statements. IC Markets makes no representation or warranty and assumes no liability as to the accuracy or completeness of the information provided, nor any loss arising from any investment based on a recommendation, forecast or any information supplied by any third-party.
Heading into pullback resistance?The Cable (GBP/USD) is rising towards the pivot, which acts as a pullback resistance and could reverse to the 1st support.
Pivot: 1.3386
1st Support: 1.3104
1st Resistance: 1.3591
Risk Warning:
Trading Forex and CFDs carries a high level of risk to your capital and you should only trade with money you can afford to lose. Trading Forex and CFDs may not be suitable for all investors, so please ensure that you fully understand the risks involved and seek independent advice if necessary.
Disclaimer:
The above opinions given constitute general market commentary, and do not constitute the opinion or advice of IC Markets or any form of personal or investment advice.
Any opinions, news, research, analyses, prices, other information, or links to third-party sites contained on this website are provided on an "as-is" basis, are intended only to be informative, is not an advice nor a recommendation, nor research, or a record of our trading prices, or an offer of, or solicitation for a transaction in any financial instrument and thus should not be treated as such. The information provided does not involve any specific investment objectives, financial situation and needs of any specific person who may receive it. Please be aware, that past performance is not a reliable indicator of future performance and/or results. Past Performance or Forward-looking scenarios based upon the reasonable beliefs of the third-party provider are not a guarantee of future performance. Actual results may differ materially from those anticipated in forward-looking or past performance statements. IC Markets makes no representation or warranty and assumes no liability as to the accuracy or completeness of the information provided, nor any loss arising from any investment based on a recommendation, forecast or any information supplied by any third-party.

GBPCAD Forming Descending ChannelGBPCAD is currently trading within a well-defined descending channel on the 4H chart, and price action is showing early signs of a potential breakout to the upside. After multiple rejections from the lower boundary, the pair is now consolidating just beneath the channel resistance. If bulls manage to push above the upper trendline with strong volume, it would confirm a bullish breakout, offering a short-term trend reversal opportunity. A clean breakout could lead to a sharp rally toward the 1.8500–1.8600 levels, supported by momentum and market structure.
On the fundamental side, the British pound is gaining strength as markets continue to digest the Bank of England's recent tone, which remains relatively hawkish compared to other G7 central banks. With UK core inflation still elevated and wage growth running hot, the BoE is likely to remain cautious about rate cuts. Meanwhile, the Canadian dollar is under pressure, weighed down by falling oil prices and softer-than-expected Canadian employment data, which fuels expectations of a more dovish Bank of Canada. This divergence creates a bullish backdrop for GBPCAD in the near term.
Traders should watch for a clear break and candle close above the descending channel, especially above the 1.8350–1.8370 resistance zone. A breakout with follow-through would validate bullish continuation, and dips back toward the breakout zone could serve as a retest for new longs. Risk management remains key, with invalidation below recent swing lows around 1.8200. The setup aligns with trendline breakout strategies and could provide favorable risk-to-reward potential for buyers.
Overall, GBPCAD is setting up for a possible bullish reversal after weeks of steady downside. With technical structure aligning and fundamentals supporting GBP strength over CAD, this pair may offer a clean breakout play. Momentum traders should stay alert for confirmation signals and position accordingly to ride the next potential leg up.

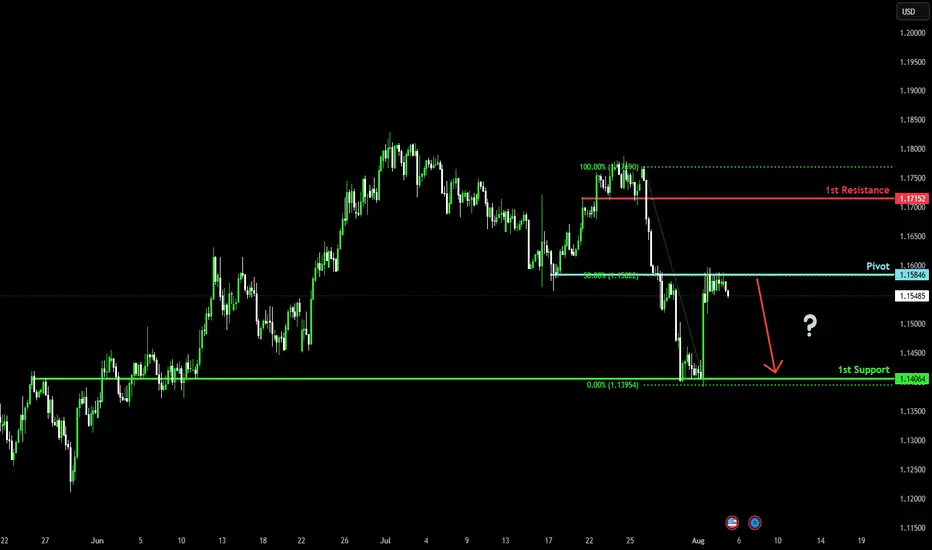
Bearish drop off pullback resistance?The price has rejected off the pivot, which has been identified as a pullback resistance that lines up with the 50% Fibonacci retracement and could drop to the 1st support.
Pivot: 1.1584
1st Support: 1.1406
1st Resistance: 1.1715
Risk Warning:
Trading Forex and CFDs carries a high level of risk to your capital and you should only trade with money you can afford to lose. Trading Forex and CFDs may not be suitable for all investors, so please ensure that you fully understand the risks involved and seek independent advice if necessary.
Disclaimer:
The above opinions given constitute general market commentary, and do not constitute the opinion or advice of IC Markets or any form of personal or investment advice.
Any opinions, news, research, analyses, prices, other information, or links to third-party sites contained on this website are provided on an "as-is" basis, are intended only to be informative, is not an advice nor a recommendation, nor research, or a record of our trading prices, or an offer of, or solicitation for a transaction in any financial instrument and thus should not be treated as such. The information provided does not involve any specific investment objectives, financial situation and needs of any specific person who may receive it. Please be aware, that past performance is not a reliable indicator of future performance and/or results. Past Performance or Forward-looking scenarios based upon the reasonable beliefs of the third-party provider are not a guarantee of future performance. Actual results may differ materially from those anticipated in forward-looking or past performance statements. IC Markets makes no representation or warranty and assumes no liability as to the accuracy or completeness of the information provided, nor any loss arising from any investment based on a recommendation, forecast or any information supplied by any third-party.
Bearish revrsal?The Ethereum (ETH/USD) is rising towards the pivot and could reverse to the 1st support.
Pivot: 3,760.94
1st Suport: 3,372.83
1st Resistance: 3,936.31
Risk Warning:
Trading Forex and CFDs carries a high level of risk to your capital and you should only trade with money you can afford to lose. Trading Forex and CFDs may not be suitable for all investors, so please ensure that you fully understand the risks involved and seek independent advice if necessary.
Disclaimer:
The above opinions given constitute general market commentary, and do not constitute the opinion or advice of IC Markets or any form of personal or investment advice.
Any opinions, news, research, analyses, prices, other information, or links to third-party sites contained on this website are provided on an "as-is" basis, are intended only to be informative, is not an advice nor a recommendation, nor research, or a record of our trading prices, or an offer of, or solicitation for a transaction in any financial instrument and thus should not be treated as such. The information provided does not involve any specific investment objectives, financial situation and needs of any specific person who may receive it. Please be aware, that past performance is not a reliable indicator of future performance and/or results. Past Performance or Forward-looking scenarios based upon the reasonable beliefs of the third-party provider are not a guarantee of future performance. Actual results may differ materially from those anticipated in forward-looking or past performance statements. IC Markets makes no representation or warranty and assumes no liability as to the accuracy or completeness of the information provided, nor any loss arising from any investment based on a recommendation, forecast or any information supplied by any third-party.

FUNUSDT Forming Bullish ReversalFUNUSDT is showing strong signs of a potential bullish reversal after a healthy correction phase. The price has now landed back into a historically strong support zone that previously acted as resistance. This zone, clearly marked on the chart, is being respected again, which could mark the beginning of a powerful upward move. The technical setup aligns well with a classic demand zone bounce, a favorite among swing traders and breakout investors.
The current market conditions are ripe for a potential 100%+ move, with a projected upside target near \$0.025 as shown on the chart. This bullish thesis is backed by sustained trading volume, suggesting continued investor interest. FUN (FunFair) has a history of explosive price action after accumulation phases, and this setup mirrors past patterns that led to significant rallies.
Fundamentally, FunFair has long served as a blockchain-based gaming and entertainment platform, and its role in the evolving crypto ecosystem keeps it on the radar of both speculative and long-term investors. The sharp retracement to a key level, followed by potential upward momentum, makes FUNUSDT an attractive high-reward opportunity for aggressive buyers aiming to capitalize on early entries.
With a clean chart structure, attractive risk-reward ratio, and visible interest from traders, FUNUSDT is positioned for a potential breakout. This could be one of the more lucrative mid-cap plays on the altcoin radar right now.
✅ Show your support by hitting the like button and
✅ Leaving a comment below! (What is You opinion about this Coin)
Your feedback and engagement keep me inspired to share more insightful market analysis with you!

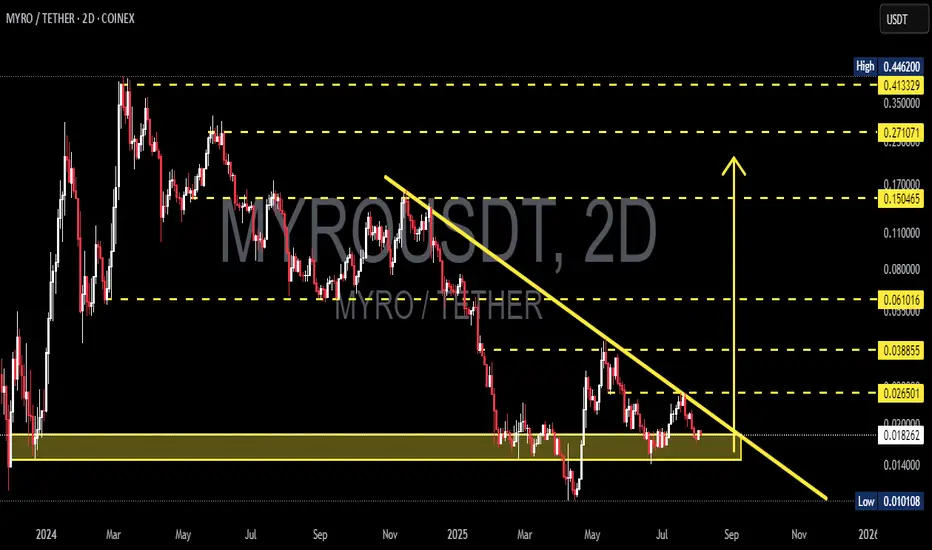
MYRO/USDT Testing Key Support – Breakout or Breakdown?📊 Complete and Relevant Chart Analysis:
The MYRO/USDT pair is currently in a consolidation phase after experiencing a medium-term downtrend. Several key technical elements can be observed in this chart:
---
🟡 Support Zone (Demand Area):
Price is now sitting at a strong support zone (yellow box), ranging around $0.014 – $0.018, which has been tested multiple times throughout 2024–2025.
This zone serves as a potential accumulation base and could act as a springboard for a reversal.
---
📉 Descending Trendline Resistance:
A dominant descending trendline from the November 2024 high continues to suppress the price.
The price has yet to break above this trendline, indicating sellers are still in control on the medium-term timeframe.
---
📈 Key Resistance Levels:
Based on previous structure and potential retracement targets:
$0.026501
$0.038855
$0.061016
$0.150465
$0.271071
---
📉 Nearest Support Levels:
$0.018287 (current price)
If price breaks down below this zone, it may drop toward $0.014000 or even $0.010108 (all-time low)
---
🧠 Pattern & Structure:
A clear Descending Triangle pattern is forming, typically a bearish continuation. However, as price nears the apex and holds the support zone, this could also signal a potential reversal setup.
Volume confirmation will be crucial if a breakout occurs.
---
🚀 Bullish Scenario:
1. Price bounces off the strong support zone and successfully breaks the descending trendline with solid volume.
2. Targets on the upside include:
$0.0265 (minor resistance)
$0.0388
$0.0610 (psychological and technical level)
---
🔻 Bearish Scenario:
1. If price fails to hold above $0.018 and breaks down from the yellow support box:
A drop toward $0.0140 is likely, with potential extension to $0.0101.
2. Increasing selling pressure and low volume on the bounce would strengthen this bearish outlook.
---
🎯 Conclusion:
MYRO/USDT is at a critical juncture, testing a major support level and nearing the end of a descending triangle. The next movement will determine whether we see a bullish breakout or a continuation of the bearish trend.
#MYROUSDT #CryptoAnalysis #AltcoinSetup #SupportResistance #BreakoutTrade #DescendingTriangle #TechnicalAnalysis #CryptoSupport #ReversalPattern #CryptoTrading
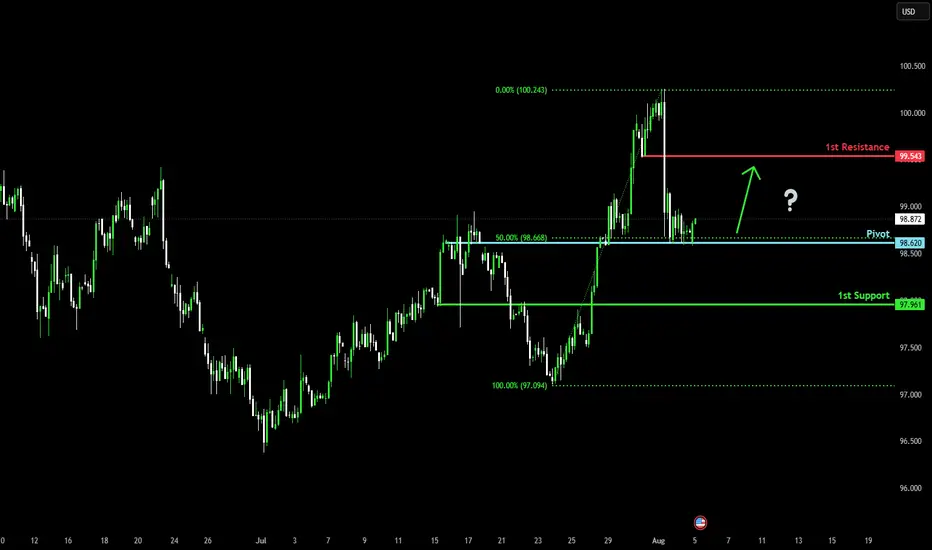
Bullish bounce off 50% Fibonacci support?US Dollar Index (DXY) is reacting off the pivot, which acts as a pullback support and could bounce to the 1st resistance.
Pivot: 98.62
1st Support: 97.96
1st Resistance: 99.54
Risk Warning:
Trading Forex and CFDs carries a high level of risk to your capital and you should only trade with money you can afford to lose. Trading Forex and CFDs may not be suitable for all investors, so please ensure that you fully understand the risks involved and seek independent advice if necessary.
Disclaimer:
The above opinions given constitute general market commentary, and do not constitute the opinion or advice of IC Markets or any form of personal or investment advice.
Any opinions, news, research, analyses, prices, other information, or links to third-party sites contained on this website are provided on an "as-is" basis, are intended only to be informative, is not an advice nor a recommendation, nor research, or a record of our trading prices, or an offer of, or solicitation for a transaction in any financial instrument and thus should not be treated as such. The information provided does not involve any specific investment objectives, financial situation and needs of any specific person who may receive it. Please be aware, that past performance is not a reliable indicator of future performance and/or results. Past Performance or Forward-looking scenarios based upon the reasonable beliefs of the third-party provider are not a guarantee of future performance. Actual results may differ materially from those anticipated in forward-looking or past performance statements. IC Markets makes no representation or warranty and assumes no liability as to the accuracy or completeness of the information provided, nor any loss arising from any investment based on a recommendation, forecast or any information supplied by any third-party.
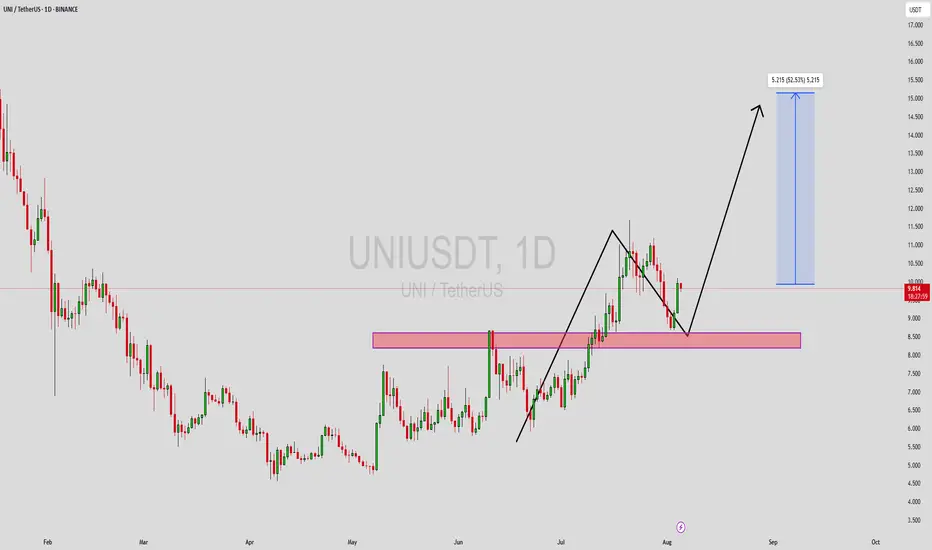
UNIUSDT Forming Bullish ContinuationUNIUSDT is currently presenting a compelling bullish continuation setup, as evidenced by the recent price action retesting a major support zone that previously acted as strong resistance. This key area, highlighted on the chart, has flipped to support—indicating a potential launchpad for the next impulsive move. The price has respected this zone and is already showing signs of a rebound, which may lead to a fresh leg upward in the near term.
The chart analysis points to a potential 52%+ gain from current levels, with a clear projection toward the $15.00 mark. The current pullback appears healthy within an overall bullish structure. UNI's steady volume during this phase further validates investor confidence, supporting the potential for a strong recovery rally. Technical traders often look for such clean price action following a breakout and successful retest of critical levels.
Fundamentally, UNI (Uniswap) remains one of the leading decentralized exchange protocols, and its continued development in DeFi space keeps it highly relevant. The market seems to be recognizing this with renewed buying interest. If current market sentiment remains bullish and broader conditions support altcoin growth, UNI could reach its projected upside in a relatively short timeframe.
With a strong technical setup, supportive volume, and renewed investor attention, UNIUSDT is shaping up to be a promising trade idea for mid-term swing traders and investors.
✅ Show your support by hitting the like button and
✅ Leaving a comment below! (What is You opinion about this Coin)
Your feedback and engagement keep me inspired to share more insightful market analysis with you!
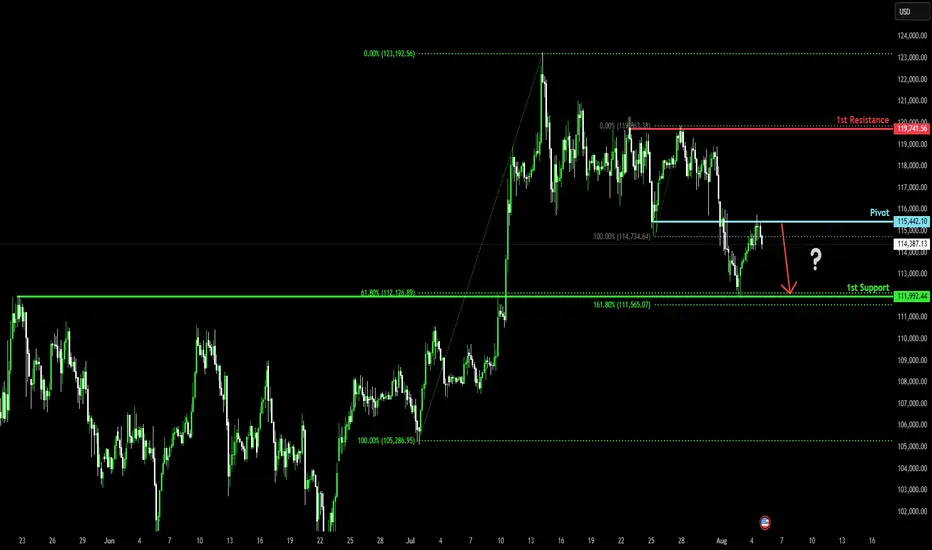
Bearish drop?Bitcoin (BTC/USD) has rejected off the pivot and could drop to the 1st support, which aligns with the 61.8% Fibonacci retracement.
Pivot: 115,442.10
1st Support: 111,992.44
1st Resistance: 119,741.56
Risk Warning:
Trading Forex and CFDs carries a high level of risk to your capital and you should only trade with money you can afford to lose. Trading Forex and CFDs may not be suitable for all investors, so please ensure that you fully understand the risks involved and seek independent advice if necessary.
Disclaimer:
The above opinions given constitute general market commentary, and do not constitute the opinion or advice of IC Markets or any form of personal or investment advice.
Any opinions, news, research, analyses, prices, other information, or links to third-party sites contained on this website are provided on an "as-is" basis, are intended only to be informative, is not an advice nor a recommendation, nor research, or a record of our trading prices, or an offer of, or solicitation for a transaction in any financial instrument and thus should not be treated as such. The information provided does not involve any specific investment objectives, financial situation and needs of any specific person who may receive it. Please be aware, that past performance is not a reliable indicator of future performance and/or results. Past Performance or Forward-looking scenarios based upon the reasonable beliefs of the third-party provider are not a guarantee of future performance. Actual results may differ materially from those anticipated in forward-looking or past performance statements. IC Markets makes no representation or warranty and assumes no liability as to the accuracy or completeness of the information provided, nor any loss arising from any investment based on a recommendation, forecast or any information supplied by any third-party.
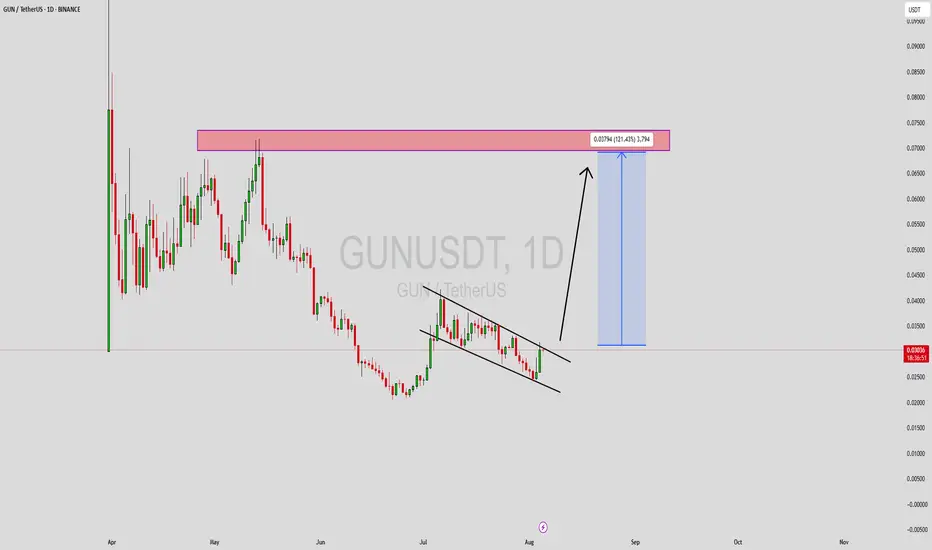
GUNUSDT Forming Descending ChannelGUNUSDT is forming a Descending Wedge Pattern, which is a strong bullish signal often seen before major upward breakouts. This pattern typically signifies decreasing selling pressure and builds up buying momentum. As the price moves closer to the apex of the wedge, a breakout becomes increasingly likely. In the case of GUNUSDT, this setup is showing strong potential for a sharp price reversal, particularly with volume backing the move.
The volume analysis on GUNUSDT supports this bullish scenario. Consistent and increasing buy-side interest in recent sessions suggests accumulation by smart money ahead of a potential breakout. When price action aligns with strong volume behavior in a descending wedge, it often results in an explosive rally. Based on the pattern structure and current trend dynamics, a projected gain of 90% to 100%+ is highly plausible once the breakout is confirmed.
GUN is also gaining traction due to its unique use case and increasing community involvement. As interest continues to grow in niche sectors of crypto, coins like GUN that are backed by strong fundamentals and community support tend to outperform during bullish phases. This project is now on the radar of technical traders and investors looking for breakout plays.
With a technically sound formation and bullish sentiment building across the market, GUNUSDT presents a high-reward setup. Watching closely for confirmation of a breakout could offer a timely entry into what may be a powerful upside move.
✅ Show your support by hitting the like button and
✅ Leaving a comment below! (What is You opinion about this Coin)
Your feedback and engagement keep me inspired to share more insightful market analysis with you!