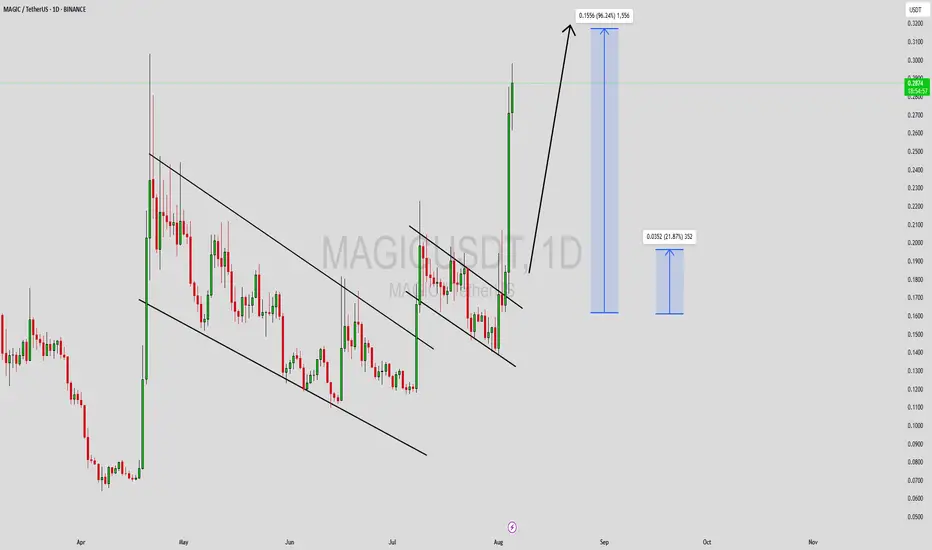
MAGICUSDT Forming Falling WedgeMAGICUSDT is currently forming a classic Falling Wedge Pattern, a bullish reversal setup that often indicates a trend shift from bearish to bullish. This pattern is characterized by converging trendlines that slope downward, with declining volume throughout its formation—a sign that selling pressure is gradually decreasing. The breakout from this structure is typically explosive, making this setup highly attractive to traders looking for high-reward opportunities.
Volume on MAGICUSDT remains strong, a vital confirmation for the validity of the wedge pattern. Sustained buying volume after a breakout often signals the beginning of a substantial rally. As of now, MAGIC appears poised to challenge resistance levels, and if the breakout occurs, we could see a price surge of 90% to 100% or more, aligning with historical wedge breakouts in crypto markets.
The broader sentiment around the MAGIC ecosystem is also showing positive momentum. As a key player in the decentralized gaming and NFT infrastructure space, MAGIC has consistently drawn attention from investors who believe in the long-term potential of Web3 gaming. Its integration with various metaverse projects and innovative use cases continues to attract both developers and traders.
This combination of bullish technical structure, growing trading interest, and strong fundamentals makes MAGICUSDT one of the more promising setups in the current market cycle. Keep an eye on key breakout levels, as the next leg up could come with swift and significant price movement.
✅ Show your support by hitting the like button and
✅ Leaving a comment below! (What is You opinion about this Coin)
Your feedback and engagement keep me inspired to share more insightful market analysis with you!
Harmonic Patterns
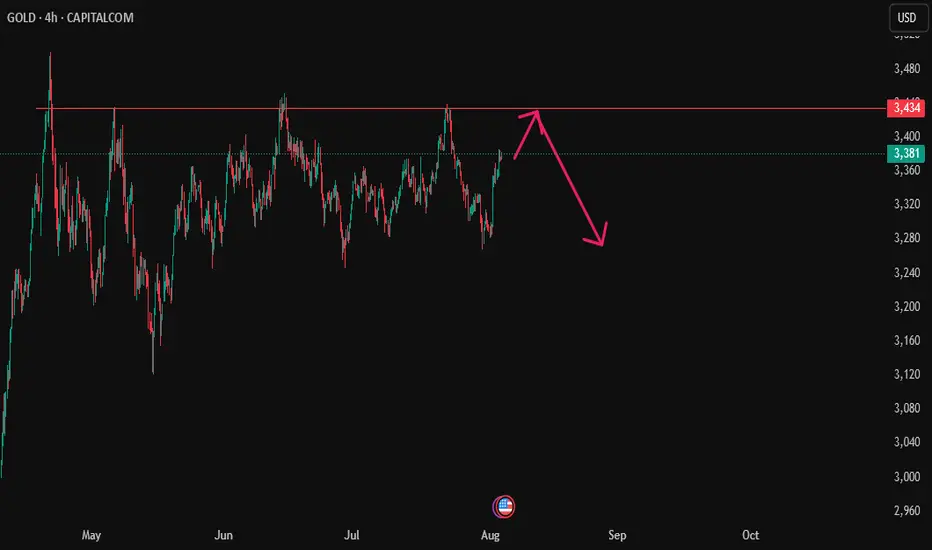
Gold's Next Move? Eyes on the Liquidity Trap Below!Gold has created internal liquidity during the New York session and is now moving downward. There is liquidity resting below the recent swing lows, and beneath that lie bullish Pending Demand (PD) arrays. If the market takes out this liquidity, we can then look for bullish confirmations from the PD arrays for potential buy opportunities.
Do Your Own Research (DYOR).

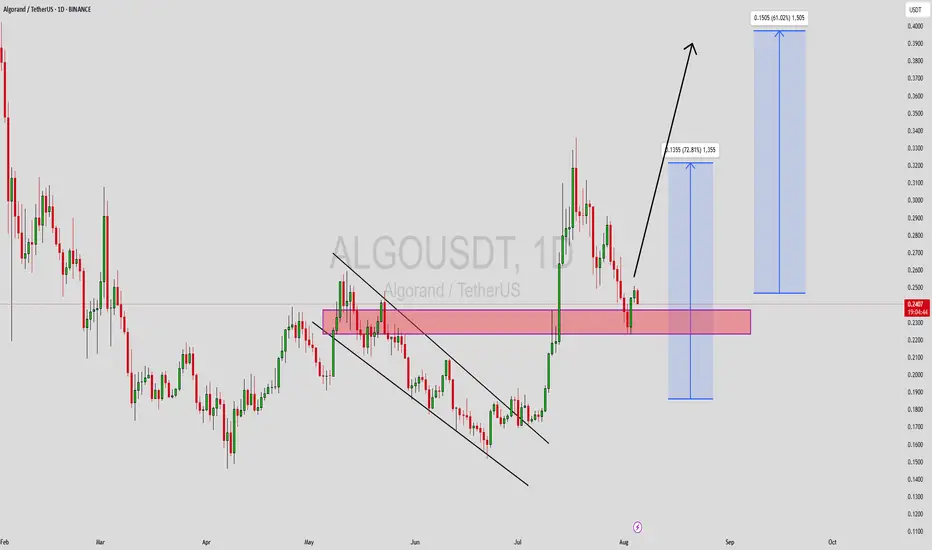
ALGOUSDT Forming Bullish WaveALGOUSDT is currently demonstrating a Bullish Wave Pattern, a strong technical signal that often precedes a significant upward price movement. This pattern typically forms in trending markets, suggesting a series of higher highs and higher lows that indicate sustained buying interest. With this wave structure unfolding, the market appears to be favoring a continuation of the current uptrend, making ALGO an appealing candidate for mid-term gains.
The volume profile is showing a steady increase, which supports the pattern’s validity and hints at rising momentum. A strong volume base during the formation of bullish wave patterns is often an early indication of institutional accumulation or renewed retail participation. With key support levels holding firm and resistance levels gradually weakening, the setup points to a potential price surge of 50% to 60% or more if bullish momentum continues.
Algorand’s fundamentals are also contributing to growing investor interest. Known for its scalable blockchain technology and low transaction fees, ALGO has seen increasing adoption in DeFi and enterprise-level blockchain solutions. This growing utility, combined with the current bullish technical setup, enhances the coin’s attractiveness for both swing traders and long-term holders.
In summary, ALGOUSDT’s bullish wave pattern coupled with rising volume and positive sentiment could signal the start of a powerful upward move. Traders should keep an eye on breakout zones and confirmation candles to capitalize on this emerging opportunity.
✅ Show your support by hitting the like button and
✅ Leaving a comment below! (What is You opinion about this Coin)
Your feedback and engagement keep me inspired to share more insightful market analysis with you!
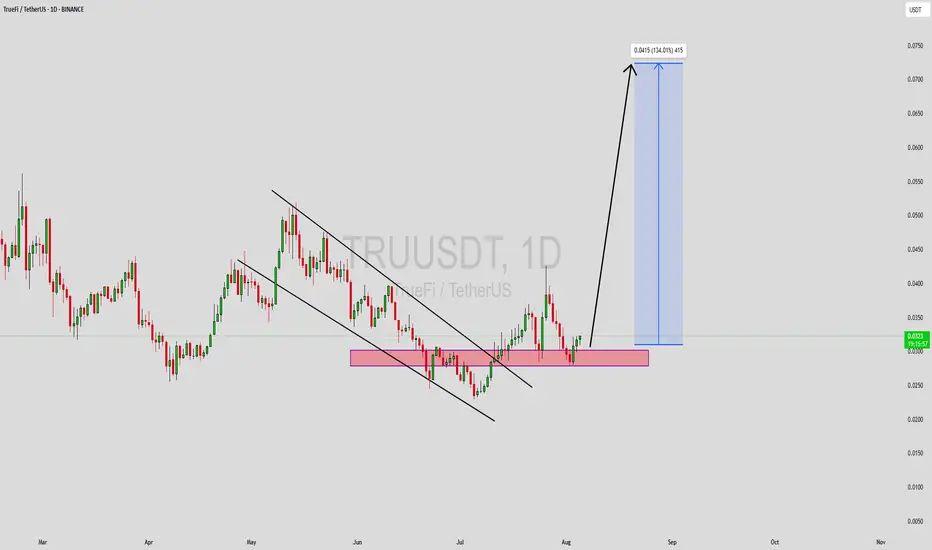
TRUUSDT Forming Falling WedgeTRUUSDT is currently exhibiting a Falling Wedge Pattern, a well-known bullish formation that often signals the end of a downtrend and the beginning of a strong upward move. This pattern is characterized by descending trendlines that converge, showing reduced selling pressure and a potential shift in momentum. As TRU approaches the apex of this wedge with gradually narrowing price action, traders are closely watching for a breakout to the upside—typically a powerful signal that price could rally sharply from current levels.
Volume remains healthy, which is a crucial factor when validating any breakout from a wedge formation. An uptick in volume upon breakout would serve as strong confirmation of bullish intent and increase the probability of TRUUSDT reaching its projected target. Historical breakouts from similar patterns have shown explosive gains, and in this case, the setup suggests a potential gain of 90% to 100% or more, especially if supported by broader market strength.
Investor interest is steadily increasing in the TRU ecosystem, reflecting growing confidence in the project’s utility and future developments. As the token gains traction and technical indicators align in its favor, momentum traders and swing traders are identifying this as a high-potential opportunity. The structure of this wedge presents a low-risk, high-reward setup with clearly defined support and resistance levels.
In summary, TRUUSDT’s falling wedge breakout scenario could be one of the more promising bullish setups currently unfolding. With strong volume dynamics, positive sentiment, and a clear pattern in play, it’s an excellent chart to keep on your radar in the coming days.
✅ Show your support by hitting the like button and
✅ Leaving a comment below! (What is You opinion about this Coin)
Your feedback and engagement keep me inspired to share more insightful market analysis with you!
Long SPXSPX looking interesting to me but I have already put a limit on Pengu. A pair I have been watching since yesterday, Looking for an entry on a retracement. Similar structure as SPX, to avoid over exposure, Let me paper trade SPX
USD/JPY Bearish Setup - Breakout from Ascending ChannelUSD/JPY Bearish Setup – Breakout from Ascending Channel
Price action on USD/JPY has broken down from an ascending channel, signaling potential bearish momentum ahead. The breakdown suggests a possible continuation toward lower support levels.
1st Support Level: 144.800 – 144.200
2nd Support Level: 143.000 – 142.400
Watch for price consolidation or retests at the 1st support level. A clean break below this zone could open the path toward the 2nd support level.
Key Notes:
Bearish volume increase post-breakout
Ichimoku cloud starting to thin, showing weakening bullish momentum
Structure favors selling rallies below the channel
📉 Bias: Bearish
💡 Plan: Wait for confirmation on lower timeframes before entering short positions

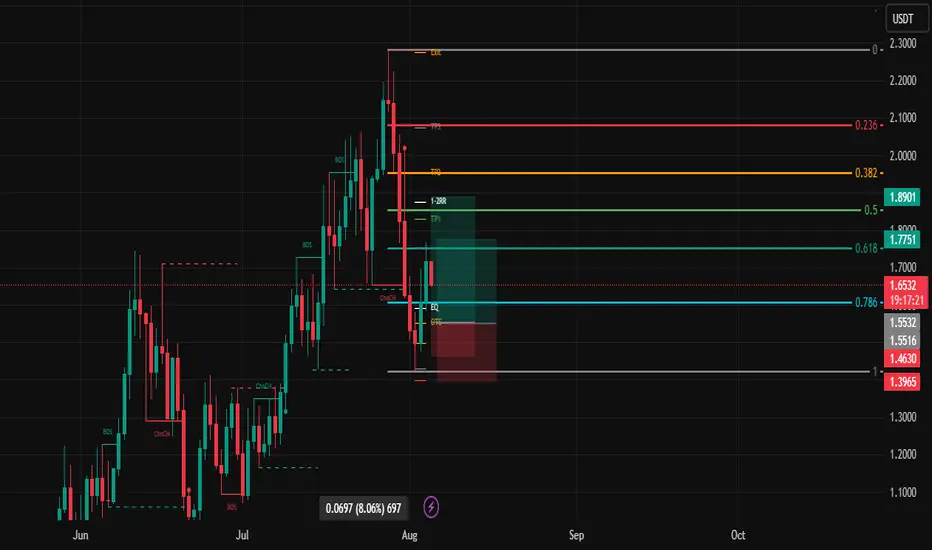
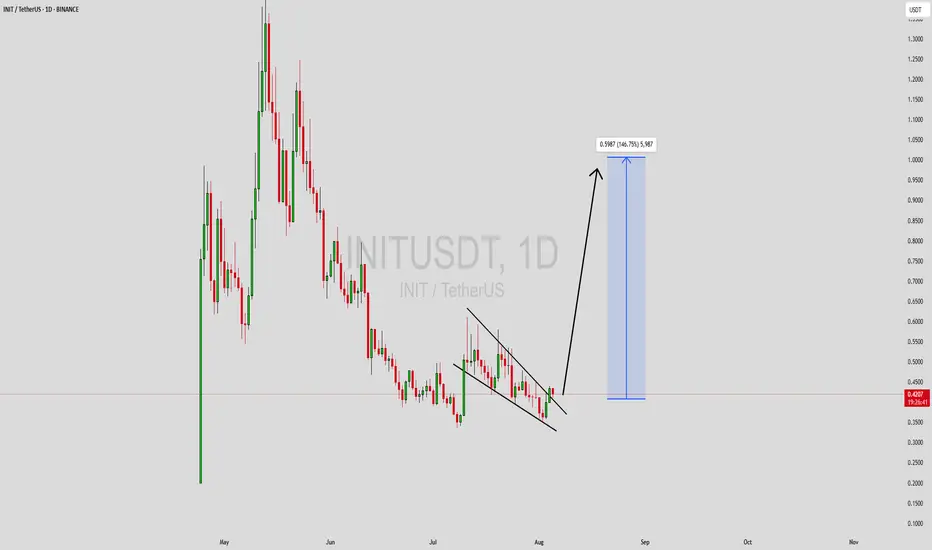
INITUSDT Forming Falling WedgeINITUSDT is showing signs of a classic Falling Wedge Pattern, a bullish chart formation that typically indicates a strong reversal or continuation to the upside. This pattern occurs when price action narrows within a descending range, creating lower highs and lower lows while momentum starts to fade. Once price begins to break out of the wedge with volume confirmation, it often sparks significant upward momentum. The current technical structure of INITUSDT suggests an imminent breakout, with the potential to generate gains between 90% to 100% based on historical wedge breakouts and price projection targets.
Volume for INITUSDT has been consistent and notably supportive, which adds weight to the bullish case. A breakout from a falling wedge pattern on increasing volume typically validates the strength of the move. This surge in volume indicates growing interest and accumulation by market participants who are positioning early for the expected rally. As the pattern tightens and nears its apex, any breakout candle should be watched closely for entry signals.
Investor sentiment around INIT is also turning positive, with attention picking up due to the coin’s underlying potential and recent developments in its ecosystem. Technical traders and crypto enthusiasts alike are keeping a close watch on INITUSDT as it sets up for a major move. Such high-probability bullish setups are rare and offer lucrative risk-reward ratios, especially when backed by both price action and market activity.
This setup reflects a confluence of favorable technical indicators and growing investor interest, making INITUSDT one of the more attractive bullish opportunities on the market right now. Traders should prepare for confirmation and watch resistance levels closely for a potential explosive move upward.
✅ Show your support by hitting the like button and
✅ Leaving a comment below! (What is You opinion about this Coin)
Your feedback and engagement keep me inspired to share more insightful market analysis with you!
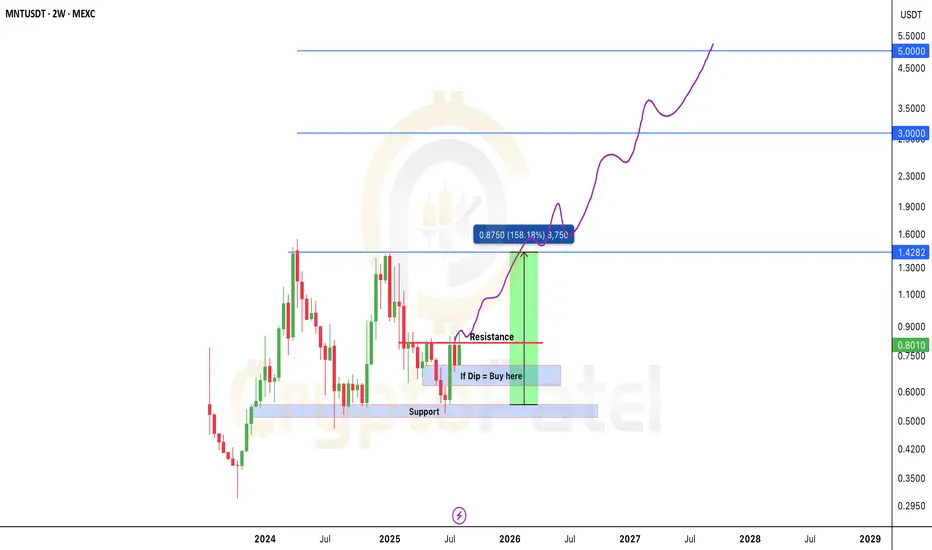
Will MNT/USDT 5x to 10x Potential Post BreakoutTSX:MNT Forming Bullish Structure – 5x to 10x Potential Post Breakout
#MNT is currently trading very close to a major resistance level at $0.82.
We’re waiting for a clean breakout above this zone. Once confirmed, price can potentially deliver a 5x–10x move in the coming days.
If price retraces, the best long-term entry zone would be around $0.70–$0.60 — right inside the accumulation box.
This bull run has strong structural support around $0.55–$0.50. As long as we stay above this zone, we remain highly confident in the upside move toward $5.
Key levels to watch:
Accumulation Zone: $0.60 – $0.70
Resistance: $0.82
Support: $0.50 – $0.55
Bull Run Targets: $1.42 / $3 / $5
NFA & DYOR
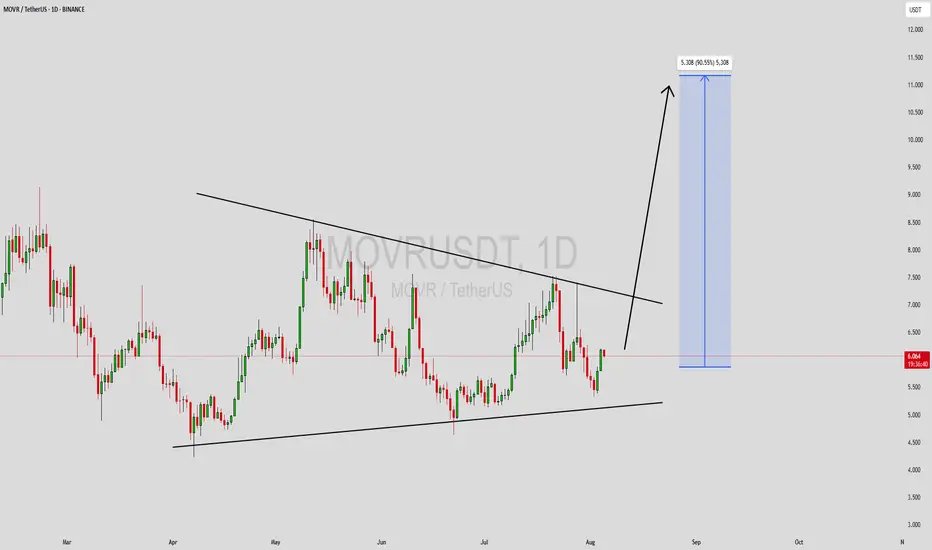
MOVRUSDT Forming Descending ChannelMOVRUSDT is currently trading within a Descending Channel Pattern, a formation that typically precedes a strong breakout to the upside once the downward pressure begins to fade. This pattern indicates a period of consolidation where lower highs and lower lows are formed in a controlled channel, often signaling that selling momentum is weakening. As price approaches the lower bound and shows signs of strength, traders often anticipate a bullish breakout. With MOVR showing strong support at current levels, this could be the early signs of a reversal.
The volume backing this structure is encouraging, reflecting accumulation behavior—where informed investors begin positioning ahead of a potential trend change. When descending channel breakouts occur with solid volume confirmation, they tend to result in rapid and extended moves. Based on the current chart structure, the expected upside potential is in the range of 80% to 90%, offering a compelling risk-to-reward setup for both swing and medium-term traders.
Investor interest around MOVRUSDT has been gradually increasing, driven by renewed attention to its underlying ecosystem and growing traction among crypto communities. The project’s fundamentals and continued development have kept it on the radar of market watchers. In a bullish market environment, assets like MOVR—trading near structural support and within a clear reversal pattern—often attract sharp inflows, accelerating their breakout trajectory.
This is a prime opportunity for those seeking breakout setups. MOVRUSDT combines a favorable technical pattern with strong volume and growing investor sentiment, making it a high-potential candidate for the next leg up. Monitor closely for breakout confirmation to capitalize on the projected upside move.
✅ Show your support by hitting the like button and
✅ Leaving a comment below! (What is You opinion about this Coin)
Your feedback and engagement keep me inspired to share more insightful market analysis with you!
SXTUSDT Forming Descending ChannelSXTUSDT is currently exhibiting a Descending Channel Pattern, a classic bullish reversal signal when spotted in a well-defined downtrend. This pattern suggests a temporary consolidation phase where price consistently makes lower highs and lower lows within a parallel channel. However, as the price approaches the lower boundary of the channel and begins to show signs of reversal, it indicates growing bullish momentum that could soon lead to a breakout to the upside.
The volume profile is supporting this technical structure, with gradual accumulation taking place at the lower levels of the channel. This is often a sign that smart money is positioning before a potential breakout. Historically, breakouts from descending channels are followed by rapid upward movement, especially when accompanied by a volume spike. With SXTUSDT, a confirmed breakout could easily trigger a bullish wave toward the projected 140% to 150%+ gain zone, aligning with current market trends favoring high-reward altcoin setups.
Investor sentiment is improving as SXT gains traction among retail and institutional traders. The token is currently trading at a discount relative to its previous highs, making it a compelling opportunity for swing traders and medium-term investors. The descending channel breakout scenario could also be amplified by broader bullish market conditions or news catalysts that push the sentiment further in SXT’s favor.
This setup is one to watch closely. With strong technical alignment, a bullish pattern, and increasing interest across social platforms, SXTUSDT is primed for a major breakout. Traders looking for a well-structured, high-upside trade should keep this pair on their radar.
✅ Show your support by hitting the like button and
✅ Leaving a comment below! (What is You opinion about this Coin)
Your feedback and engagement keep me inspired to share more insightful market analysis with you!

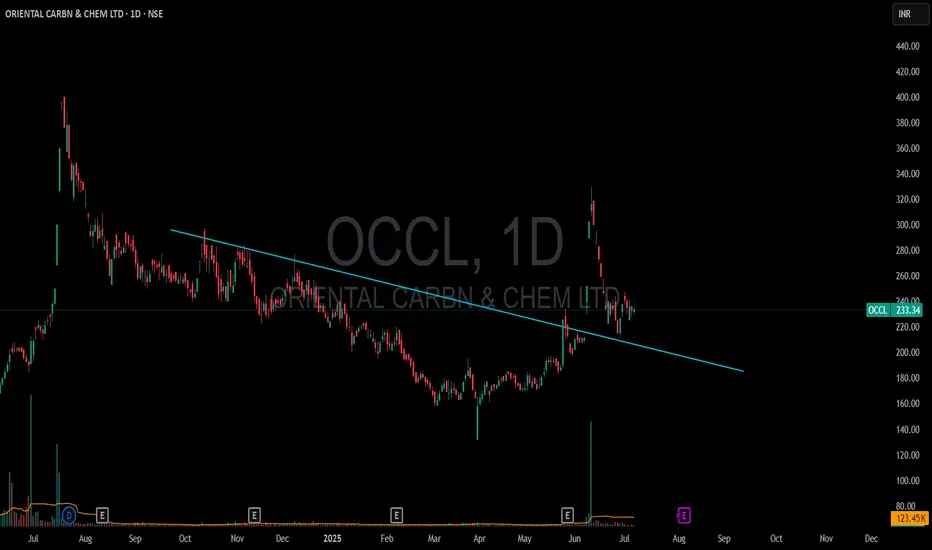
OCCL 1DAY✅ Technical Summary:
🟢 Current Price: ₹233 (as per your update)
🔹 Resistance Breakout:
strong resistance has been broken – this is very bullish.
A retest phase usually confirms breakout strength. If it's holding the previous resistance as new support (like ₹220–₹230 zone), it gives high-probability entry opportunity.
🔹 Next Logical Target: ₹300
A move from ₹230 to ₹300 is ~30% upside.
This kind of move is likely if:
Volume supports the breakout (increased volumes on breakout day).
No negative divergences on RSI.
Broader market sentiment supports small/mid-cap movement.
Disclaimer: The information provided is for educational and informational purposes only and should not be considered as financial advice. Investing in the stock market involves risk, and past performance is not indicative of future results. Please consult with a certified financial advisor or conduct your own research before making any investment decisions. We are not responsible for any losses incurred as a result of using this information. Stock market investments are subject to market risks; read all related documents carefully.

BTC ~ will it make new lows!?Ideally its following the pattern i drew, and latter after NY session, it would claim the lows ideally after the buying activity I am antiiipating now!

PNUT/USDT – On the Edge of Rebound or Breakdown?📌 Overview:
PNUT/USDT is currently at a major inflection point, following a prolonged downtrend and months of consolidation. The price is once again testing the key demand zone that has acted as a solid support since February 2025. Will this be the beginning of a strong bullish reversal, or the start of a deeper breakdown?
---
🧠 Price Action & Market Structure:
Since peaking around $2.50, PNUT has undergone a sharp decline, now hovering near the critical support area of $0.21–$0.23.
This zone has repeatedly acted as a historical accumulation zone, providing strong bounce reactions in the past.
A potential double bottom pattern is forming – if confirmed, it could ignite a bullish trend.
Multiple resistance levels lie ahead, creating a clear roadmap for staged recovery if momentum shifts.
---
🔼 📈 Bullish Scenario – Potential Reversal in Sight:
If the support holds and bullish structure forms (e.g., bullish engulfing, morning star, or higher high breakout), we could see:
1. A strong rebound from the demand zone ($0.21–$0.23), signaling buyer strength.
2. Upside targets:
$0.3027 (initial resistance and trend reversal confirmation)
$0.4403
$0.5951 (strong historical resistance)
$0.7674 to $1.0797 (major psychological zones)
3. A breakout with strong volume and MA crossover (if used) would further validate the trend change.
---
🔽 📉 Bearish Scenario – Breakdown Risk:
If the support zone fails and price breaks below $0.21, the bearish trend could continue:
1. A clear breakdown below the demand zone opens room to:
$0.1700 (minor support)
$0.1300
$0.1000 (historical low and key psychological level)
2. This would invalidate the potential reversal and reinforce the broader distribution phase.
---
📊 Identified Patterns:
Range-Bound / Accumulation Phase: Price has moved sideways between $0.21–$0.44 since February, suggesting accumulation by long-term players.
Potential Double Bottom: Still forming – confirmation needed via a breakout of the neckline.
Descending Trendline Resistance: Remains overhead and may act as a strong barrier if price attempts to climb.
---
🧭 Key Things Traders Should Watch:
Monitor price reaction in the current demand zone over the next few candles.
Look for volume confirmation on any breakout.
Stay aware of Bitcoin’s trend and macro sentiment, as it may influence volatility in altcoins like PNUT.
---
📝 Conclusion:
PNUT/USDT is now trading at a crucial technical level. The price reaction here will determine the mid- to long-term direction of this asset. Traders should prepare for either a strong reversal or a significant breakdown. This area offers a strategic opportunity to assess both risk and reward potential.
#PNUTUSDT #CryptoBreakout #TechnicalAnalysis #AltcoinSetup #CryptoReversal #PriceAction #SupportAndResistance #CryptoUpdate #BullishVsBearish

FTSE SHORTThere is an ABCD pattern on M30
All timeframes are overbought on RSI
There are multiple tops on all timeframes with divergence
Great resistance at this level
Stoploss above 9200

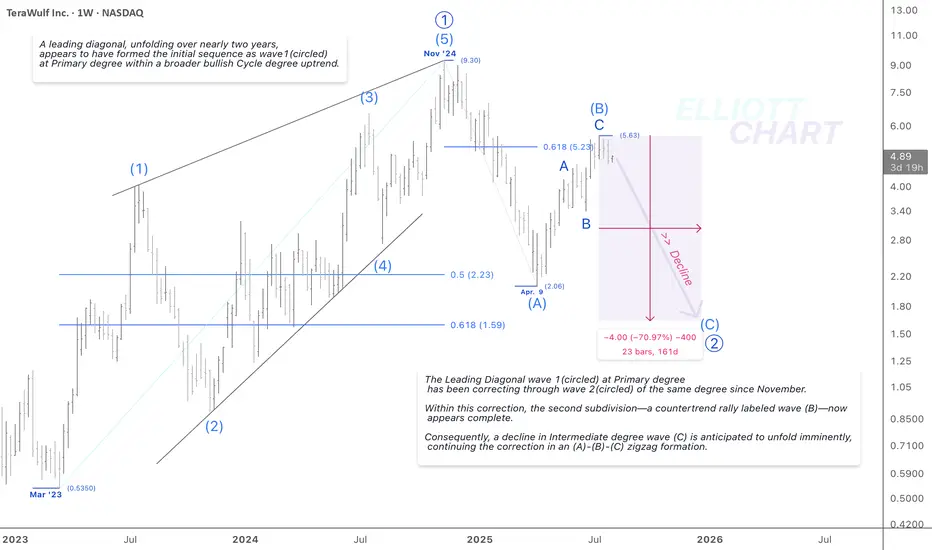
WULF / WeeklyAs illustrated on the weekly chart of NASDAQ:WULF , the entire advance since March 2023 appears to have unfolded as a Leading Diagonal, forming a bullish pattern over nearly two years.
This structure likely represents wave 1(circled) at the Primary degree, marking the initial sequence within a broader Cycle degree uptrend.
The Leading Diagonal wave 2(circled) has been undergoing a correction through wave 2(circled) of the same degree since November.
Within this corrective phase, the second subdivision—a countertrend rally labeled wave (B)—has extended beyond the 0.618 Fibonacci retracement level as anticipated and now appears to be a completed corrective structure.
Consequently, a decline of up to 70% is anticipated in the Intermediate degree wave (C), continuing the overall correction in a (A)-(B)-(C) Zigzag formation. It potentially extends through the remainder of the year.
Trend Analysis >> Under this weekly alternative, the medium-term trend is expected to turn lower very soon. However, the Leading Diagonal, identified as the first wave at the Primary degree, aligns with a broader long-term bullish structure, reinforcing the strength of the prevailing Cycle degree uptrend.
NASDAQ:WULF CRYPTOCAP:BTC BITSTAMP:BTCUSD MARKETSCOM:BITCOIN
#CryptoStocks #WULF #BTCMining #Bitcoin #BTC
XAUUSD breaks out – bullish bias returnsGold has bounced from the bottom of the descending channel, initiating a clear upward move with a series of strong bullish candles. On the H2 chart, price has broken above the upper boundary of the medium-term downtrend channel and filled the nearest fair value gap, signaling a resurgence in buying pressure.
Current price action is approaching a previous resistance zone, aligned with recent swing highs. The chart suggests a potential consolidation before further upside, provided that the current bullish structure remains intact.
From a macro perspective, while the stronger-than-expected U.S. PMI data supports the USD in the short term, weak labor market figures and ongoing global geopolitical tensions continue to fuel demand for gold as a safe-haven asset. This environment is helping sustain XAUUSD’s current recovery structure.

BTC - About to TankBitcoin is holding below these bearish trendlines pointed out on previous posts.
Here we can see liquidation levels on the HTF.
I see two potential moves:
Scenario A)
115,000 to 17,000-20,000 range
Scenario B)
3 Wave Corrective Pattern
115,000 to 35,000
35,000 to 83,000
83,000 to 8,000-10,000
DXY is retesting a major bearish breakdown on the weekly / monthly time frame. This is why we have been seeing the recent drop, and preparation for a mass liquidation / flash crash.
The above stated is my own personal views and is not intended as financial advice. Please trade responsibly.

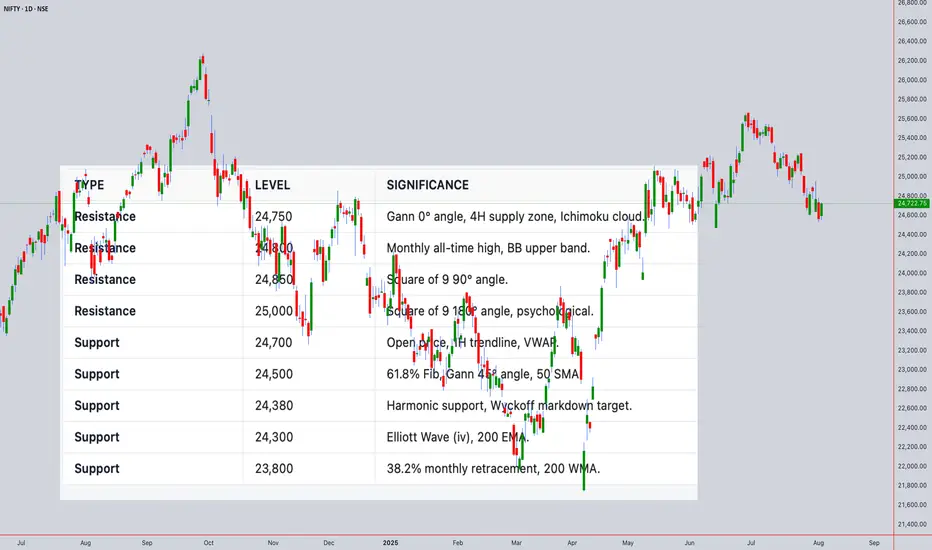
NIFTY50 Closing Price: ₹24,722.75 (4th Aug 2025, 02:00PM UTC+4)Comprehensive Technical Analysis for NIFTY50
world wide web shunya trade
Closing Price: ₹24,722.75 (4th Aug 2025, 02:00PM UTC+4)
Time Frames:
Intraday: 5M, 15M, 30M, 1H, 4H
Swing: 4H, Daily, Weekly, Monthly
1. Japanese Candlestick Analysis
Intraday (5M-4H)
4H: Bearish Engulfing at 24,722.75 signals rejection of highs.
1H: Dark Cloud Cover below 24,750 confirms weakness.
30M/15M: Shooting Stars at 24,720 indicate exhaustion.
5M: Three Black Crows pattern suggests strong bearish momentum.
Outlook: Bearish reversal likely if 24,700 breaks.
Swing (4H-Monthly)
Daily: Gravestone Doji at 24,722.75 warns of trend exhaustion.
Weekly: Bearish Harami after 3-week rally signals distribution.
Monthly: Long-legged Doji at all-time highs (24,800) indicates indecision.
2. Harmonic Patterns
Intraday
4H/1H: Bearish Butterfly completing at 24,722.75 (D-point).
PRZ: 24,700–24,750 (127.2% XA + 161.8% BC).
30M: Bullish Crab forming at 24,600 (secondary setup).
Swing
Daily: Bearish Gartley near 24,750 (78.6% XA retracement).
Weekly: Potential Bullish Bat at 24,500 if correction extends.
3. Elliott Wave Theory
Intraday
4H: Wave 5 of impulse cycle peaked at 24,722.75.
Structure: Completed 5-wave sequence from 24,200 → 24,722.75.
Corrective Phase: ABC pullback targeting 24,500 (Wave A).
1H: Sub-wave (v) ending with RSI divergence.
Swing
Daily: Wave 3 of primary bull cycle nearing completion at 24,750.
Weekly: Wave (iii) of larger impulse, expecting Wave (iv) correction to 24,300.
Monthly: Wave V of multi-year bull run, nearing major resistance at 24,800.
4. Wyckoff Theory
Intraday
Phase: Distribution (after markup from 24,200 → 24,722.75).
Signs: High volume at 24,722.75 (supply), failed upthrust above 24,750.
Schematic: Phase C (markdown) initiating.
Swing
Daily: Late Markup → Distribution at 24,750.
Weekly: Accumulation completed at 23,500; now in Markup but showing signs of exhaustion.
5. W.D. Gann Theory
Time Theory
Intraday: Key reversal windows:
UTC+4: 10:00–12:00 (resistance test), 14:00–16:00 (trend reversal).
Swing:
Daily: 8th Aug (4 days from close) for time squaring.
Weekly: 12th Aug (1 week) for cycle turn.
Square of 9
24,722.75 → Resistance Angles:
0° (24,750), 90° (24,850), 180° (25,000).
Support: 45° (24,500), 315° (24,250).
Angle Theory
4H Chart: 1x1 Gann Angle (45°) from 24,200 low at 24,500. Price overextended.
Daily Chart: 2x1 Angle (63.75°) at 24,722.75 acting as resistance.
Squaring of Price & Time
Price Range: 24,200 → 24,722.75 (522.75 points).
Time Squaring: 522.75 hours from 24,200 low → 24,750 resistance.
Ranges in Harmony
Primary Range: 24,000–25,000 (1,000 points).
50% Retracement: 24,500 (critical support).
61.8% Retracement: 24,380.
Secondary Range: 24,500–24,750 (250 points).
Price & Time Forecasting
Intraday Targets:
Short-Term: 24,500 (61.8% Fib).
Extension: 24,380 (Gann 45° angle).
Swing Targets:
Weekly: 24,300 (Wave (iv) target).
Monthly: 23,800 (38.2% retracement of entire bull run).
6. Ichimoku Kinko Hyo
Intraday (4H)
Cloud (Kumo): Price below Kumo (bearish).
Tenkan-sen: 24,700 (flat, resistance).
Kijun-sen: 24,650 (support).
Chikou Span: Below price (confirms bearish momentum).
Swing (Daily)
Cloud: Thick cloud resistance at 24,750–24,800.
Tenkan/Kijun: Bearish crossover at 24,700.
7. Indicators
Intraday
RSI (14): 68 (4H) → Overbought; divergence at highs.
Bollinger Bands: Price tagging upper band (24,750); contraction signals volatility.
VWAP: 24,680 (acting as dynamic resistance).
Moving Averages:
50 SMA: 24,600 (support).
200 EMA: 24,400 (major support).
Swing
Daily RSI: 72 (overbought, divergence).
Weekly BB: Upper band at 24,800 (resistance).
Monthly VWAP: 23,500 (major support).
200 WMA: 22,800 (long-term bull support).
Synthesized Forecast
Intraday (Next 24H)
Bearish Scenario (High Probability):
Trigger: Break below 24,700 (1H close).
Targets: 24,500 (T1), 24,380 (T2).
Timeline: 8–12 hours (UTC+4 22:00–02:00).
Bullish Scenario (Low Probability):
Trigger: Sustained close above 24,750.
Target: 24,850 (Gann 90° angle).
Swing (1–4 Weeks)
Bearish Scenario:
Targets: 24,300 (Wave (iv)), 23,800 (38.2% retracement).
Timeline: 5–10 trading days.
Bullish Scenario:
Trigger: Close above 24,800.
Target: 25,200 (Gann 180° angle).
For those interested in further developing their trading skills based on these types of analyses, consider exploring the mentoring program offered by Shunya Trade.(world wide web shunya trade)
I welcome your feedback on this analysis, as it will inform and enhance my future work.
Regards,
Shunya.Trade
world wide web shunya trade
⚠️ Disclaimer: This post is educational content and does not constitute investment advice, financial advice, or trading recommendations. The views expressed here are based on technical analysis and are shared solely for informational purposes. The stock market is subject to risks, including capital loss, and readers should exercise due diligence before investing. We do not take responsibility for decisions made based on this content. Consult a certified financial advisor for personalized guidance.
USD/CHF Sets the Stage for a Classic Wolfe Wave Rally
---
As anticipated, the USD/CHF pair has completed a textbook **Wolfe Wave pattern**, ticking all the structural boxes from wave 1 to wave 5. The early signs of bullish momentum are already unfolding—confirming what we’ve been tracking.
✨ **Wave Logic at Work**
The candles have begun their journey upward, aiming straight for the **dashed line connecting waves 1 and 4**—the ultimate Wolfe Wave price target. This line isn't just a projection—it's the magnetic path that often pulls price toward equilibrium.
🔎 **Why This Setup Matters**
- Pattern confirmation aligns perfectly with our expectations
- Market structure supports continued upward pressure
- Momentum builds as price respects wave symmetry
💡 **Outlook**
We maintain our bullish bias, watching for USD/CHF to stretch confidently toward the dashed line target. Until then, the candles speak the language of precision and possibility.
---

USD/CAD Poised for a Bullish Breakout: All Eyes on 1.41
ه
---
🚀 **
The BAT formation is checking every box—whether you’re analyzing the correction of point **C from AB** or a deeper retracement of **B from XA**, the technical structure is screaming potential.
📊 **Fibonacci Magic**
We’ve got confluence across key Fib levels, with the final projection targeting **1.41**, a crucial resistance that aligns with multiple technical cues.
📉 **Bearish Trendline AC? Consider It Challenged.**
A decisive breach above the descending **AC trendline** would be a powerful confirmation of bullish momentum—and the market’s intent to rally.
⚠️ **Risk Strategy**
The setup remains valid as long as price holds **above point X**. A protective stop-loss below X keeps the trade clean and controlled.
🎯 **Trade Outlook**
With a solid harmonic base, technical alignment across retracement zones, and trendline pressure building, USD/CAD could be gearing up for an aggressive move north. It’s not just a chart—it’s a story, and right now, the plot points to 1.41.
---

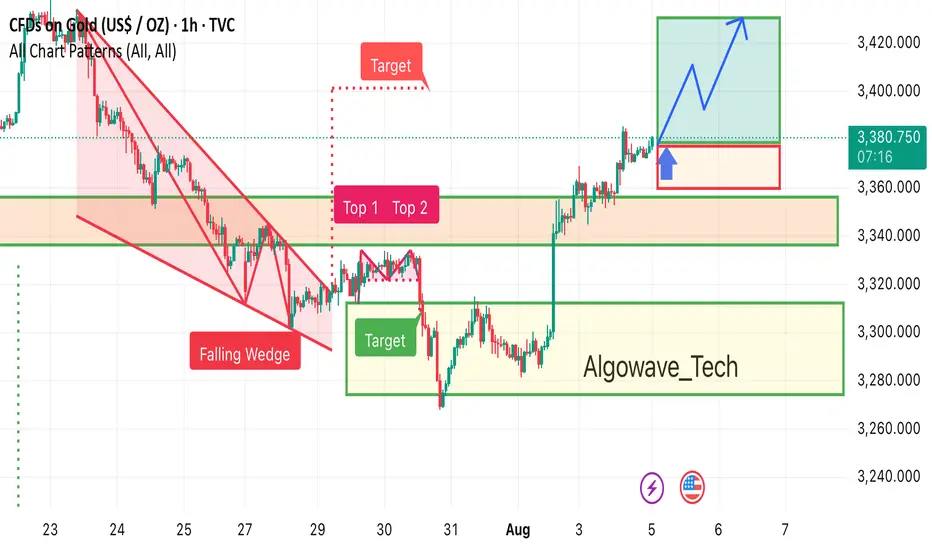
Gold 1h chart pattern Gold has broken out of the falling wedge pattern, showing strong bullish momentum. If price holds above the highlighted support zone, the next potential upside target lies in the 3,425 area. Watching for a healthy retest before continuation.