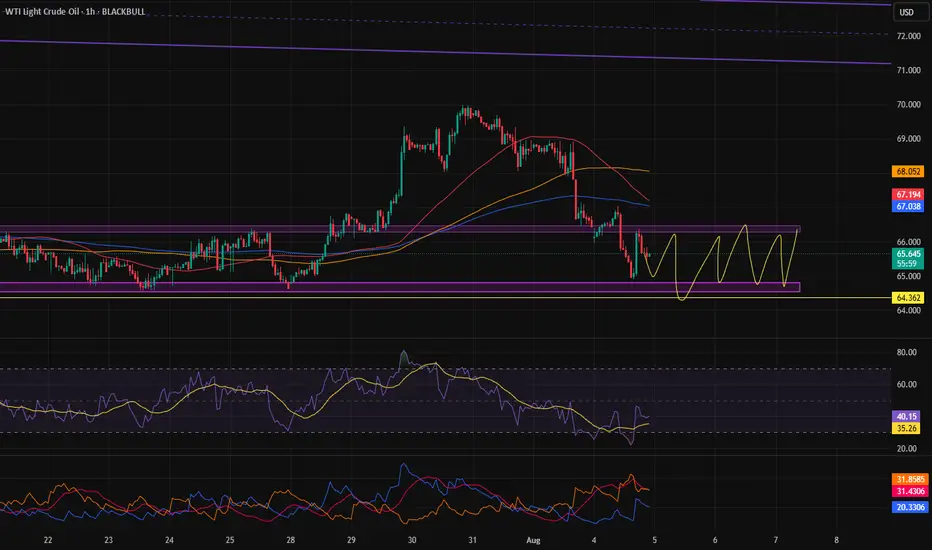
Price returning into the channel is frustrating.After a long time, oil managed to break out of that channel, but we see it has returned back inside the channel again. Hopefully, it will break out from one side soon so we can catch a good opportunity.
Harmonic Patterns
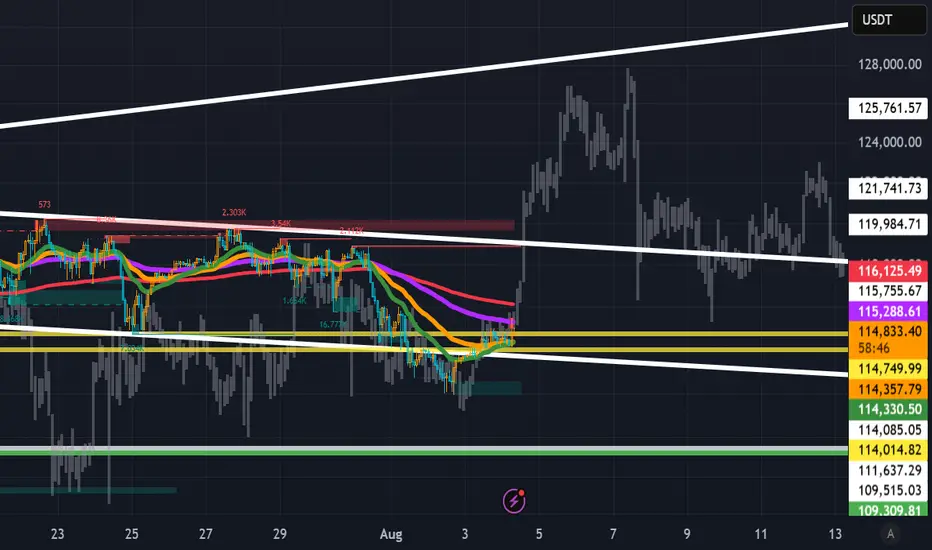
Bitcoin at $117,000?After a deep correction, Bitcoin started an upward trend yesterday and is now at the midline of the 4-hour channel.
The signs suggest that Bitcoin might possibly reach \$117,000.

eth sell midterm "🌟 Welcome to Golden Candle! 🌟
We're a team of 📈 passionate traders 📉 who love sharing our 🔍 technical analysis insights 🔎 with the TradingView community. 🌎
Our goal is to provide 💡 valuable perspectives 💡 on market trends and patterns, but 🚫 please note that our analyses are not intended as buy or sell recommendations. 🚫
Instead, they reflect our own 💭 personal attitudes and thoughts. 💭
Follow along and 📚 learn 📚 from our analyses! 📊💡"

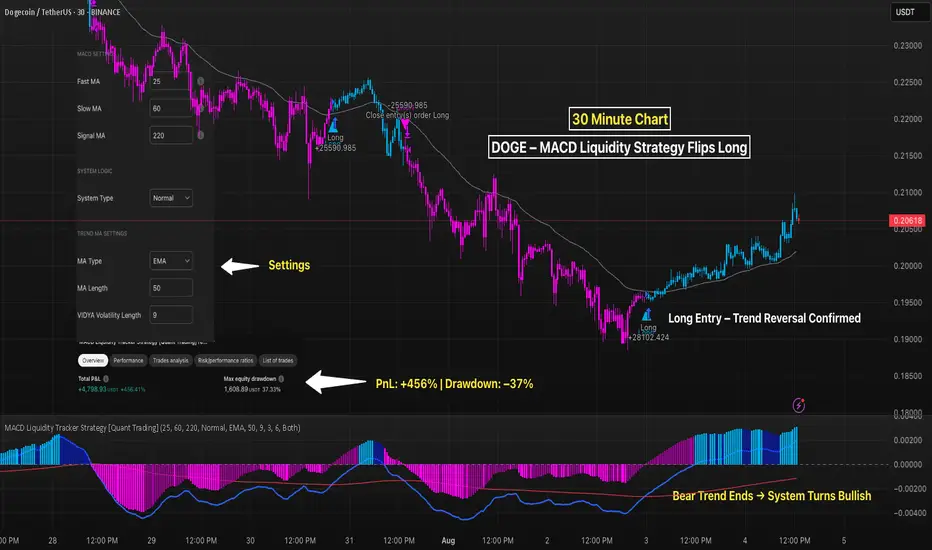
DOGE 30M – MACD Liquidity Strategy Flips Long With MomentumDogecoin just flipped bullish on the MACD Liquidity Tracker Strategy, with a fresh long signal printed around $0.191. After a sustained downtrend marked by persistent short bias (purple candles), the system has now confirmed a trend reversal — backed by both price structure and MACD momentum.
The histogram flipped blue, price reclaimed the trend EMA, and candles turned from purple to blue — all indicating a shift in control.
📈 Strategy Settings:
– Fast MA: 25
– Slow MA: 60
– Signal MA: 220
– Trend Filter: 50 EMA
– Mode: Normal
📊 Backtest Performance (on this symbol + timeframe):
– Total PnL: +456.41%
– Max Drawdown: –37.33%
– Best suited for momentum reversals after consolidation or stop-hunt spikes
If this momentum holds, DOGE could retest local highs around $0.215+ — but a breakdown back below $0.20170 would invalidate the setup.
This system does the heavy lifting — you just follow the signal.
👇 Drop “QTP” below and we’ll send you the full strategy access.
Clean Setup Completed After our previous analysis hit the target, the price has now reached a key decision zone — whether it wants to move higher or not.
At this point, we need to wait and see how the market decides, and then react accordingly.

HEI Bullish DivergenceBINANCE:HEIUSDT
Trade Setup:
Target 1: 0.3703 (0.786 Fibonnaci Golden Zone).
Target 2: 0.3856 (0.618 Fibonnaci Golden Zone).
Target 3: 0.3964 (0.5 Fibonnaci Golden Zone).
Target 4: 0.4420 (0 Fibonnaci).
Stop Loss: 0.3259 (1.272 Fibonnaci).
RSI Analysis: The RSI is showing a bullish divergence, suggesting potential bullish momentum. The current RSI is around 17.39, approaching oversold territory, so caution is advised.

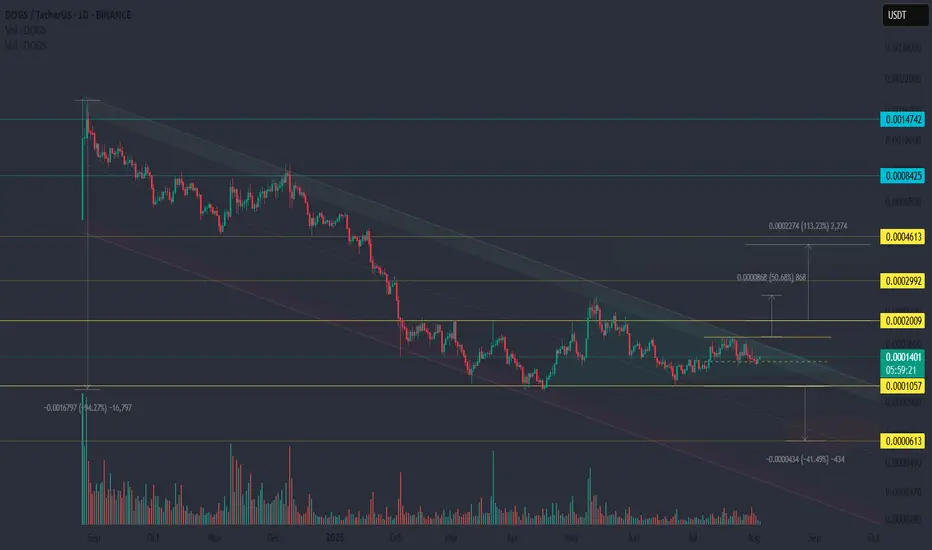
DOGS/USDT — Capitulation Zone. Is the Breakout Coming?The price has been moving sideways for several months, forming a classic low-volatility summer channel.
🔹 Primary trend: still bearish — price remains inside a descending channel
🔹 Volume: mostly low, but occasional spikes near support may signal hidden accumulation
🔹 Formation: a triangle is forming near the top of the channel — false breakouts or wicks are likely
🔹 Sentiment: this is a classic capitulation zone — where most traders give up, exit positions, and lose conviction
📉 When everyone thinks it's dead — that's often where major bottoms are built. This is the time to stick to your risk strategy and position sizing, not emotions.
🐕 DOGS — key reasons to watch:
• Twitter community: 3.4M followers — huge potential for renewed interest
• If memecoins return to trend — moves could be fast and aggressive
📌 Watch closely for a breakout from the triangle — it could define direction for weeks ahead
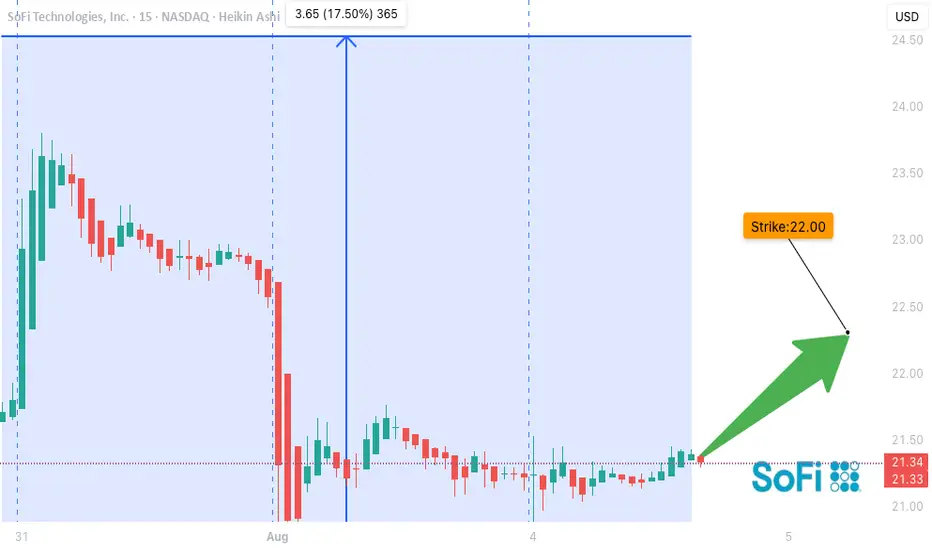
SOFI Setup Before Gamma Squeeze?
## 🐂 **SOFI WEEKLY OPTIONS BREAKOUT SETUP (Aug 4–8)**
**🔥 Bullish Momentum + Institutional Volume Surge = \$22 CALL in Play**
---
### 📌 Summary:
* **Weekly RSI** rising 📈
* **Volume** 2.5x average – strong institutional presence 🏦
* **Options Flow** favors calls: aggressive accumulation
* **Gamma Risk** into Friday + VIX stable ✅
* **Daily RSI** soft = potential dip before rip
---
### 🛠️ Trade Setup:
| Type | Direction | Strike | Expiry | Entry | Stop | Target | Confidence |
| ------ | --------- | ------- | ------ | ------ | ------ | ------ | ---------- |
| Option | CALL | \$22.00 | Aug 8 | \$0.34 | \$0.17 | \$0.68 | 70% ✅ |
💡 **Watch for breakout over \$21.50** — potential gamma squeeze to \$23+
📉 Manage risk below \$21.00 / VIX spike
⚠️ Earnings & macro could add volatility
---
### 🧠 Model Consensus:
* **Grok/xAI**: Strongly bullish, confirms flow & breakout potential
* **Claude & Meta**: Volume confirms upside, but caution on RSI
* **Gemini**: Neutral on daily, bullish long-term
* **DeepSeek**: Momentum trend intact, supports call strategy
---
### 📊 Tag Zone:
`#SOFI #Options #TradingView #Bullish #GammaSqueeze #CallOption #VolumeBreakout #WeeklySetup #MomentumTrading #SmartMoney`
XRP 4H – Precision Bounce from Golden Pocket After All-Time HighXRP just executed a perfect technical pullback — retracing into the golden pocket (0.618 Fib) after hitting its all-time high. The 4H chart shows textbook structure: a breakout, clean Fibonacci retracement, and an instant reaction from key levels.
📍 0.786 (2.28) marked the original breakout
📍 0.618 (2.58) triggered an aggressive bounce
📍 0.5 (2.79) saw instant rejection on the rebound
📍 All-time high resistance still looms above ~$3.75
What makes this setup especially clean is how XRP respected each Fib level like a playbook — reacting on the dot while Stoch RSI reset completely and flipped upward.
This could be the beginning of a bullish continuation… if we reclaim the mid-range and break above $3.30–$3.50 cleanly.
Until then, this is prime territory for range-bound volatility.
How are you playing it: swing long, short fade, or watching for confirmation?
👇 Drop your setup below.

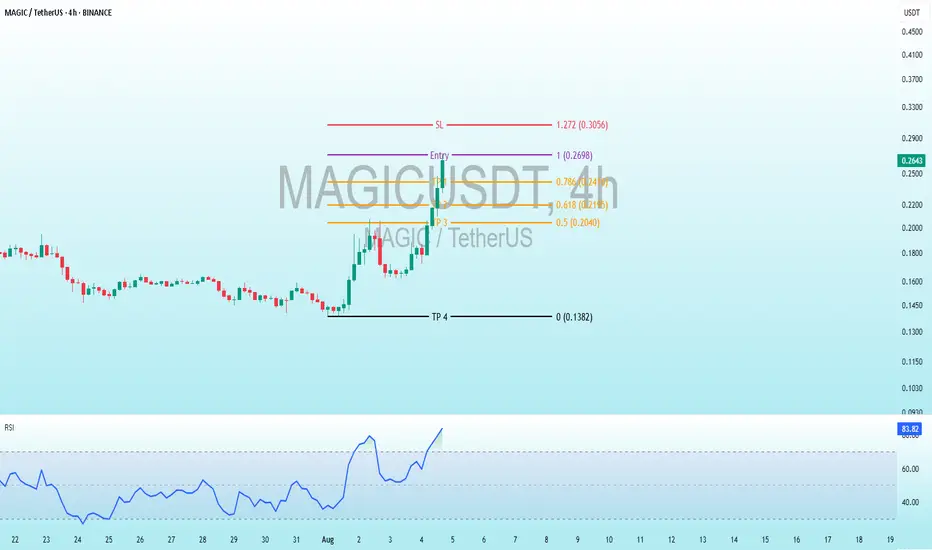
MAGIC Bearish DivergenceBINANCE:MAGICUSDT
Trade Setup:
Target 1: 0.2416(0.786 Fibonnaci Golden Zone).
Target 2: 0.2195 (0.618 Fibonnaci Golden Zone).
Target 3: 0.2040 (0.5 Fibonnaci Golden Zone).
Target 4: 0.1382 (0 Fibonnaci).
Stop Loss: 0.2979 (1.272 Fibonacci).
The RSI is at 84.33, indicating overbought conditions (above 70), which suggests a potential reversal or consolidation may be near unless the trend strengthens further.
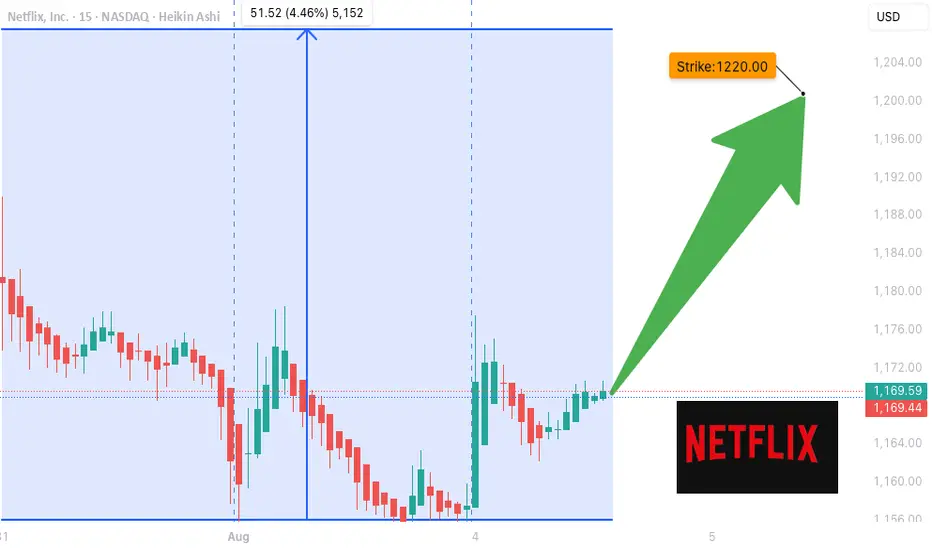
NFLX Wait For Break Out Fibo Level
## 📈 \ NASDAQ:NFLX WEEKLY TRADE IDEA (AUG 5–9)
**🔥 BULLISH FLOW | CALL/PUT RATIO: 1.84 | CONFIDENCE: 65%**
---
### 🧠 AI-DRIVEN SENTIMENT
* **Weekly RSI**: 54.9 ✅ (Bullish Momentum)
* **Daily RSI**: 38.4 ↗️ (Climbing but still weak)
* **Volume**: 📉 0.7x last week = Low institutional follow-through
* **Options Flow**: Massive call buying = Institutions lean bullish
* **Volatility**: VIX at 18.2 = Option-friendly zone
---
### 🛠️ TRADE SETUP
| 🔹 | Trade Type | Long Call |
| -- | --------------- | ------------------- |
| 🎯 | **Strike** | **\$1200** |
| 📅 | **Expiry** | **Aug 8 (Fri)** |
| 💵 | **Entry** | **\$4.05** |
| 📈 | **Target** | **\$6.00 – \$8.00** |
| 🛑 | **Stop** | **\$2.50** |
| 🔐 | **Size** | 1 contract |
| ⚖️ | **Risk/Reward** | \~1:2 |
---
### ⚠️ RISK CHECK
* 🔸 Daily RSI still < 45 — needs breakout for full confirmation
* 🔸 Volume not convincing — watch for fakeouts
* 🔸 Short expiry = 🔥 gamma risk
---
### 🧩 STRATEGY INSIGHT
> "Call buyers are in. RSI is rising. But volume is soft. You’re early — not late."
🎯 Enter @ Open
🚀 Target quick momentum pop
👀 Exit if RSI fails to break or macro hits
---
💬 **Plan to enter?** Comment “IN”
🔁 Repost if you're tracking NFLX
📊 Follow for more AI-synced trades
Long Hype, Looking for a retracement, we have double bottoms and double tops and then see London and NY trade to Sunday high.

CMG high timeframe LONGEasy CMG long term long position from historical support, shorter term take profit at the top of descending channel.

Will MEXC hit $12 in this bull run?🚨 NYSE:MX (MEXC) Looks Ready to Explode 🚨
Since 2018, MX has been forming clean HH & HL on the HTF.
Now it's approaching another potential Higher High — and if this plays out…
👉 $12 is on the table.
Structure is king. Bullish momentum is real.
⚠️ Only invalidation? Below $0.77 (CHoCH zone).
So here’s the real question:
Will NYSE:MX hit $12 next… or break the entire bullish structure?
Drop your thoughts 👇
NFA & DYOR

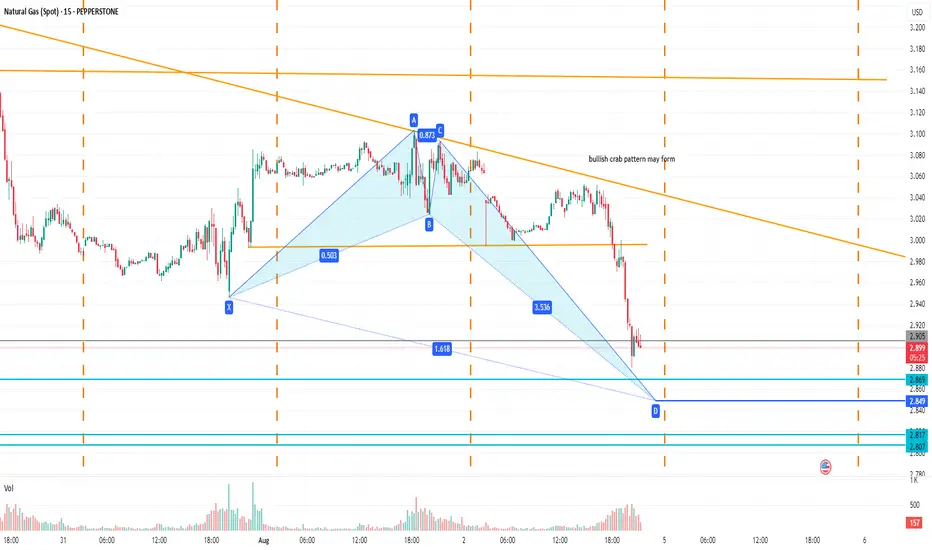
Natural Gas spotBullish Crab pattern may form, but over all sell on rally as ichimoku cloud break in weekly but fallen too much so need to be careful. Level of crab pattern completion spotted in chart.
TEM: Bought Some Calls HereLooks pretty good at the demand zone, finding buyers and volume. Watching the next move. Thanks for reading.

4H Gold/USD - Decoding the liquidity zones 📈 Smart Money Concept: Liquidity Grab & Market Shift
This 4H Gold/USD chart shows a classic liquidity sweep below a key level (Sell-side liquidity) followed by a CHoCH (Change of Character) — signaling a bullish market structure shift. A fair value gap (FVG) is formed as price aggressively breaks previous highs, offering a clean entry point on the retest.

HI GUYShere i have a sneak peak of how i think silver has to play out.
i expect sells now, as we form the daily double bottom.
what do u think

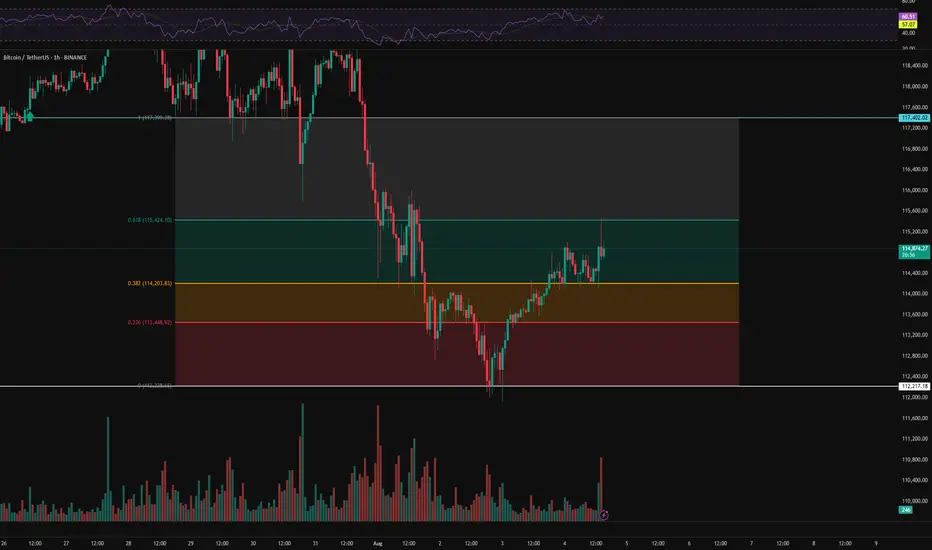
BTC Hourly Analysis – Day 1 | Trend Structure & Key Reactions⏱️ We’re analyzing Bitcoin on the 1-hour timeframe.
👀 After breaking below its support zone at 107,402, Bitcoin experienced a correction along with increasing sell pressure. The price then moved toward the 112,200 support area, where it formed a V-pattern — which has now been broken to the upside.
🎮 We’re using Fibonacci levels to identify key resistance zones and long-entry triggers. A higher low has formed above the 112,217 support and above the 0.382 Fib level, which could serve as a strong confirmation of the breakout .
⚙️ The RSI oscillator on the 1H chart is currently above 50. If buying volume increases, RSI may enter the Overbought zone. The critical level here is 70 — breaking above it can act as a confirmation for a long position .
☄️ A specific Fibonacci-based zone, linked to market maker sellers and supply pressure, was touched, triggering a reaction — around 177 BTC were sold following that touch .
🖥 Summary : As long as Bitcoin stays above its previous high, there’s no immediate concern for long positions. Based on the confirmations above, you may consider entering a long position upon a resistance breakout and taker-seller zone clearance .
📉 No short positions are planned until the 110,000 support level is clearly broken .
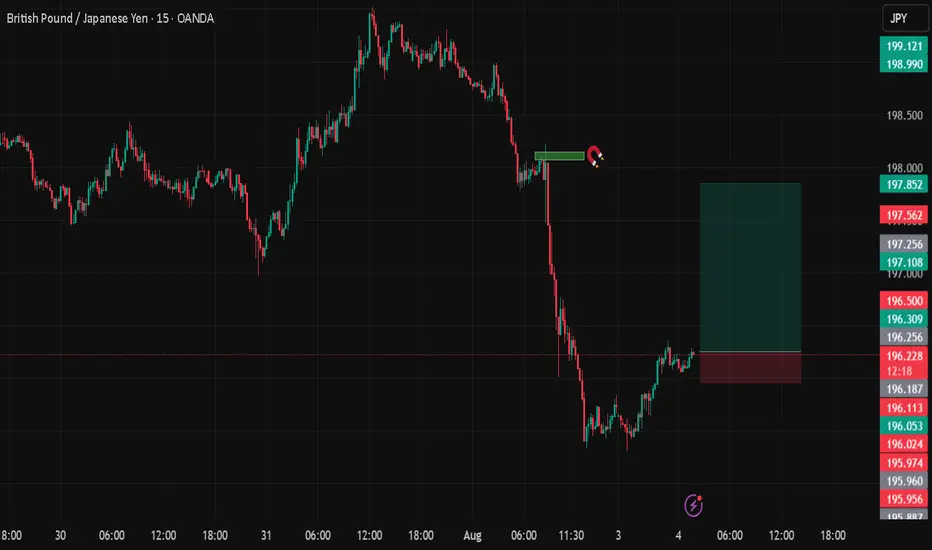
GBPJPYDate:
August 3,2025
Session:
Tokyo Session
Pair:
GBPJPY
Bias:
Long
Fridays New York open left a liquidity pool. I see todays Asia or London session sweeping that area.
Entry:196.254
Stop Loss:195.957
Target:197.847
RR:5.32
The Final PushNot long ago Terry started a journey. He led with faith and a determined spirit. Now the time has come for the end. Fortunes were made and fortunes were lost. The end must come so..........
That his new journey may begin,
Thanks for the adventure cant wait to see what is next.
Netherlands Indice NL25 will hit 900.000 this weekOANDA:NL25EUR Long trade, with my back testing of this strategy, NL25EUR need to touch 9000.00
This is good trade, don't overload your risk like Greedy, be disciplined trader.
Use proper risk management
Looks like good trade.
Lets monitor.
Use proper risk management.
Disclaimer: only idea, not advice

NZDUSD longOn the NZD/USD chart, we see a bullish Gartley pattern aligning with an upward trendline. I expect the price to move higher.
