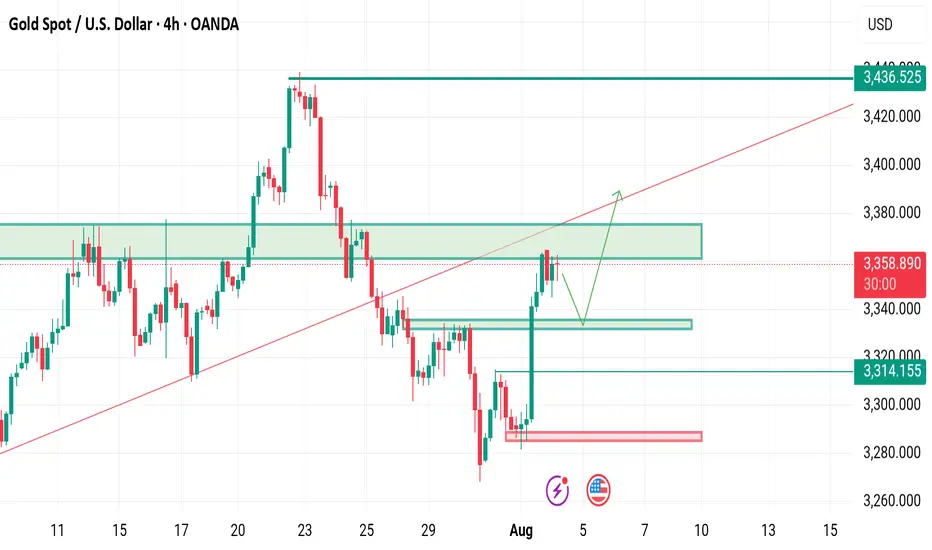
Gold: Continue to go long at 3345-3355Gold: Continue to go long at 3345-3355
Gold Analysis: The Glittering Eye of the Storm, a Race Against Time in the Bull-Bear Game
Market Sentiment: Geopolitical Tinderbox and the Fed's Game of Ice and Fire
The gold market is experiencing an epic tug-of-war between bulls and bears!
The macroeconomic trend is irreversible;
Continue to go long at low prices, bullish on gold in the long term.
Last Friday (August 2nd), the unexpected non-farm payroll data sent the market into a panic—the probability of a September Fed rate cut soared to 80%.
Israel launched airstrikes on Hezbollah strongholds in Lebanon. The Russian-Ukrainian drone war escalates.
Geopolitical risk premiums are supporting gold prices.
On the other hand, hawkish comments from Fed official Waller ("Inflation remains high, more data is needed") have had a dampening effect, causing gold prices to give back some of their gains.
The market is oscillating between a "safe-haven frenzy" and "interest rate anxiety"!
Bulls: Monthly MACD Golden Cross + Imminent Breakthrough of Historical Resistance
Gold has formed an ascending triangle on the weekly chart.
If gold prices hold above 3350 this week, the target is 3450.
Three Catalysts for the August Decisive Battle
US CPI Data for August 13th:
If the core CPI falls below 4.8% (previous value), gold prices will break through 3400.
If the core CPI rises above 5%, the Fed may "talk about raising interest rates," and gold prices may flash crash to $3300.
If it exceeds 5%, the Fed may "talk about raising interest rates," and gold prices may flash crash to $3300.
Geopolitical Black Swan:
Any sudden conflict involving Iran, the Taiwan Strait, or North Korea would trigger a sudden rise in gold prices.
The lifeline of the US dollar index: If the US dollar falls below 101 (the 200-day moving average), gold will gain rocket fuel.
Today's Trading Strategy: (This week's strategy remains unchanged: continue to buy at low prices)
1: Buy in batches between 3340 and 3350 points, with a stop-loss at 3330 points and a target of 3380-3400 points.
2: Short with caution.
3: Core Principle: "Geopolitical risks are undeniable; CPI data is a tool for quick entry and exit."
Gold has entered a frenzied "event-driven" phase. Stop-loss orders are crucial, and positions must be light!
4: Final advice: When Wall Street starts discussing "gold monetization," remember to stay half-awake and half-drunk.
This market specifically targets extreme emotions!
Harmonic Patterns

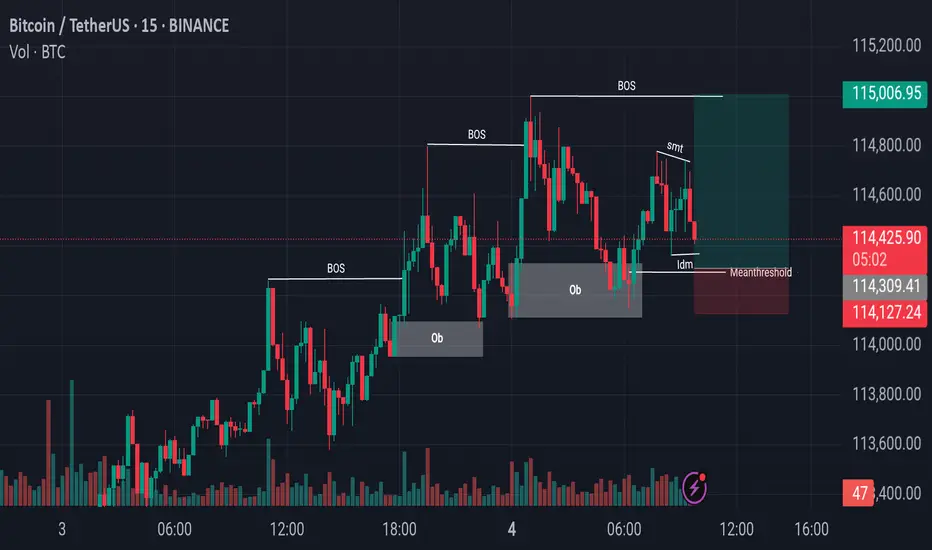
Bitcoin Price Flow From Liquidity Grabs to Structural BreakoutsBitcoin Price Action Analysis:
In recent sessions, Bitcoin has been consistently making Breaks of Structure (BoS) to the upside, indicating a strong bullish trend. Most recently, after forming another BoS, the market retraced downward and precisely tapped into a previously established Bullish Order Block (OB). This reaction led to a temporary upward movement; however, during this process, the market also created a zone of internal liquidity.
Currently, Bitcoin is showing signs of a downward move again, potentially aiming to capture Internal Drawdown Market (IDM) liquidity. Just below this level lies another key Order Block, which could serve as a strong support zone. If the price reacts positively from this region, we might see the market initiate another upward leg, potentially forming the next Break of Structure to continue the bullish narrative.
Note: Always perform your own research (DYOR) before making any trading decisions.
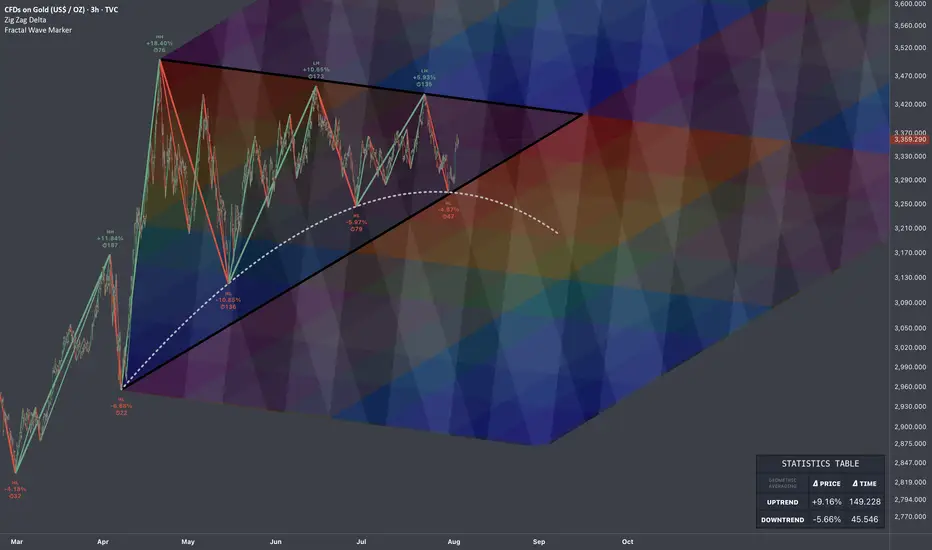
$GOLD: Projections of Compression & Release 🏛️ Research Notes
Price is at fib boundary derived from its structure that covers growth patterns. Several attempts were taken place to push higher and ended up as lower highs.
Contraction of fractal cycles and amplitude.
Topologically, the compression to a point of proportional release in fibonacci proportions and scaling law 1:1 to original triangle would look like a cube. And let's limit for now with that horizon.
Probabilistic Filter - Another layer of fibonacci channels to inherit roughness of observed temporal pattern which then rhymes with extended series.
The longer the price fluctuates in these geometric boundaries, the more accurate the colors tend to reflect the outcome.
For measuring percentages of swings I used this modification of Zig Zag.
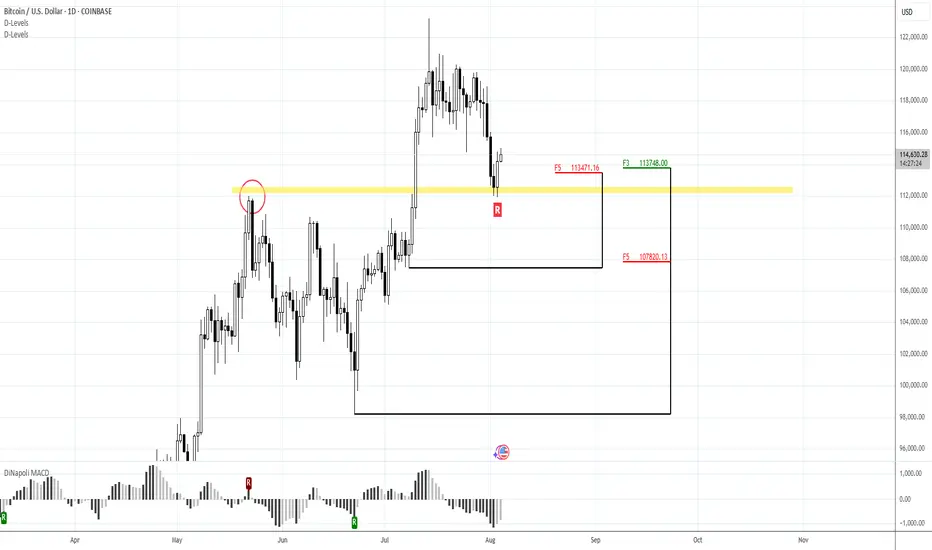
Watching for intraday BTC bounce firstMorning folks,
So, neither NFP data nor technical picture helped BTC to stay above 117. While US Treasury is started drain liquidity and borrow (they need 1 Trln this month), sending ~ 150 Bln to its TGA account with the Fed - BTC got hurt.
Now price stands at vital area - previous tops. If BTC will drop under 110K, collapse could start. Let's hope that this will not happen...
Meantime, we're at 112-113K support. We already talked about it before. Here we have reversal bar and bullish engulfing pattern, so maybe we could get a bit higher pullback on intraday chart. 113.8 and 113.1K support areas on 1H TF might be considered for long entry. Invalidation point for this plan is the low of engulfing pattern.
Gold Trade Plan 04/08/2025Dear Traders,
The 3366-3370 zone is an important area for gold. I expect a temporary correction towards the 3334-3336 zone, followed by a continuation of the bullish trend towards the target of 3380-3400.
Market will be range for some days,
Regards,
Alireza!
Ask ChatGPT

GOLD SHORT TRADE VIEWAronnoFX will not accept any liability for loss or damage as a result of
reliance on the information contained within this channel including
data, quotes, charts and buy/sell signals.
If you like this idea, do not forget to support with a like and follow.
Traders, if you like this idea or have your own opinion, please feel free command me.

BTC rally starts / 241.000$Bitcoin is entering the last bullish rally before bear market. I want to see new phase of euphoria on crypto and altcoins also and overbought on RSI indicator

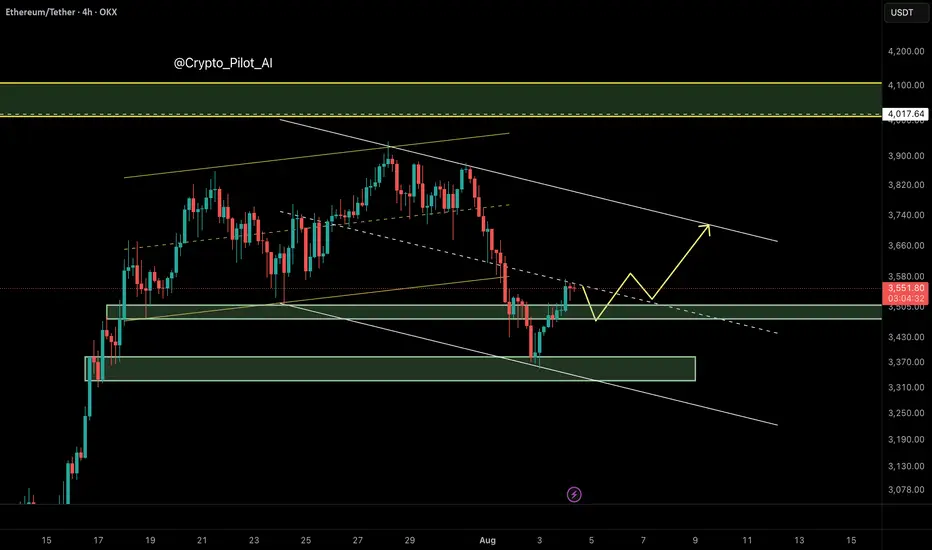
Ethereum (ETH/USDT) – Bearish Channel Structure Developing
⸻
🔍 Technical Overview
Ethereum has broken down from its ascending channel, invalidating the earlier bullish projection toward $4,000. After failing to hold the channel midline around $3,577, price dropped sharply to $3,360, forming a new bearish descending channel.
Currently, ETH is trading near the midline of this bearish channel, which typically acts as a decision point — not a buying zone — in smart money models.
⸻
🧠 NEoWave Interpretation
We may be inside a Complex Corrective Wave, possibly a Running or Contracting Flat evolving after the March top. The current structure resembles a B-wave trap, where price fakes out the upside before shifting momentum sharply downward. The break below the ascending channel midline confirms this bearish shift.
⸻
📊 Smart Money Summary
• 🟥 BOS confirmed on 1H and 4H (lower highs and lower lows)
• 🔻 Midline failure acted as a smart money trap, followed by a liquidity sweep below $3,490
• 📦 Bullish Order Block around $3,490–$3,520 has been tapped, prompting a minor reaction
• 🟡 Current resistance sits near the channel top ~ $3,715
⸻
🎯 Trade Scenarios
📌 Bearish Continuation:
If price fails to reclaim above $3,715, a retest and rejection from the channel top could trigger continuation toward $3,300–$3,250.
📌 Bullish Reversal (less likely for now):
Only a clean break and hold above $3,720 would suggest that bulls are regaining control, opening path toward $3,900–$4,000 — though this scenario is weakened after structural damage.
⸻
⚠️ Trader Tip:
Avoid buying into midline reactions in weak channels. Better long setups form after stop-hunts, ideally near bullish OBs + internal BOS confirmations.
⸻
✅ Conclusion
Ethereum remains under bearish pressure after losing its ascending structure. Unless price reclaims the $3,715 resistance zone with momentum, downside continuation remains likely.
⸻
📌 Save this analysis
💬 Share your thoughts or alt wave counts in the comments.
TRXUSD – Above the CloudsTRX surged back above its 200 SMA, now at $0.33040, just below resistance. RSI at 63.5 remains strong. Price is riding an aggressive rally channel with strong follow-through potential.

ETHUSD – Holding the LineETH is flirting with breakout mode, reclaiming its 200 SMA at $3,477 and pushing to $3,569. RSI is recovering from a dip and regaining upside pressure. Momentum holds above $3,525.

Gold (XAU/USD) Technical Analysis – NeoWave Perspective📅 August 2025 | 📈 4H Chart
📍Posted by: @ CryptoPilot
Gold completed a corrective Wave A near $3160 at the bottom of the descending channel. It then rallied to $3440, followed by a decline toward the channel’s midline at $3227, beginning a potential Wave C.
Attempts to break and hold above the channel failed. Price has since broken below the trendline and is now pulling back to retest it from below.
⸻
🔍 Key Insights:
• 📉 No long entries recommended at current levels
• ✅ Bullish confirmation requires a clear breakout and close above the channel top
• 🛒 Safer long setup may emerge near $3120 at the channel bottom and possible Wave C completion zone.
⸻
🔑 Key Levels:
• Resistance: $3380–$3440
• Support: $3120
• Invalidation / Stop-loss: Below $3110
⸻
📌 Follow @ CryptoPilot for more wave structure insights, SMC confluence, and multi-timeframe strategies.
💬 Drop your thoughts and alternate counts in the comments below!

XAUUSD in bulls control Currently we have range of 3345-3380 area also we have proper CHOCH on H4 at 3335 support area.
What possible scenarios we have ?
• i'm expecting the buying of gold at 1st 3340-3335 area if we got confirmation of rejection, market has to gives closing above On H4. buy at this zones for target of 3380-3400.
• below 3330-3325 we'll have sell towards 3290 milestone.

#GALA/USDT Sustain the Current Bullish Momentum or Will it Fal#GALA
The price is moving within an ascending channel on the 1-hour frame, adhering well to it, and is poised to break it strongly upwards and retest it.
We have support from the lower boundary of the ascending channel, at 0.01420.
We have a downtrend on the RSI indicator that is about to break and retest, supporting the upside.
There is a key support area (in green) at 0.01392, which represents a strong basis for the upside.
Don't forget one simple thing: ease and capital.
When you reach the first target, save some money and then change your stop-loss order to an entry order.
For inquiries, please leave a comment.
We have a trend of stability above the Moving Average 100.
Entry price: 0.01550
First target: 0.01600
Second target: 0.01658
Third target: 0.01727
Don't forget one simple thing: ease and capital.
When you reach the first target, save some money and then change your stop-loss order to an entry order.
For inquiries, please leave a comment.
Thank you.

UPTADE TESLA -- 250 USD still potentialTesla is consolidating in a tight range, showing bearish pressure near the lower boundary of the formation. Moving averages (MA 5/10/30/60) are flattening, indicating a loss of bullish momentum, while the Wavetrend oscillator has issued a sell signal (bearish crossover below the zero line). A downside breakout from this range projects a potential move toward the $250 level, as illustrated by the measured move. This bearish scenario gains validity if price breaks below the $315 support level.
Potential TP still 250 USD

#CGPT/USDT Can Rich $ 0.09974 ?#CGPT
The price is moving within an ascending channel on the 1-hour frame, adhering well to it, and is poised to break it strongly upwards and retest it.
We have support from the lower boundary of the ascending channel, at 0.08200.
We have a downtrend on the RSI indicator that is about to break and retest, supporting the upward move.
There is a key support area (in green) at 0.08500, which represents a strong basis for the upward move.
Don't forget one simple thing: ease and capital.
When you reach the first target, save some money and then change your stop-loss order to an entry order.
For inquiries, please leave a comment.
We have a trend of stability above the Moving Average 100.
Entry price: 0.09000
First target: 0.09253
Second target: 0.09588
Third target: 0.09974
Don't forget one simple thing: ease and capital.
When you reach the first target, save some money and then change your stop-loss order to an entry order.
For inquiries, please leave a comment.
Thank you.

Hidden Bullish Divergence on Bigger tf.IMAGE
Closed at 21.94 (27-05-2025)
Hidden Bullish Divergence on Bigger tf.
Monthly Closing above 20.70 will be a
positive sign.
Upside Targets can be around 26 - 26.50
On the flip side, 20.50 - 20.68 is a Good
Support zone and then around 19.
Should not break 17.30, otherwise we may
witness nd Reversal.

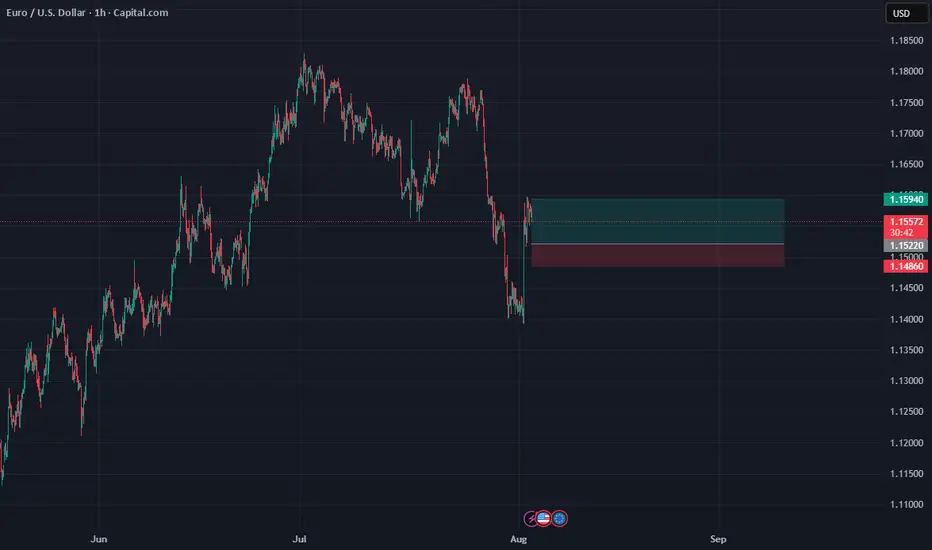
ENTRY EURUSDDisclaimer:
This is merely a chart-based analytical trading idea and is not considered investment advice. Please manage your risks carefully and conduct your own research before making any trading decisions.
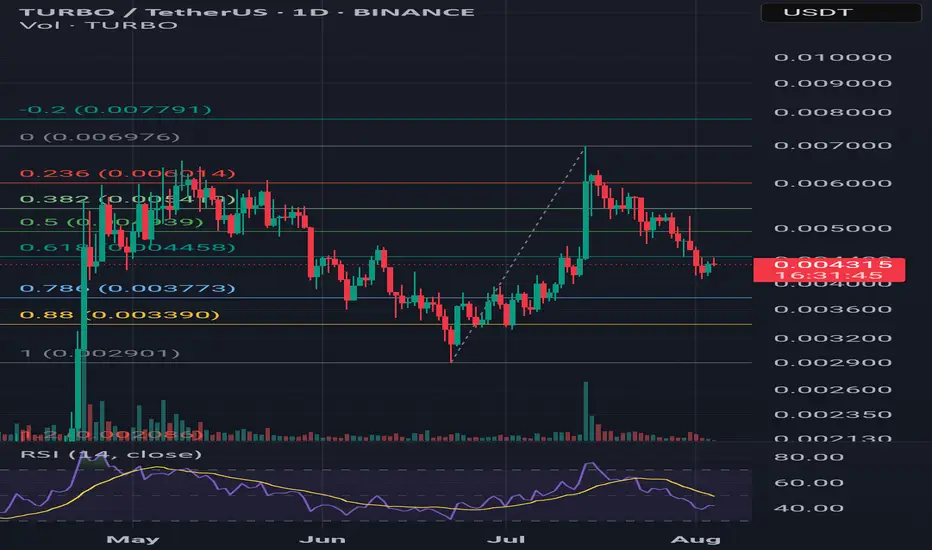
TURBO/USDT – Cup and Handle Formation (1D Chart)Overview:
TURBO/USDT is potentially forming a textbook Cup and Handle pattern on the 1-day chart. Price action suggests a rounded bottom (the “cup”) followed by a consolidation range (the “handle”), setting up for a possible breakout.
---
🔍 Pattern Structure:
- Cup Formation:
Price rallied from ~0.0029 to ~0.0060 USDT, retracing slightly from the top. This rounded rise resembles the classic cup shape.
- Handle Formation:
Recent price consolidation between 0.0042–0.0049 USDT hints at the formation of the handle. A breakout above resistance could validate the pattern.
---
📈 Key Technical Levels:
Entry Zone | 0.0047 – 0.0050 |
| Resistance (Breakout)| ~0.0060 |
| Target 1 | ~0.0064 |
| Target 2 | 0.0078 – 0.0084 |
| Stop Loss | Below 0.0042 |
🔄 Additional Indicators:
- Volume: Watch for increasing volume to confirm breakout momentum.
- RSI (14-day): Neutral zone with room for upward movement. Momentum is building.
- Fibonacci Levels: 0.618 retracement (~0.004458 USDT) has acted as a key support during handle formation.
---
💡 Idea: Monitor for a daily close above 0.0060 with volume confirmation. That could mark the beginning of a bullish continuation. Risk management is essential if price fails to hold above the handle support.
It seems like no one likes non-panic morning posts...Futures are like a rented Ferrari, spot is like a purchased Mercedes.
There are hidden reserves under the melting volumes. What do you think about the current denouement?

BTCUSD BUY 109270On the daily chart, BTCUSD is experiencing a pullback from its highs, with short-term bears taking advantage. Currently, attention can be paid to the support level near 109270, which is a potential buy level for a bullish bat pattern and is within the previous demand zone.

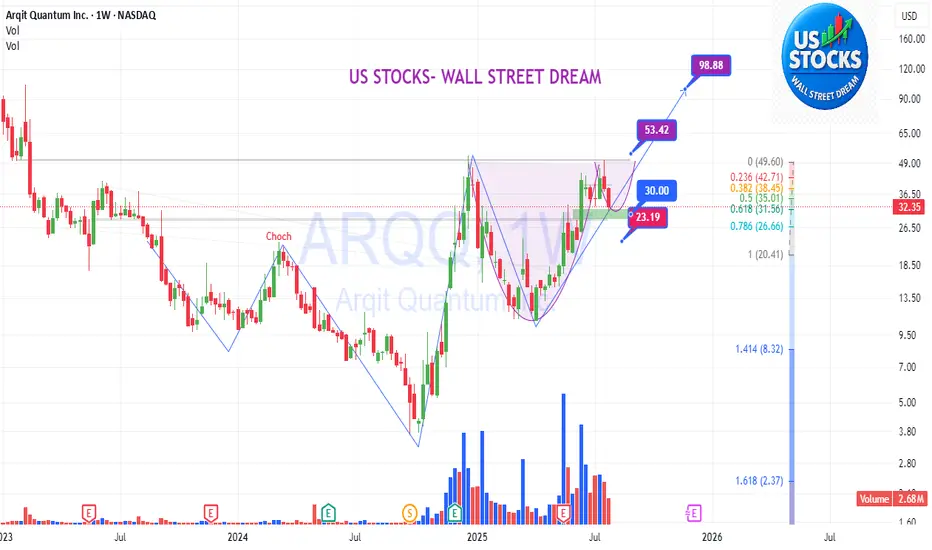
ARQQ: ARQQ: Pull back!
.
The market is pulling back, ARQQ is pulling back — is it a risk or an opportunity? That depends on you.
.
US STOCKS- WALL STREET DREAM- LET'S THE MARKET SPEAK!
ARKMUSDT Make or Break? Testing the Ultimate Historical Support!🧱 Critical Support Zone in Play
ARKM is currently trading around $0.470, sitting right on top of a major historical support zone ($0.400–$0.470) highlighted in yellow on the chart. This area previously served as a launchpad in late 2023, propelling price to an all-time high of $3.996.
Now, after a prolonged downtrend, the price is once again testing this same key level. The market's reaction here will likely define the next macro direction—will ARKM bounce and reverse, or break down into new lows?
---
📐 Technical Structure & Key Levels
Major Support (Demand Zone): $0.400 – $0.470
Layered Resistance:
Minor: $0.616, $0.730, $0.894
Mid-Level: $1.575
Major: $2.493 & $3.188
All-Time High: $3.996
Volume Insight: Still relatively low, suggesting possible accumulation.
---
🔄 Pattern Development:
✅ Potential Double Bottom or Accumulation Base – Multiple bounces off the $0.400 zone hint at the formation of a medium-term reversal structure.
If buyers step in and push the price above $0.616–$0.730, we could see confirmation of a trend reversal beginning.
---
📈 Bullish Scenario:
If price:
Holds and rebounds strongly from $0.400–$0.470
Breaks and closes above $0.616 and $0.730 with increasing volume
Then next bullish targets are:
➡️ $0.894 (key resistance)
➡️ $1.575 (mid-range supply zone)
➡️ $2.493 – $3.188 (macro targets for medium-long term rally)
📌 Volume breakout and bullish candle structures will strengthen this scenario.
---
📉 Bearish Scenario:
If price:
Breaks and closes decisively below $0.400, invalidating the support zone
This could trigger a mass stop-loss cascade, with sellers taking over.
Next possible supports: ⚠️ $0.250 (minor support)
⚠️ $0.170 (last structural support in breakdown mode)
This scenario might unfold if overall crypto market sentiment worsens.
---
🧠 Strategy & Trade Ideas:
Buy on Reversal: Strong bounce at $0.400 zone with tight stop-loss below support
Buy on Breakout: Clear break and retest of $0.730 with volume confirmation
Sell/Short: Breakdown below $0.400 with failed retest
🛡️ Always apply proper risk management with a minimum 1:2 risk-reward ratio. Avoid FOMO—wait for confirmation.
---
🔍 Final Thoughts:
ARKM is in a high-stakes zone that has historically generated explosive moves. This is either a huge opportunity for accumulation or a potential breakdown into uncharted lows. The next few candles could define the rest of the year for this asset.
#ARKM #ARKMUSDT #CryptoTA #AltcoinAnalysis #SupportAndResistance #CryptoBreakout #DoubleBottomPattern #ReversalZone #BuyOrBreak #CryptoSetup
