Harmonic Patterns

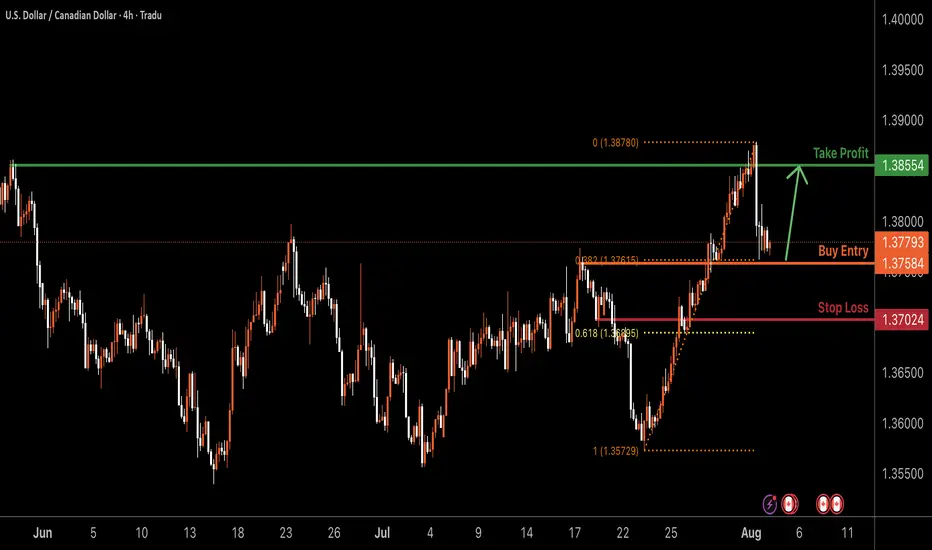
USDCAD H4 | Bullish bounce off pullback supportUSD/CAD is falling toward the buy entry, identified as a pullback support that aligns with the 38.2% Fibonacci retracement and could potentially bounce to the upside.
Buy entry is at 1.3758, which is a pullback support that lines up with the 38.2% Fibonacci retracement.
Stop loss is at 1.37024, which is a pullback support that is slightly above the 61.8% Fibonacci retracement.
Take profit is at 1.3855, which is a pullback resistance.
High Risk Investment Warning
Trading Forex/CFDs on margin carries a high level of risk and may not be suitable for all investors. Leverage can work against you.
Stratos Markets Limited (tradu.com ):
CFDs are complex instruments and come with a high risk of losing money rapidly due to leverage. 65% of retail investor accounts lose money when trading CFDs with this provider. You should consider whether you understand how CFDs work and whether you can afford to take the high risk of losing your money.
Stratos Europe Ltd (tradu.com ):
CFDs are complex instruments and come with a high risk of losing money rapidly due to leverage. 66% of retail investor accounts lose money when trading CFDs with this provider. You should consider whether you understand how CFDs work and whether you can afford to take the high risk of losing your money.
Stratos Global LLC (tradu.com ):
Losses can exceed deposits.
Please be advised that the information presented on TradingView is provided to Tradu (‘Company’, ‘we’) by a third-party provider (‘TFA Global Pte Ltd’). Please be reminded that you are solely responsible for the trading decisions on your account. There is a very high degree of risk involved in trading. Any information and/or content is intended entirely for research, educational and informational purposes only and does not constitute investment or consultation advice or investment strategy. The information is not tailored to the investment needs of any specific person and therefore does not involve a consideration of any of the investment objectives, financial situation or needs of any viewer that may receive it. Kindly also note that past performance is not a reliable indicator of future results. Actual results may differ materially from those anticipated in forward-looking or past performance statements. We assume no liability as to the accuracy or completeness of any of the information and/or content provided herein and the Company cannot be held responsible for any omission, mistake nor for any loss or damage including without limitation to any loss of profit which may arise from reliance on any information supplied by TFA Global Pte Ltd.
The speaker(s) is neither an employee, agent nor representative of Tradu and is therefore acting independently. The opinions given are their own, constitute general market commentary, and do not constitute the opinion or advice of Tradu or any form of personal or investment advice. Tradu neither endorses nor guarantees offerings of third-party speakers, nor is Tradu responsible for the content, veracity or opinions of third-party speakers, presenters or participants.
ALICE/USDT – Will It Rebound from Demand Zone or Break Down?🧭 Analysis Summary:
ALICE is at a critical turning point, once again testing a historical demand zone that has provided strong support since Q2 2025. The current price action suggests potential accumulation, setting the stage for a significant move — either a powerful bounce or a devastating breakdown.
---
📌 Chart Details (Daily Timeframe):
Main Trend: Still in a macro downtrend since December 2024
Current Price: $0.3714
Key Demand Zone: $0.35 – $0.41 (highlighted yellow box)
Nearest Supports: $0.35 → $0.3102 (2025 low)
Layered Resistance Levels: $0.4786 → $0.5672 → $0.6481 → $0.7986 → $0.9754
---
🧱 Market Structure & Patterns:
Price has been consolidating in a tight range over recent weeks — indicating possible accumulation or distribution.
The long-standing descending channel shows signs of exhaustion, with repeated rejections from the demand zone.
A small double bottom pattern appears to be forming, suggesting a possible reversal if validated.
---
📈 Bullish Scenario – Reversal Potential on Confirmation:
✅ If the price holds above $0.35 and forms a higher low, a trend reversal could take shape.
✅ A breakout above $0.41 would act as the first bullish confirmation.
🎯 Upside Targets:
$0.4786 → minor resistance, good for short-term swing trades
$0.5672 – $0.6481 → mid-range resistance & Fibonacci levels
$0.7986 – $0.9754 → longer-term recovery zone if sentiment improves
💡 Stronger confirmation would come from increasing volume and Daily RSI crossing above 50.
---
📉 Bearish Scenario – Breakdown and Trend Continuation:
❌ A breakdown below $0.35 would likely push price toward the $0.3102 support — the lowest level of the year.
❌ If $0.31 fails, further downside toward $0.25 or even $0.20 is possible, due to a lack of nearby historical support.
💀 This would confirm the continuation of the major downtrend, signaling sellers still have control.
---
📊 Market Sentiment:
On a broader scale, altcoins are still under pressure amid regulatory uncertainty and declining DeFi activity.
However, ALICE’s demand zone remains a high-interest area for traders seeking mid-term accumulation opportunities.
---
🎯 Strategy Ideas:
Strategy Type Action Key Levels
Buy on Breakout Enter on confirmed breakout > $0.41 Target: $0.48 – $0.64
Sell on Breakdown Short below $0.35 Target: $0.31 or lower
Range Trade Buy low, sell high between $0.35–$0.41 Tight stop-loss recommended
---
📝 Conclusion:
ALICE/USDT is at a technical and psychological crossroads. This yellow zone is where big moves often begin — the question is, will bulls take control or will bears pull it deeper? All eyes should be on how price reacts to this demand area.
#ALICEUSDT #CryptoTA #AltcoinAnalysis #DemandZone #BreakoutOrBreakdown #PriceAction #VolumeAnalysis #CryptoReversal #SwingTradeSetup #ALICEAnalysis #CryptoTrend

NZDUSD H4 | Bullish reversalThe price is falling towards the buy entry, which is a pullback support level, and could bounce from this level to the upside.
Buy entry is at 0.5896, which is a pullback support that aligns with the 38.2% Fibonacci retracement.
Stop loss is at 0.5845, which is a swing low support.
Take profit is at 0.5998, which his a pullback resistance that is slightly above the 61.8% Fibonacci retracement.
High Risk Investment Warning
Trading Forex/CFDs on margin carries a high level of risk and may not be suitable for all investors. Leverage can work against you.
Stratos Markets Limited (tradu.com ):
CFDs are complex instruments and come with a high risk of losing money rapidly due to leverage. 65% of retail investor accounts lose money when trading CFDs with this provider. You should consider whether you understand how CFDs work and whether you can afford to take the high risk of losing your money.
Stratos Europe Ltd (tradu.com ):
CFDs are complex instruments and come with a high risk of losing money rapidly due to leverage. 66% of retail investor accounts lose money when trading CFDs with this provider. You should consider whether you understand how CFDs work and whether you can afford to take the high risk of losing your money.
Stratos Global LLC (tradu.com ):
Losses can exceed deposits.
Please be advised that the information presented on TradingView is provided to Tradu (‘Company’, ‘we’) by a third-party provider (‘TFA Global Pte Ltd’). Please be reminded that you are solely responsible for the trading decisions on your account. There is a very high degree of risk involved in trading. Any information and/or content is intended entirely for research, educational and informational purposes only and does not constitute investment or consultation advice or investment strategy. The information is not tailored to the investment needs of any specific person and therefore does not involve a consideration of any of the investment objectives, financial situation or needs of any viewer that may receive it. Kindly also note that past performance is not a reliable indicator of future results. Actual results may differ materially from those anticipated in forward-looking or past performance statements. We assume no liability as to the accuracy or completeness of any of the information and/or content provided herein and the Company cannot be held responsible for any omission, mistake nor for any loss or damage including without limitation to any loss of profit which may arise from reliance on any information supplied by TFA Global Pte Ltd.
The speaker(s) is neither an employee, agent nor representative of Tradu and is therefore acting independently. The opinions given are their own, constitute general market commentary, and do not constitute the opinion or advice of Tradu or any form of personal or investment advice. Tradu neither endorses nor guarantees offerings of third-party speakers, nor is Tradu responsible for the content, veracity or opinions of third-party speakers, presenters or participants.

AUSSIE H4 | Bullish riseAUD/USD has bounced off the buy entry at 0.6467, which is an overlap support, and could rise to the take-profit level.
Stop is at 0.6423, which is a swing low support.
Take profit is at 0.6541, which is a pullback resistance that aligns with the 61.8% Fibonacci retracement.
High Risk Investment Warning
Trading Forex/CFDs on margin carries a high level of risk and may not be suitable for all investors. Leverage can work against you.
Stratos Markets Limited (tradu.com ):
CFDs are complex instruments and come with a high risk of losing money rapidly due to leverage. 65% of retail investor accounts lose money when trading CFDs with this provider. You should consider whether you understand how CFDs work and whether you can afford to take the high risk of losing your money.
Stratos Europe Ltd (tradu.com ):
CFDs are complex instruments and come with a high risk of losing money rapidly due to leverage. 66% of retail investor accounts lose money when trading CFDs with this provider. You should consider whether you understand how CFDs work and whether you can afford to take the high risk of losing your money.
Stratos Global LLC (tradu.com ):
Losses can exceed deposits.
Please be advised that the information presented on TradingView is provided to Tradu (‘Company’, ‘we’) by a third-party provider (‘TFA Global Pte Ltd’). Please be reminded that you are solely responsible for the trading decisions on your account. There is a very high degree of risk involved in trading. Any information and/or content is intended entirely for research, educational and informational purposes only and does not constitute investment or consultation advice or investment strategy. The information is not tailored to the investment needs of any specific person and therefore does not involve a consideration of any of the investment objectives, financial situation or needs of any viewer that may receive it. Kindly also note that past performance is not a reliable indicator of future results. Actual results may differ materially from those anticipated in forward-looking or past performance statements. We assume no liability as to the accuracy or completeness of any of the information and/or content provided herein and the Company cannot be held responsible for any omission, mistake nor for any loss or damage including without limitation to any loss of profit which may arise from reliance on any information supplied by TFA Global Pte Ltd.
The speaker(s) is neither an employee, agent nor representative of Tradu and is therefore acting independently. The opinions given are their own, constitute general market commentary, and do not constitute the opinion or advice of Tradu or any form of personal or investment advice. Tradu neither endorses nor guarantees offerings of third-party speakers, nor is Tradu responsible for the content, veracity or opinions of third-party speakers, presenters or participants.

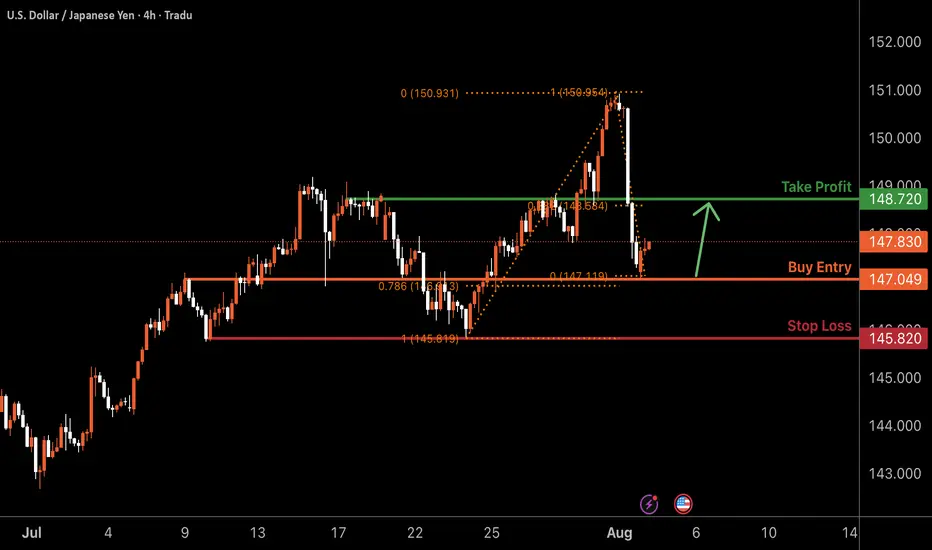
USDJPY H4 | Bullish bounce offBased on the H4 chart analysis, we can see that the price has bounced off the buy entry, which is an overlap support, and could potentially rise further.
Buy entry is at 147.04, which is an overlap support that aligns with the 78.6% Fibonacci retracement.
Stop loss is at 145.82, which is a multi-swing low support.
Take profit is at 148.72, which is a pullback resistance that lines up with the 38.2% Fibonacci retracement.
High Risk Investment Warning
Trading Forex/CFDs on margin carries a high level of risk and may not be suitable for all investors. Leverage can work against you.
Stratos Markets Limited (tradu.com ):
CFDs are complex instruments and come with a high risk of losing money rapidly due to leverage. 65% of retail investor accounts lose money when trading CFDs with this provider. You should consider whether you understand how CFDs work and whether you can afford to take the high risk of losing your money.
Stratos Europe Ltd (tradu.com ):
CFDs are complex instruments and come with a high risk of losing money rapidly due to leverage. 66% of retail investor accounts lose money when trading CFDs with this provider. You should consider whether you understand how CFDs work and whether you can afford to take the high risk of losing your money.
Stratos Global LLC (tradu.com ):
Losses can exceed deposits.
Please be advised that the information presented on TradingView is provided to Tradu (‘Company’, ‘we’) by a third-party provider (‘TFA Global Pte Ltd’). Please be reminded that you are solely responsible for the trading decisions on your account. There is a very high degree of risk involved in trading. Any information and/or content is intended entirely for research, educational and informational purposes only and does not constitute investment or consultation advice or investment strategy. The information is not tailored to the investment needs of any specific person and therefore does not involve a consideration of any of the investment objectives, financial situation or needs of any viewer that may receive it. Kindly also note that past performance is not a reliable indicator of future results. Actual results may differ materially from those anticipated in forward-looking or past performance statements. We assume no liability as to the accuracy or completeness of any of the information and/or content provided herein and the Company cannot be held responsible for any omission, mistake nor for any loss or damage including without limitation to any loss of profit which may arise from reliance on any information supplied by TFA Global Pte Ltd.
The speaker(s) is neither an employee, agent nor representative of Tradu and is therefore acting independently. The opinions given are their own, constitute general market commentary, and do not constitute the opinion or advice of Tradu or any form of personal or investment advice. Tradu neither endorses nor guarantees offerings of third-party speakers, nor is Tradu responsible for the content, veracity or opinions of third-party speakers, presenters or participants.
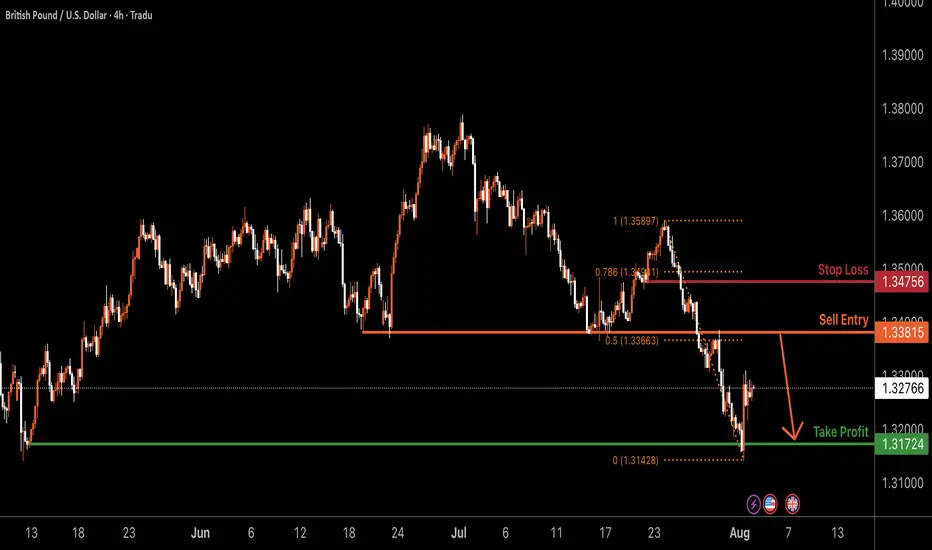
GBPUSD H4 | Bearish reversalThe Cable (GBP/USD) is rising towards the sell entry, which is a pullback resistance, and could reverse to the downside.
Sell entry is at 1.3381, which is a pullback resistance that lines up with the 50% Fibonacci retracement.
Stop is at 1.3475, which is a pullback resistance that is slightly below the 78.6% Fibonacci retracement.
Take profit is at 1.3172, which is a multi swing low support.
High Risk Investment Warning
Trading Forex/CFDs on margin carries a high level of risk and may not be suitable for all investors. Leverage can work against you.
Stratos Markets Limited (tradu.com ):
CFDs are complex instruments and come with a high risk of losing money rapidly due to leverage. 65% of retail investor accounts lose money when trading CFDs with this provider. You should consider whether you understand how CFDs work and whether you can afford to take the high risk of losing your money.
Stratos Europe Ltd (tradu.com ):
CFDs are complex instruments and come with a high risk of losing money rapidly due to leverage. 66% of retail investor accounts lose money when trading CFDs with this provider. You should consider whether you understand how CFDs work and whether you can afford to take the high risk of losing your money.
Stratos Global LLC (tradu.com ):
Losses can exceed deposits.
Please be advised that the information presented on TradingView is provided to Tradu (‘Company’, ‘we’) by a third-party provider (‘TFA Global Pte Ltd’). Please be reminded that you are solely responsible for the trading decisions on your account. There is a very high degree of risk involved in trading. Any information and/or content is intended entirely for research, educational and informational purposes only and does not constitute investment or consultation advice or investment strategy. The information is not tailored to the investment needs of any specific person and therefore does not involve a consideration of any of the investment objectives, financial situation or needs of any viewer that may receive it. Kindly also note that past performance is not a reliable indicator of future results. Actual results may differ materially from those anticipated in forward-looking or past performance statements. We assume no liability as to the accuracy or completeness of any of the information and/or content provided herein and the Company cannot be held responsible for any omission, mistake nor for any loss or damage including without limitation to any loss of profit which may arise from reliance on any information supplied by TFA Global Pte Ltd.
The speaker(s) is neither an employee, agent nor representative of Tradu and is therefore acting independently. The opinions given are their own, constitute general market commentary, and do not constitute the opinion or advice of Tradu or any form of personal or investment advice. Tradu neither endorses nor guarantees offerings of third-party speakers, nor is Tradu responsible for the content, veracity or opinions of third-party speakers, presenters or participants.
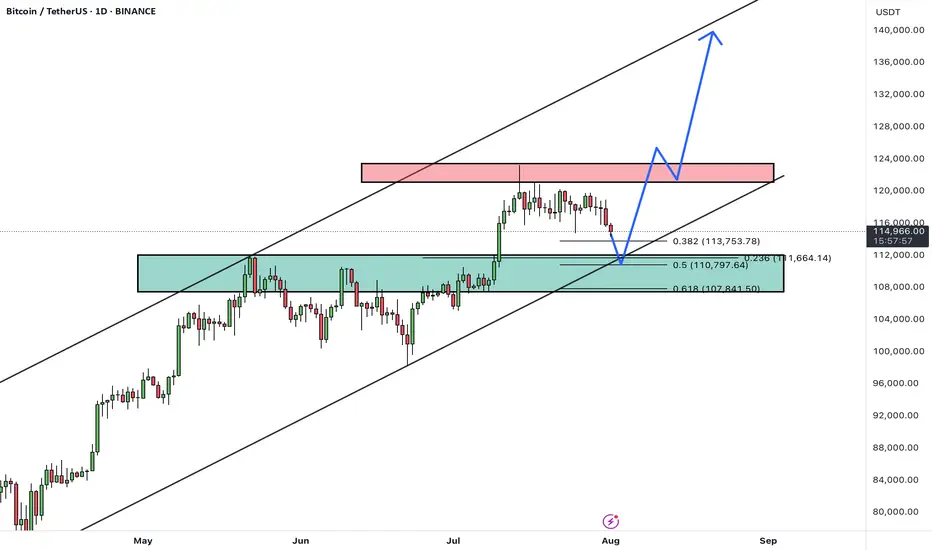
BTCUSDTHello Traders! 👋
What are your thoughts on BITCOIN?
After a strong rally, BTC is currently pulling back from the 124K resistance area, heading toward a major confluence support zone between 108,000– 110,000, which aligns with:
✅ Previous breakout zone
✅ 0.5–0.618 Fibonacci retracement
✅ Lower bound of the ascending channel
This level is expected to attract buyers and act as a base for a new bullish leg.
Scenario Ahead (Main Bias):
1. Price dips into the 108–110K support
2. Bullish reversal from the zone (watch for strong reaction candles or bullish divergence)
3. Target 1: 124K (retest resistance)
4. Target 2: 135K–140K (upper channel boundary upon breakout)
BTC remains in a healthy bullish structure. Current pullback is considered constructive, and the 107–110K zone offers a high-probability long setup. Watch for bullish signals before entering.
A confirmed daily close below 107K would invalidate this bullish structure and expose BTC to deeper correction levels.
What’s your take on this setup? Do you expect a bounce from support or a deeper correction? Share your thoughts below 👇
Don’t forget to like and share your thoughts in the comments! ❤️
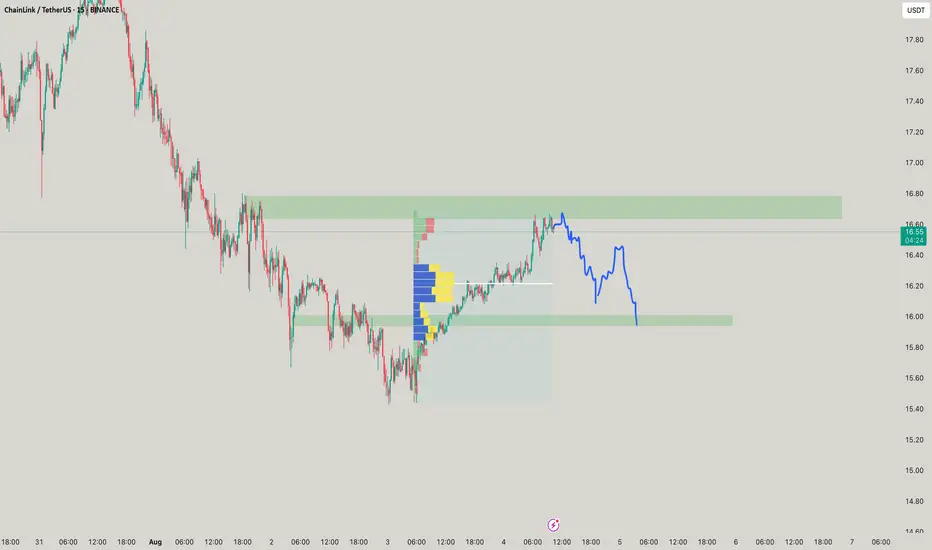

SOL - He is Soul-less now!SOL - being moved to the point but i think it will retrace back and ideal buys positions are not intact!

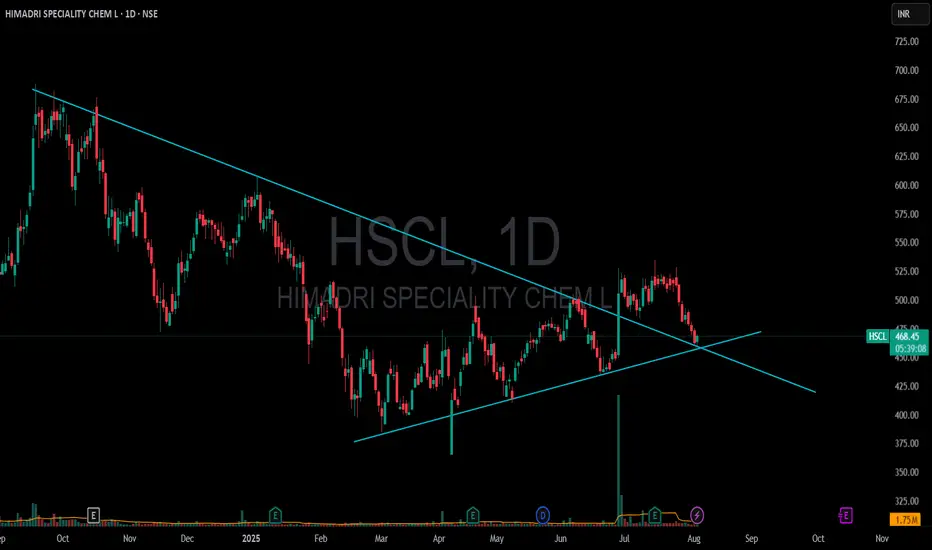
HSCL 1DHSCL (Hindustan Steelworks Construction Ltd) is currently trading around ₹467 and you've identified a triangle pattern with a target of ₹900, here’s a brief technical analysis validation and strategy breakdown:
🔺 Triangle Pattern Overview
A triangle pattern (ascending, descending, or symmetrical) typically signals a consolidation before a breakout. If you're seeing a breakout, here's how to approach it:
✅ Trade Setup (Post-Breakout)
Current Price: ₹467
Chart Pattern: Triangle (you didn’t mention if it's symmetrical/ascending/descending – assuming symmetrical)
Breakout Direction: Upward
Target: ₹900
Stop Loss (SL): Just below breakout point or previous swing low (e.g., around ₹430–440, depending on chart)
📏 Target Justification
Measure the height of the triangle at its widest part.
Add that height to the breakout point to calculate the target.
Example:
Triangle base: ₹300 to ₹450 → Height = ₹150
Breakout point = ₹450
Target = ₹450 + ₹150 = ₹600 (conservative)
So ₹900 implies a long-term multi-wave move, or it could be based on logarithmic projection/fundamentals.
📊 Trading Strategy
Signal Level
Entry ₹467 (confirmed breakout above triangle)
Stop Loss ₹430–440 (below last swing or triangle base)
Short-Term Target ₹600–650
Long-Term Target ₹900
Risk:Reward 1:3+
⚠️ Important Notes
Volume confirmation is key during the breakout.
If it's a false breakout, price may fall back into triangle range.
₹900 is almost 2x current price – which suggests either:
A very long-term target
Or influenced by fundamental developments, such as new orders or PSU restructuring news.
Disclaimer: The information provided is for educational and informational purposes only and should not be considered as financial advice. Investing in the stock market involves risk, and past performance is not indicative of future results. Please consult with a certified financial advisor or conduct your own research before making any investment decisions. We are not responsible for any losses incurred as a result of using this information. Stock market investments are subject to market risks; read all related documents carefully.
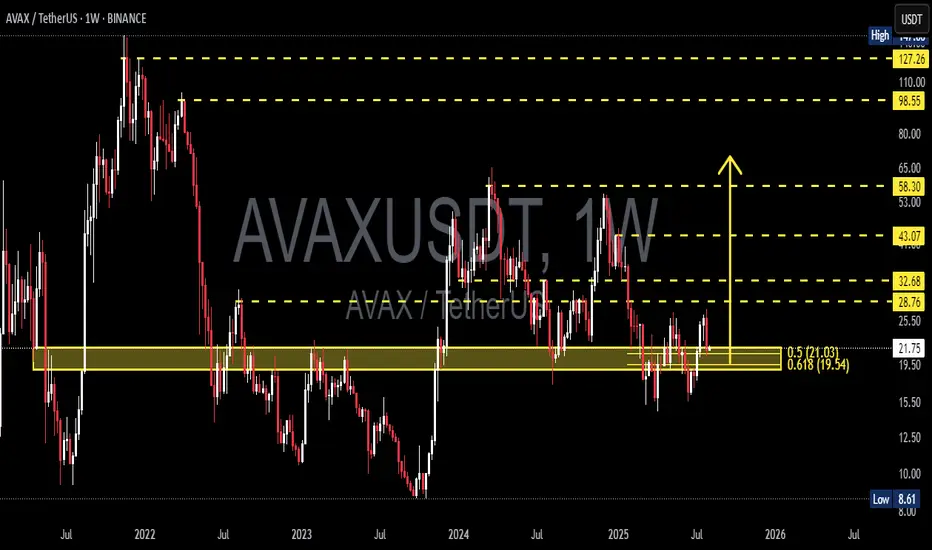
AVAX at the Edge: Golden Pocket Support or Breakdown Incoming?🧠 Overview:
AVAX is currently trading at a decisive support zone, aligned perfectly with the Fibonacci golden pocket (0.5–0.618) at $21.03–$19.54. This level has historically acted as a strong pivot zone, serving both as resistance during bear markets and support in bullish recoveries.
The market has compressed into this key demand zone after a prolonged sideways structure. Now, all eyes are on how price will react — this zone will likely determine AVAX's mid-to-long-term trend.
---
🔍 Key Technical Highlights:
🔸 Fibonacci Confluence Zone (Golden Pocket):
0.5 Fib Level: $21.03
0.618 Fib Level: $19.54
This area coincides with a weekly demand block — a high-probability reversal zone where buyers have historically stepped in.
🔸 Major Resistance Levels to Watch:
$28.76 – First significant supply zone.
$32.68 – Previous lower high, potential breakout confirmation zone.
$43.07 – Weekly structure resistance.
$58.30 – Mid-term bullish target.
🔸 Support Levels Below:
$15.00 – Local base during early 2023.
$8.61 – Multi-year low (critical support if demand collapses).
🔸 Structure Insight:
Price is currently forming a macro higher low, suggesting a potential accumulation phase. However, failure to hold this zone could trigger a bearish continuation.
---
🚀 Bullish Scenario:
If price sustains above $19.54–21.03 and breaks above $25.50, the following upside targets could be reached:
1. $28.76 – Local resistance
2. $32.68 – Break of bearish structure
3. $43.07 – Momentum extension
4. $58.30 – Bullish macro target
Catalyst to watch: Weekly bullish engulfing candle + volume spike + break of structure → these would confirm buyers are in control.
---
🔻 Bearish Scenario:
If the price breaks below $19.54 with strong bearish volume, then:
1. $15.00 – First zone of interest for buyers
2. $8.61 – Critical long-term support zone
This would confirm a distribution pattern and signal that the market may revisit lower accumulation zones before any major uptrend resumes.
---
🧩 Market Psychology Insight:
This current range is where smart money positions themselves — either for continuation or reversal. Retail traders often get shaken out in this kind of compression. Stay patient and wait for confirmation rather than anticipation.
---
🎯 Conclusion:
AVAX is now at a make-or-break point. With the price sitting in a high-confluence demand zone, traders should prepare for volatility and monitor weekly closes. A strong move in either direction will likely determine the next multi-week trend.
> “The bigger the base, the higher in space.” – If this is true accumulation, the upside could surprise many.
#AVAX #AVAXUSDT #CryptoTechnicalAnalysis #AltcoinWatch #FibonacciLevels #SupportResistance #BullishOrBearish #SmartMoneyZone #WeeklyChart #CryptoTrading #BreakoutOrBreakdown
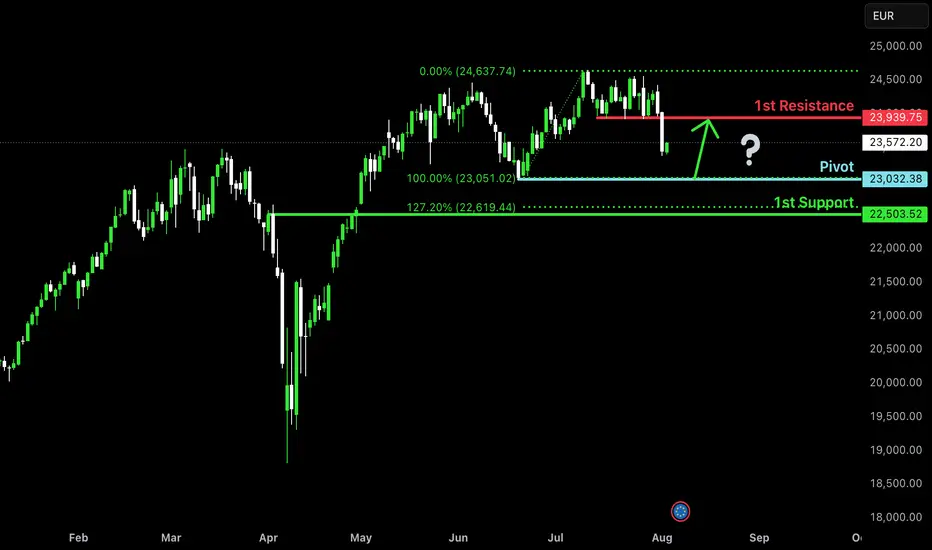
Potential bullish bounce?DAX40 (DE40) is falling towards the pivot, which has been identified as a swing low support and could bounce to the 1st resistance, which is a pullback resistance.
Pivot: 23,032.38
1st Support: 22,503.52
1st Resistance: 23,939.75
Risk Warning:
Trading Forex and CFDs carries a high level of risk to your capital and you should only trade with money you can afford to lose. Trading Forex and CFDs may not be suitable for all investors, so please ensure that you fully understand the risks involved and seek independent advice if necessary.
Disclaimer:
The above opinions given constitute general market commentary, and do not constitute the opinion or advice of IC Markets or any form of personal or investment advice.
Any opinions, news, research, analyses, prices, other information, or links to third-party sites contained on this website are provided on an "as-is" basis, are intended only to be informative, is not an advice nor a recommendation, nor research, or a record of our trading prices, or an offer of, or solicitation for a transaction in any financial instrument and thus should not be treated as such. The information provided does not involve any specific investment objectives, financial situation and needs of any specific person who may receive it. Please be aware, that past performance is not a reliable indicator of future performance and/or results. Past Performance or Forward-looking scenarios based upon the reasonable beliefs of the third-party provider are not a guarantee of future performance. Actual results may differ materially from those anticipated in forward-looking or past performance statements. IC Markets makes no representation or warranty and assumes no liability as to the accuracy or completeness of the information provided, nor any loss arising from any investment based on a recommendation, forecast or any information supplied by any third-party.
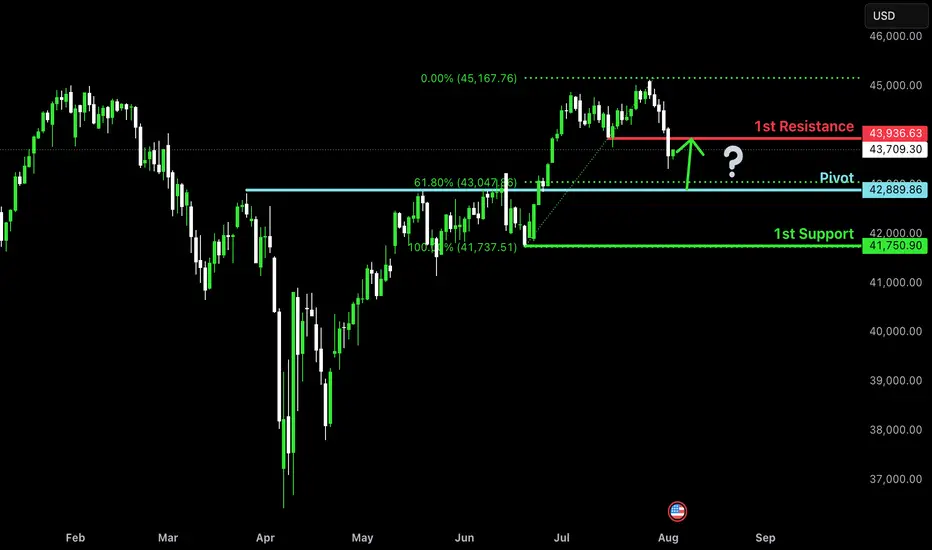
Falling towards pullback support?Dow Jones (US30) is falling towards the pivot and could bounce to the 1st resistance.
Pivot: 42,889.86
1st Support: 41,750.90
1st Resistance: 43,936.63
Risk Warning:
Trading Forex and CFDs carries a high level of risk to your capital and you should only trade with money you can afford to lose. Trading Forex and CFDs may not be suitable for all investors, so please ensure that you fully understand the risks involved and seek independent advice if necessary.
Disclaimer:
The above opinions given constitute general market commentary, and do not constitute the opinion or advice of IC Markets or any form of personal or investment advice.
Any opinions, news, research, analyses, prices, other information, or links to third-party sites contained on this website are provided on an "as-is" basis, are intended only to be informative, is not an advice nor a recommendation, nor research, or a record of our trading prices, or an offer of, or solicitation for a transaction in any financial instrument and thus should not be treated as such. The information provided does not involve any specific investment objectives, financial situation and needs of any specific person who may receive it. Please be aware, that past performance is not a reliable indicator of future performance and/or results. Past Performance or Forward-looking scenarios based upon the reasonable beliefs of the third-party provider are not a guarantee of future performance. Actual results may differ materially from those anticipated in forward-looking or past performance statements. IC Markets makes no representation or warranty and assumes no liability as to the accuracy or completeness of the information provided, nor any loss arising from any investment based on a recommendation, forecast or any information supplied by any third-party.
#Nifty directions and levels for August 4th:Good morning, friends! 🌞
Here are the market directions and levels for August 4th:
The global market (based on the Dow Jones) has shown a moderately bearish sentiment,
while the local market continues to display a bearish tone. However, today, Gift Nifty indicates a positive opening.
What can we expect today?
In the previous session, both Nifty and Bank Nifty closed with a negative bias.
However, today’s market is indicating a gap-up start of around 80 points. Structurally, if this gap-up doesn't sustain,
we can expect the correction to continue, possibly with some consolidation.
On the other hand, if the gap-up sustains and breaks the 38% Fibonacci level with a solid candle or after some consolidation,
we can expect a pullback of at least 50% to 78% in the minor swing.
In this case, even if the market takes a pullback but fails to break the 38% Fibonacci level,
another round of correction may follow.

#Banknifty directions and levels for August 4th:
What can we expect today?
In the previous session, both Nifty and Bank Nifty closed with a negative bias.
However, today’s market is indicating a gap-up start of around 80 points. Structurally, if this gap-up doesn't sustain,
we can expect the correction to continue, possibly with some consolidation.
On the other hand, if the gap-up sustains and breaks the 38% Fibonacci level with a solid candle or after some consolidation,
we can expect a pullback of at least 50% to 78% in the minor swing.
In this case, even if the market takes a pullback but fails to break the 38% Fibonacci level,
another round of correction may follow.

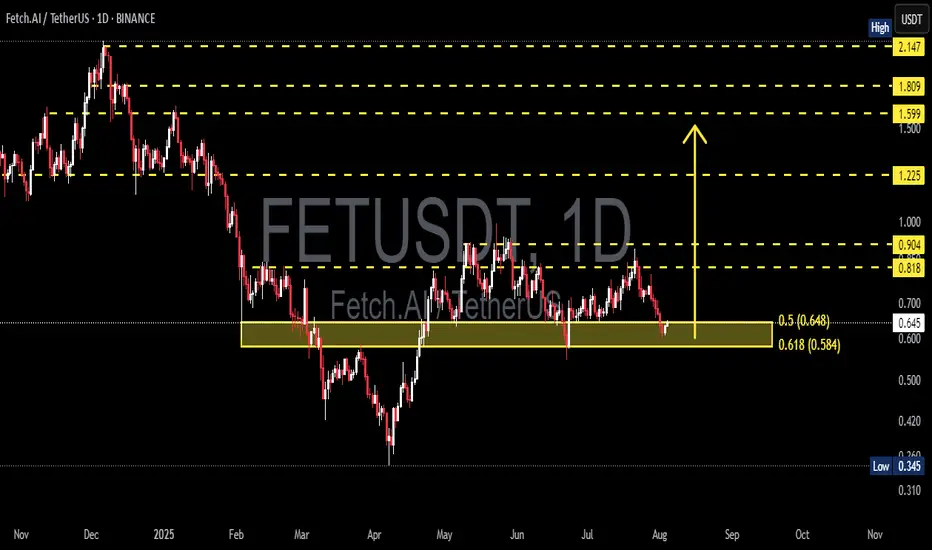
FET/USDT Testing Fibonacci – Bounce Incoming or Breakdown Ahead?📊 Technical Analysis Overview:
FET/USDT is currently testing a strong demand zone aligned with the Fibonacci Retracement 0.5 – 0.618 levels, specifically between $0.648 and $0.584. This “golden pocket” area is historically significant and often acts as a pivot zone for price reversals.
🔍 Chart Pattern:
The price formed a series of higher highs and higher lows from March to June, indicating a bullish structure.
Since July, momentum has weakened, and the price has corrected back into the key support zone that previously acted as a base for a rally.
---
📈 Bullish Scenario:
If price holds above $0.584 and forms a reversal candlestick (e.g., bullish engulfing or hammer), a strong rebound is likely.
Key upside targets:
$0.818 (minor resistance)
$0.904 (psychological level)
Potential breakout toward $1.225 if bullish volume returns.
📉 Bearish Scenario:
A decisive breakdown below $0.584 with high volume could trigger further downside toward:
$0.42 – $0.345 (next major support zone)
This move could confirm a bearish continuation pattern such as a descending triangle if resistance continues to hold.
---
🎯 Strategic Outlook:
The current zone is a make-or-break level, and the market is at a decision point. Traders should wait for a clear confirmation through price action and volume before committing to directional trades.
#FETUSDT #CryptoAnalysis #FibonacciSupport #AltcoinSetup #FetchAI #TechnicalOutlook #BullishOrBearish #SupportZone #GoldenPocket
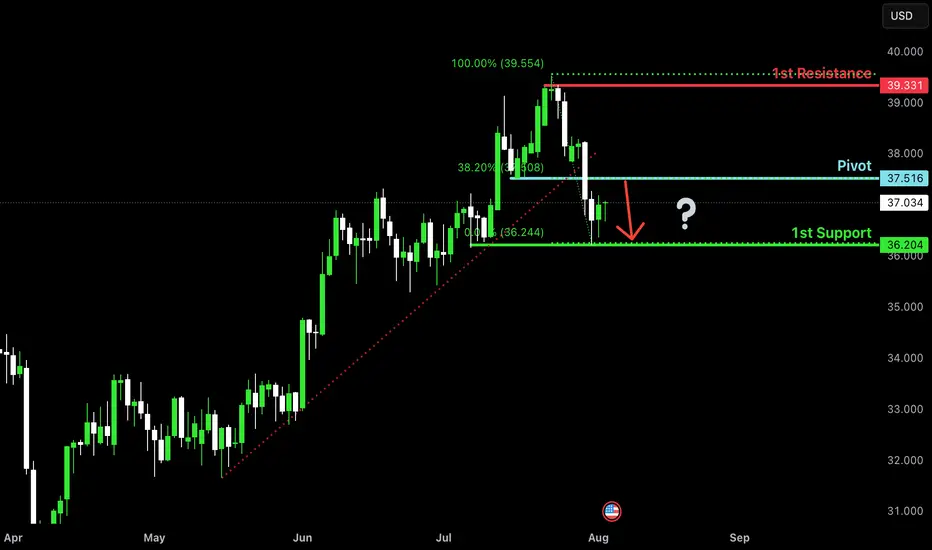
Bearish reversal for the Silver?The price is rising towards the pivot and could reverse to the pullback support.
Pivot: 37.51
1st Support: 36.20
1st Resistance: 39.33
Risk Warning:
Trading Forex and CFDs carries a high level of risk to your capital and you should only trade with money you can afford to lose. Trading Forex and CFDs may not be suitable for all investors, so please ensure that you fully understand the risks involved and seek independent advice if necessary.
Disclaimer:
The above opinions given constitute general market commentary, and do not constitute the opinion or advice of IC Markets or any form of personal or investment advice.
Any opinions, news, research, analyses, prices, other information, or links to third-party sites contained on this website are provided on an "as-is" basis, are intended only to be informative, is not an advice nor a recommendation, nor research, or a record of our trading prices, or an offer of, or solicitation for a transaction in any financial instrument and thus should not be treated as such. The information provided does not involve any specific investment objectives, financial situation and needs of any specific person who may receive it. Please be aware, that past performance is not a reliable indicator of future performance and/or results. Past Performance or Forward-looking scenarios based upon the reasonable beliefs of the third-party provider are not a guarantee of future performance. Actual results may differ materially from those anticipated in forward-looking or past performance statements. IC Markets makes no representation or warranty and assumes no liability as to the accuracy or completeness of the information provided, nor any loss arising from any investment based on a recommendation, forecast or any information supplied by any third-party.
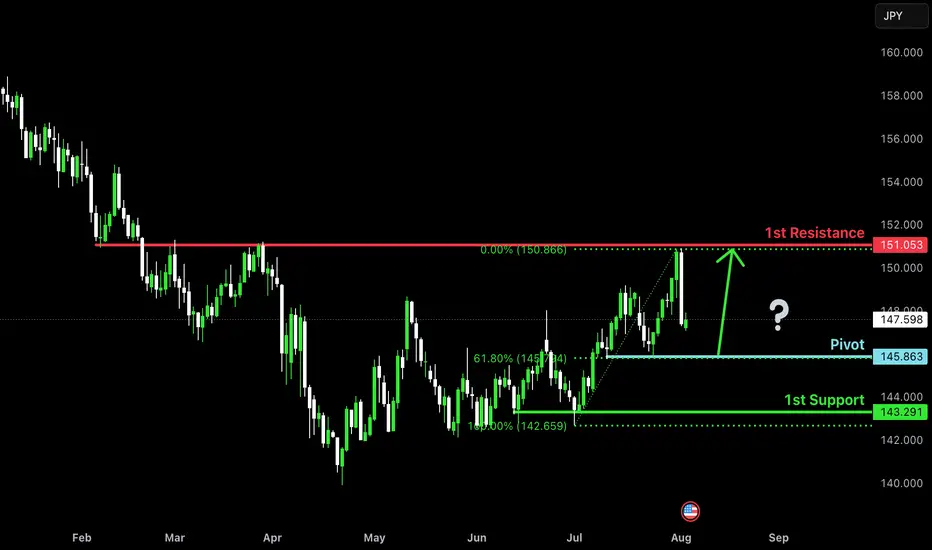
Bullish bounce off pullback support?USD/JPY is falling towards the pivot, which is a pullback support and could bounce to the 1st resistance.
Pivot: 145.86
1st Support: 143.29
1st Resistance: 151.05
Risk Warning:
Trading Forex and CFDs carries a high level of risk to your capital and you should only trade with money you can afford to lose. Trading Forex and CFDs may not be suitable for all investors, so please ensure that you fully understand the risks involved and seek independent advice if necessary.
Disclaimer:
The above opinions given constitute general market commentary, and do not constitute the opinion or advice of IC Markets or any form of personal or investment advice.
Any opinions, news, research, analyses, prices, other information, or links to third-party sites contained on this website are provided on an "as-is" basis, are intended only to be informative, is not an advice nor a recommendation, nor research, or a record of our trading prices, or an offer of, or solicitation for a transaction in any financial instrument and thus should not be treated as such. The information provided does not involve any specific investment objectives, financial situation and needs of any specific person who may receive it. Please be aware, that past performance is not a reliable indicator of future performance and/or results. Past Performance or Forward-looking scenarios based upon the reasonable beliefs of the third-party provider are not a guarantee of future performance. Actual results may differ materially from those anticipated in forward-looking or past performance statements. IC Markets makes no representation or warranty and assumes no liability as to the accuracy or completeness of the information provided, nor any loss arising from any investment based on a recommendation, forecast or any information supplied by any third-party.
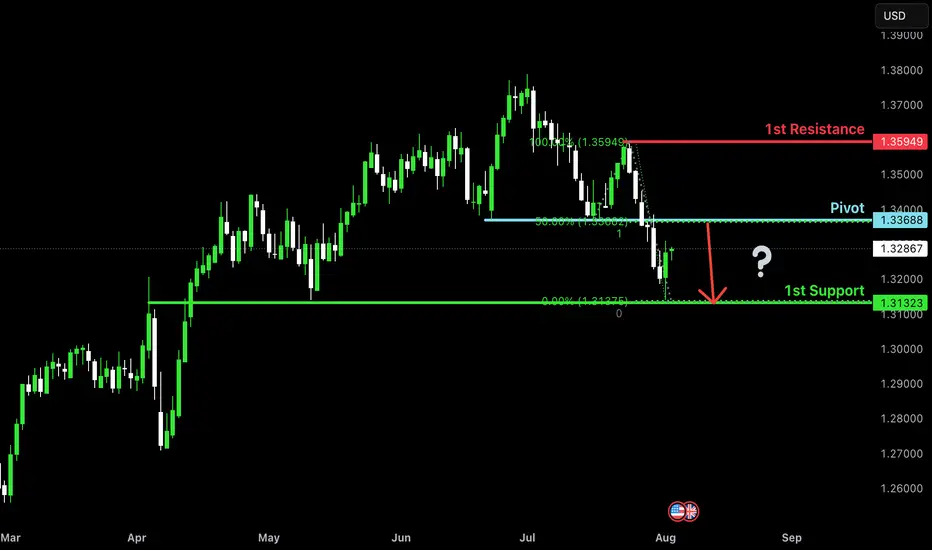
Heading into pullback resistance?The Cable (GBP/USD) is rising towards the pivot, which has been identified as a pullback resistance and could reverse to the 1st support, which acts as an overlap support.
Pvot: 1.3368
1st Support: 1.3132
1st Resistance: 1.3594
Risk Warning:
Trading Forex and CFDs carries a high level of risk to your capital and you should only trade with money you can afford to lose. Trading Forex and CFDs may not be suitable for all investors, so please ensure that you fully understand the risks involved and seek independent advice if necessary.
Disclaimer:
The above opinions given constitute general market commentary, and do not constitute the opinion or advice of IC Markets or any form of personal or investment advice.
Any opinions, news, research, analyses, prices, other information, or links to third-party sites contained on this website are provided on an "as-is" basis, are intended only to be informative, is not an advice nor a recommendation, nor research, or a record of our trading prices, or an offer of, or solicitation for a transaction in any financial instrument and thus should not be treated as such. The information provided does not involve any specific investment objectives, financial situation and needs of any specific person who may receive it. Please be aware, that past performance is not a reliable indicator of future performance and/or results. Past Performance or Forward-looking scenarios based upon the reasonable beliefs of the third-party provider are not a guarantee of future performance. Actual results may differ materially from those anticipated in forward-looking or past performance statements. IC Markets makes no representation or warranty and assumes no liability as to the accuracy or completeness of the information provided, nor any loss arising from any investment based on a recommendation, forecast or any information supplied by any third-party.
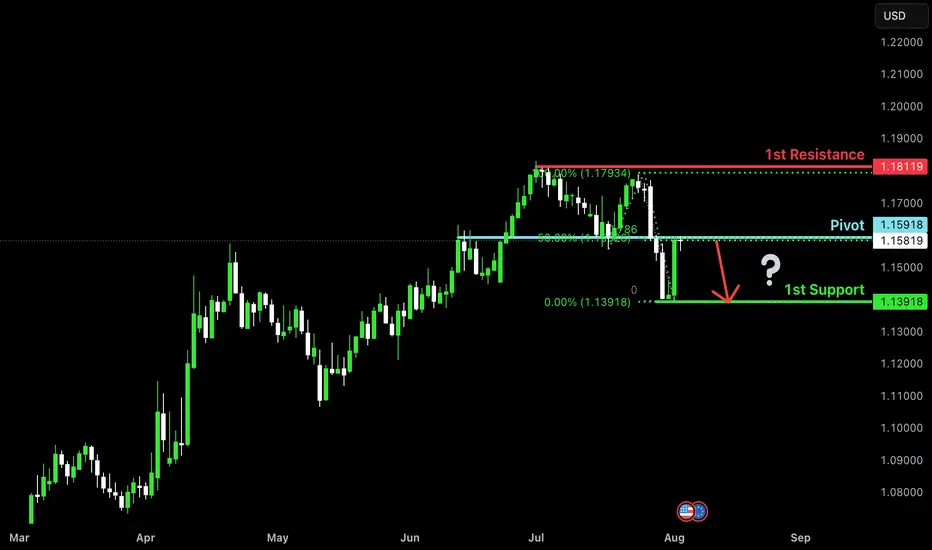
Bearish reversal off 50% Fibonacci resistance?The Fiber is reacting off the pivot, which acts as an overlap resistance that lines up with the 50% Fibonacci retracement and could reverse to the 1st support.
Pivot: 1.1691
1st Support: 1.1391
1st Resistance: 1.1811
Risk Warning:
Trading Forex and CFDs carries a high level of risk to your capital and you should only trade with money you can afford to lose. Trading Forex and CFDs may not be suitable for all investors, so please ensure that you fully understand the risks involved and seek independent advice if necessary.
Disclaimer:
The above opinions given constitute general market commentary, and do not constitute the opinion or advice of IC Markets or any form of personal or investment advice.
Any opinions, news, research, analyses, prices, other information, or links to third-party sites contained on this website are provided on an "as-is" basis, are intended only to be informative, is not an advice nor a recommendation, nor research, or a record of our trading prices, or an offer of, or solicitation for a transaction in any financial instrument and thus should not be treated as such. The information provided does not involve any specific investment objectives, financial situation and needs of any specific person who may receive it. Please be aware, that past performance is not a reliable indicator of future performance and/or results. Past Performance or Forward-looking scenarios based upon the reasonable beliefs of the third-party provider are not a guarantee of future performance. Actual results may differ materially from those anticipated in forward-looking or past performance statements. IC Markets makes no representation or warranty and assumes no liability as to the accuracy or completeness of the information provided, nor any loss arising from any investment based on a recommendation, forecast or any information supplied by any third-party.
USDJPY a reduction in the density of long tradesWe analyzes the structure of market behavior and identifies a class of typical weak patterns: a reduction in the density of long trades, a gradual downward shift in volume, and a lack of dominant driving logic in the market. The currency pair has shown a pattern of "not deep enough to fall, not high enough to bounce" around several key psychological levels, which is a reflection of the gradual dominance of short-side funds.
We scored semantic models on multiple social media platforms and found that investors are experiencing a shift in sentiment from "neutral wait-and-see" to "pessimistic risk aversion". At the same time, the spread of short positions identified by the system has increased, implying that not only professional investors, but also some small and medium-sized traders have begun to be bearish.
The long-short momentum distribution curve shows the cumulative advantage of the short side, and the lack of substantial positive catalyst, the probability of reversal in the short term is low.
