VIRTUAL/USDT – Rebound Incoming or Deeper Collapse?🔍 Overview: Bearish Pressure, But Structure Holds
VIRTUAL/USDT is currently consolidating within a well-defined Descending Channel pattern that has been forming since early May 2025. While the trend is bearish, price action remains within a controlled structure — a potential sign of hidden accumulation or smart-money positioning.
What makes this setup compelling is that price has just touched the lower boundary of the channel while also interacting with a historical demand zone around 1.20–1.25 USDT, which previously triggered a strong rally back in May.
---
🧠 Key Technical Pattern: Descending Channel + Historical Demand Zone
Descending Channel → Suggests consistent selling pressure but within a structured range — no real breakdown yet.
Demand Zone (1.20 – 1.25 USDT) → A historically strong support level that has launched sharp upward moves in the past.
Decreasing Volume → Could indicate weakening bearish momentum as price approaches key support.
---
📈 Bullish Scenario (Bounce from Support):
If the price manages to hold and forms a reversal signal (such as a bullish engulfing or hammer candle), we could see a relief rally toward key resistance levels.
🎯 Potential Bullish Targets:
1. 1.6787 USDT – Mid-channel resistance
2. 1.9000 USDT – Psychological and structural resistance
3. 2.0848 – 2.4571 USDT – Horizontal resistance zone and top of the channel
4. 3.7620 – 4.6267 USDT – Extended targets if breakout occurs with volume
📌 Bullish Confirmation Needed: A strong breakout above the channel midpoint + increasing volume to confirm a potential trend reversal.
---
📉 Bearish Scenario (Breakdown from Channel):
If the price fails to hold above the 1.20–1.25 support and breaks below the channel support, we may see increased selling pressure and a continuation of the downtrend.
🎯 Downside Targets:
1.00 USDT – Psychological support
0.90 – 0.70 USDT – Previous accumulation range
0.4110 USDT – All-time low and ultimate downside target
🚨 A strong breakdown with high volume could trigger panic selling and a prolonged bearish leg.
---
🎯 Conclusion:
> VIRTUAL/USDT is at a pivotal decision point — hold and bounce, or break and slide.
The structure is still intact, and the price is testing two critical technical zones simultaneously: the descending channel support and a major demand area.
This is not the time to chase price, but to observe and prepare for confirmation. A strong signal here could set the tone for the next major move.
#VirtualUSDT #CryptoTechnicalAnalysis #DescendingChannel #DemandZone #ReversalSignal #AltcoinAnalysis #CryptoTradingSetup #PriceActionTrading #SupportResistance
Harmonic Patterns

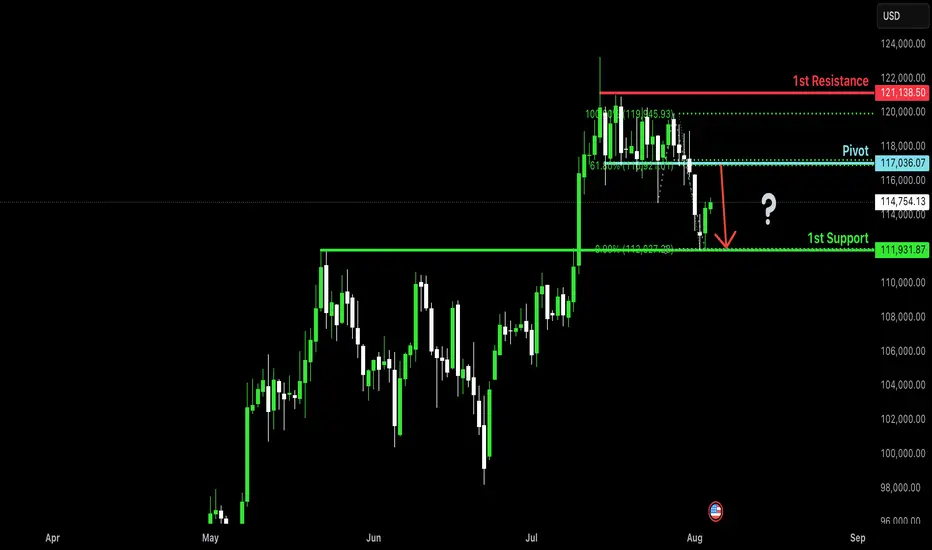
Bearish reversal?The Bitcoin (BTC/USD) is rising towards the pivot and could reverse to the 1st support.
Pivot: 117,036.07
1st Support: 111,931.87
1st Resistance: 121,138.50
Risk Warning:
Trading Forex and CFDs carries a high level of risk to your capital and you should only trade with money you can afford to lose. Trading Forex and CFDs may not be suitable for all investors, so please ensure that you fully understand the risks involved and seek independent advice if necessary.
Disclaimer:
The above opinions given constitute general market commentary, and do not constitute the opinion or advice of IC Markets or any form of personal or investment advice.
Any opinions, news, research, analyses, prices, other information, or links to third-party sites contained on this website are provided on an "as-is" basis, are intended only to be informative, is not an advice nor a recommendation, nor research, or a record of our trading prices, or an offer of, or solicitation for a transaction in any financial instrument and thus should not be treated as such. The information provided does not involve any specific investment objectives, financial situation and needs of any specific person who may receive it. Please be aware, that past performance is not a reliable indicator of future performance and/or results. Past Performance or Forward-looking scenarios based upon the reasonable beliefs of the third-party provider are not a guarantee of future performance. Actual results may differ materially from those anticipated in forward-looking or past performance statements. IC Markets makes no representation or warranty and assumes no liability as to the accuracy or completeness of the information provided, nor any loss arising from any investment based on a recommendation, forecast or any information supplied by any third-party.
GBPUSD currency to reach a more consistent bearish expectationsOur analysis found that the current market for the future trend of the currency to reach a more consistent bearish expectations, mainly benefited from the improvement of macroeconomic indicators and liquidity environment easing.
We combined with news and professional analysis reports, identified "policy support", "economic recovery" and other key words accounted for a significant increase in the proportion of market participants in a positive mood, promoting the formation of a long atmosphere.
The capital flow model shows that cross-border capital inflows have increased, and institutional investors are gradually increasing their holdings of the currency, indicating that there is sufficient support on the capital side to enhance the sustained upward momentum of the price.
It is recommended that investors combine the signals from our system to reasonably plan the position layout, especially in the market adjustment to grasp the timing of entry and achieve cost optimization.
Position Management Recommendations:
Layout in batches, control the overall position ratio, avoid over-concentration, and pay attention to risk points in time to ensure capital safety.

EURUSD policy expectations and risk appetite resonanceAccording to our latest reasoning, the current FX market is entering a structural repair phase driven by policy expectations and risk appetite resonance. Although there is still some uncertainty in the macro environment, a number of leading indicators show that market confidence has begun to gradually repair, with some currency pairs showing stronger upward momentum.
After semantic modeling of news headlines and social buzzwords, we found that positive terms such as "capital reflows", "inflation under control" and "policy clarity" were significantly higher in the keywords related to the currency. The positive terms such as "capital flow back", "inflation control" and "clear policy" were found to be significantly increased. Combined with the market trading behavior data, the system identifies that the long position building behavior has increased, and the ma
We believes that the current market is suitable for adding positions in batches on the low side while controlling risks, especially when short-term market oscillations intensify, and investors can optimize the pace of entry by combining the real-time volatility scoring.

XAUUSD there is no clear trend expectationsThe way we trade our system monitors that the gold market is in a clear structural window. The current market lack of macro shock events, there is no clear trend expectations, resulting in gold into the "no main line, no support" vacuum zone. This stage is usually characterized by price repetition, sparse transactions and inefficient trading.
AI further identifies that the volume of gold social opinion topics has declined, and the heat of search and position attention has continued to fall. This indicates a widespread lack of market interest and confidence in gold, a typical signal of a phase of ebb and flow.
The operation strategy is recommended to reduce positions, short positions, not recommended to build more in the short term. If you are already in the market, you can cope with the systemic volatility by increasing the level of risk control and narrowing the stop-loss range. We recommend continuing to closely track early signals from AI of momentum restart or sentiment focus in order to respond quickly when conditions are right.

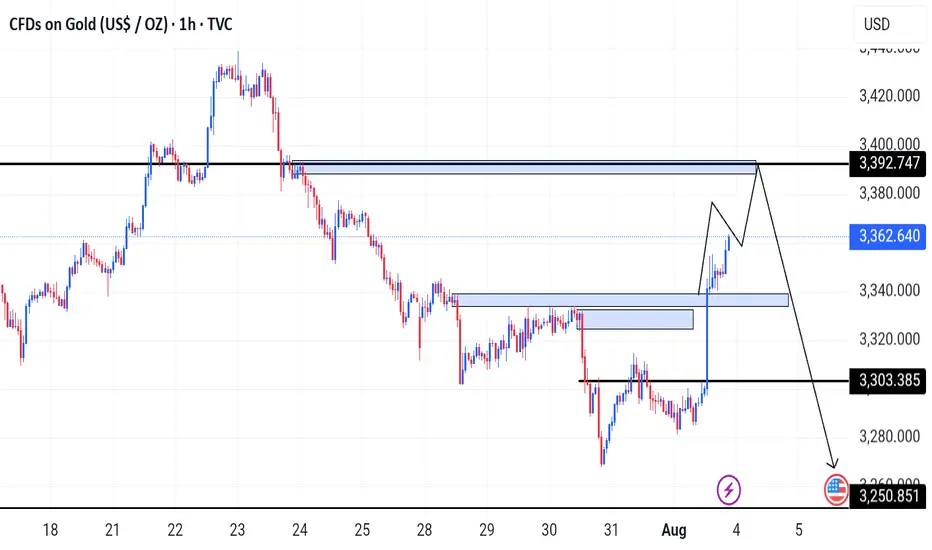
Gold Trading Opportunity
---
### ⚡️ **– Harmonic Setup You Don’t Want to Miss**
🚨 **"We’re standing at the edge of a golden reversal!"**
The *Gartley* and *Deep Crab* harmonic patterns have formed with stunning precision, signaling a powerful potential drop*. This level is not just a number—it’s a pressure point where a reversal pattern converges with a high-volume **supply zone**, amplified by a strong **RSI overbought signal**.
💼 With disciplined **risk management** and clearly defined **stop-loss and multi-tier targets**, we’re positioning ourselves for a calculated and confident short move.
This is not guesswork—it’s a textbook setup backed by structure, momentum, and sentiment.
🔥 Don’t chase the market. Let it come to you. This setup rewards patience and precision.
---

ETH: Ready to ride a powerful long-term wave from the bottomETH: Ready to ride a powerful long-term wave from the bottom
.
A necessary backtesting phase — to take profits, to rest, to strengthen the trend, to assess supply and demand, and to accumulate more positions in preparation for a long-term move... So, is a correction a risk or an opportunity?
.
US STOCKS- WALL STREET DREAM- LET'S THE MARKET SPEAK!


XLMUSDT 1H Market OutlookBINANCE:XLMUSDT
Trade Setup:
Target 1: 0.4513
Target 2: 0.4872
Target 3: 0.5231
Target 4: 0.1808
Stop Loss: 0.3795
Pattern: The chart indicates a "CHOCH" (Change of Character) pattern, suggesting a potential trend reversal or continuation depending on context.
Trend: Recent price action shows an upward movement after a dip, with the price approaching the entry level.

xauusd mondayMain Structure:
Trend: Bullish (clear CHoCH + BOS to the upside).
Liquidity sweep:
BSL (Buy Side Liquidity) above 3377 has been taken.
SSL (Sell Side Liquidity) below is likely the next short-term target for a retracement before continuation.
🧱 Key Levels:
Breaker Block – now acting as valid support. Price has already retested and rejected strongly.
Central Range Liquidity (POI) – optimal retracement area (around 3341.89), potential magnet zone for price.
Blue Box (Demand Zone) – a solid confluence area for long entries.
🧩 Expected Price Action (Scenario):
Short pullback: into the POI (Central Range Liquidity) → bullish rejection.
Small accumulation: minor range building → takes out minor SSL.
Bullish continuation: targeting previous BSL and possibly expanding into premium areas (3377–3390).
📍 Additional Notes:
Market structure confirms a bullish bias. So the plan is to buy the dip at the POI and breaker block zone.
If price breaks below the demand zone and breaker block, this setup is invalidated. Expect deeper retracement to around 3320 or the larger blue demand zone.
✅ Trade Plan Summary:
Element Value
Entry Around 3341–3345
Stop Loss Below 3329 (invalidation zone)
TP1 3366 (initial reaction)
TP2 3374–3380 (clean BSL)
TP3 3390++ (expansion target)
Let me know if you want me to turn this into a daily Gold template so you can match each New York session setup easily. Shall we build it? 🔥👑

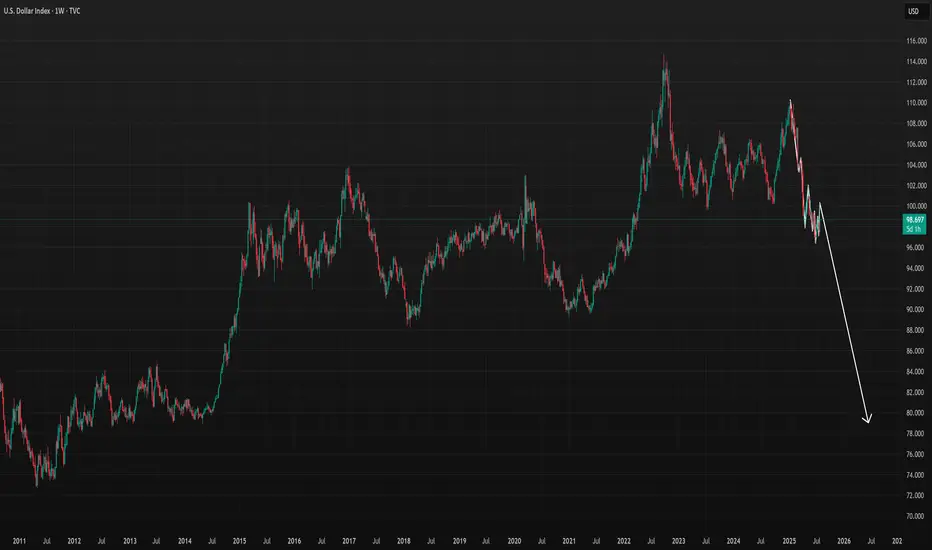
DXY to go extremely low due to Tariffs and Market ManipulationDXY to go extremely low due to Tariffs and Market Manipulation Reports
- The US Debt is almost over $38 Trillion in under 3 months
- Continue to monitor for weekly bearish signals on the chart
TVC:DXY
OANDA:USDCAD
OANDA:NZDUSD
Bullish Divergence appearing!2222 - Closed at 24 (03-08-2025)
Currently in Downtrend.
However, Bullish Divergence has
started appearing on Bigger tf.
Bearish ABCD pattern target seems to
be around 22 - 23 & it may reverse from
that point. But Confirmation will be
required before taking position. Otherwise,
Next possible Support level can be around 20 - 20.50.
Immediate Resistance seems to be around 25 - 26.
It needs to cross & sustain 29 to start its Uptrend.

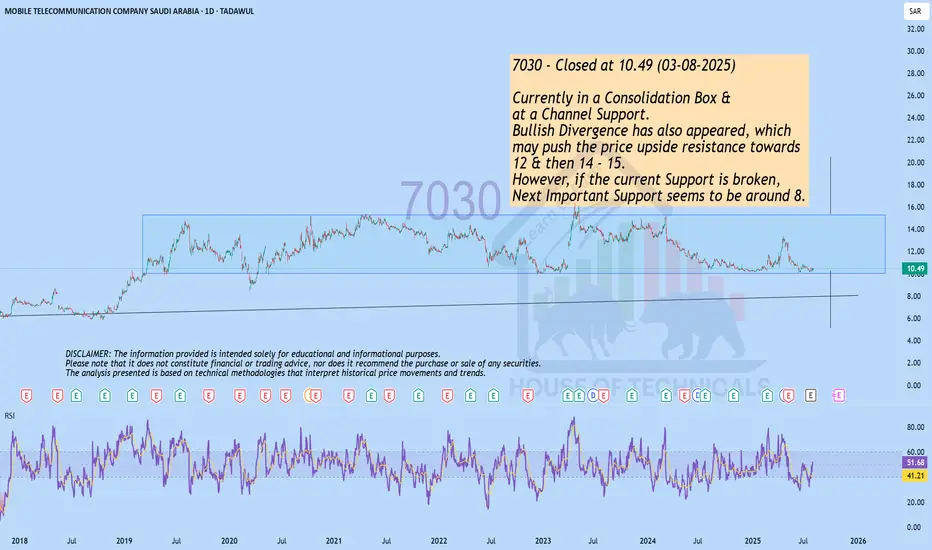
Currently in a Consolidation Box &..7030 - Closed at 10.49 (03-08-2025)
Currently in a Consolidation Box &
at a Channel Support.
Bullish Divergence has also appeared, which
may push the price upside resistance towards
12 & then 14 - 15.
However, if the current Support is broken,
Next Important Support seems to be around 8.
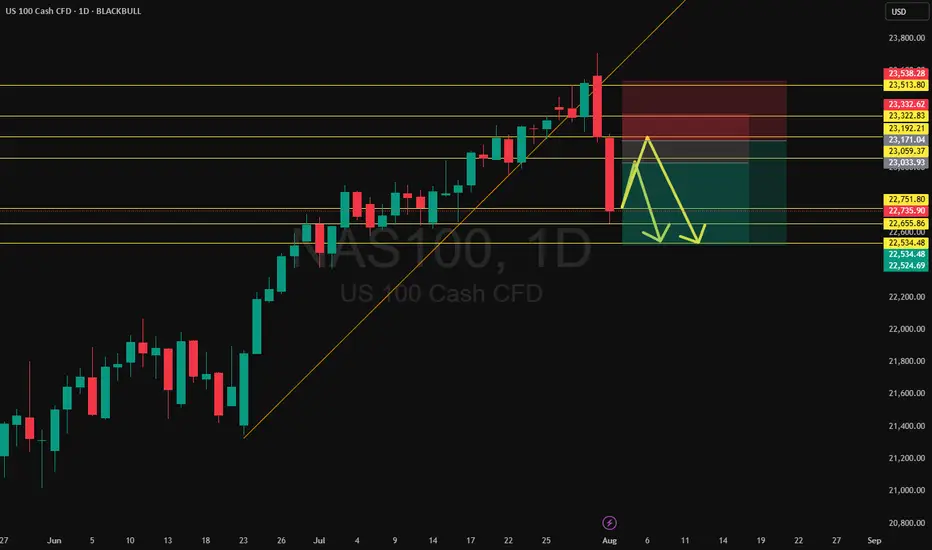
NAS100 Hits Monthly Level - Retrace or Reload?After a sharp leg down, NAS100 remains in a broader uptrend but is now reacting off a key monthly level. Expect a short-term retracement with the potential for a second leg lower. If bullish momentum returns, watch for an attempt to reclaim the level. Momentum is strong enough to challenge it again—traders should be ready for either a deep retrace or continuation move.
DAX Breaks Monthly Range - Double-Sided Opportunity AheadDAX has broken out to the downside from its monthly range, forming an expanding wedge. This creates two high-probability setups: a short back to the bottom of the range, and a long from the bottom toward the top - supported by the prevailing uptrend and strong confluence at range lows. Either way, the range is likely to hold for now, offering clear directional plays.

Gold Holds the Trendline - Eyes on the Range HighGold remains range-bound but is climbing off the range low with strong bullish momentum. Price is respecting the trendline and could stage a move toward the top of the range. A minor pullback may offer the best entry opportunity before momentum takes it higher. This setup favors buying the dip as long as the trendline holds.

Important Resistance Ahead!VAL (Valaris Limited)
Closed at 45.28 (01-08-2025)
a Very Strong Resistance lies around 48 - 50.
Crossing this level with Good Volumes may
lead it towards 55 - 56 & then towards 62 - 65.
However, if 27 is broken, we may witness more
Selling Pressure.

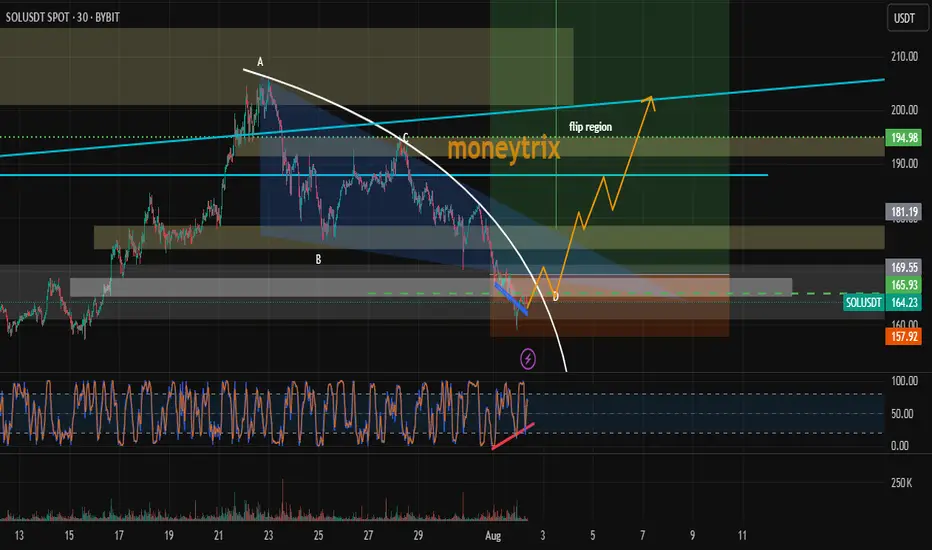
due to rsi divergence and fib zone long sol nowdue to rsi divergence and fib zone long sol now
fib golden zone triggered
demand zone triggred
rsi divergence and many other +ve sentiments
so we longged
its infinit market idea may be wrong so use sl 155$
#dyor too, im not financial advisor
NeoWave Alert: BTC G-Wave Sets Up a Brutal Drop After $116K PumpAs anticipated in our previous NeoWave analysis, the market appears to be deep within Wave G of a Contracting Diametric structure (A–G), originating from the March 2025 high.
⸻
🔻 Key Developments:
• After rejecting from $119,000–119,500 (Wave F resistance), price dipped to $112,000, breaking below the previous channel’s lower bound, and now appears to be forming a steeper descending channel.
• This new channel’s resistance has shifted lower to $116,000, becoming a potential bull trap zone.
• The bounce from $112K is likely a liquidity sweep, preparing for one final upside to $116K, followed by aggressive distribution.
⸻
💡 Trading Thesis:
We’re likely seeing a trap-style rally within Wave G, aiming to:
• Attract liquidity up to $116K
• Induce late longs before initiating a more violent selloff toward $105K or lower
⸻
🔍 Smart Money Confluence (SMC / ICT)
• 🟥 Confirmed bearish structure on 1H (Lower Highs + BOS)
• 🟨 Liquidity above $120K already swept during Wave F
• 📉 Order blocks around 119.5K rejected
• 🔻 Price currently trades above $114K, but trapped inside a sharper descending range
• 🧲 Unfilled FVGs between $113K–$110K may serve as magnets
⸻
🧠 Wave G Structure (Diametric)
• Possibly unfolding as a Zigzag or Complex Combination
• Channel boundary now capped at $116K
• Wave G likely targets a breakdown below Wave E ($113K) and toward $105K
⸻
📌 Primary Scenario:
• Final push to $116K → strong rejection expected
• Bearish continuation targeting $110K → $105K
🧯 Invalidations:
• Clean breakout & daily close above $120.5K invalidates this diametric structure
• Watch for triangle or flat morphing if structure shifts
⸻
⚠️ Risk Management:
• $116K = key distribution zone
• Watch closely for rejection and breakdown confirmation
• Shorts valid below $114K with tight invalidation above $117K
⸻
📌 Conclusion:
Bitcoin is nearing the climax of a multi-month complex correction. The current setup favors a liquidity trap toward $116K, followed by continuation of Wave G toward major demand zones. Smart money bias remains bearish below $117K.
⸻
💬 Drop your alternate wave counts or SMC confirmations in the comments!

GoldTVC:GOLD price overall is bullish after NFP event on Friday, but now it's approaching for that resistance that can result in to price forming a H&S Patten On the H4 time frame. Now let's wait on price as it goes for that supply also an Oder block.
SHIBUSD – Sneaky ReclaimerSHIB is mirroring DOGE, now breaking slightly above the 200 SMA at $0.000012056. RSI is above 56 and climbing — strength is building, though not explosive. Key test ahead at prior resistance levels.

Smart Money / Price Action 5min scalping road map# 📈 ABC Pattern Explained for TradingView (Smart Money / Price Action)
The **ABC pattern** is a 3-leg corrective move in market structure, commonly used in price action, Elliott Wave, and Smart Money trading. It's mainly used to identify **pullbacks** or **correction zones** before a continuation of the main trend.
---
## 🔹 Structure of the ABC Pattern:
- **Point A**: The beginning of the move — often the end of a strong impulsive wave.
- **Point B**: The first retracement or pullback from Point A.
- **Point C**: The second corrective move that often goes beyond A, forming the completion of the correction phase.
The ABC legs can be:
- **A to B**: Impulsive or corrective.
- **B to C**: Generally a counter-trend retracement.
---
## 🔸 How to Identify on Chart:
1. **Find a strong trend** (uptrend or downtrend).
2. **Look for the first correction** — mark it as Point A to B.
3. **Next wave** that attempts to continue the trend but fails — mark the end as Point C.
4. **Use Fibonacci tools** to measure:
- **B retracement of A** (typically 50%–78.6%)
- **C extension** of AB (typically 127.2%–161.8%)
---
## 🔧 How to Draw on TradingView:
> You can use the `Trend-Based Fib Extension` tool or draw manually using the `Path` or `ABC pattern` tool.
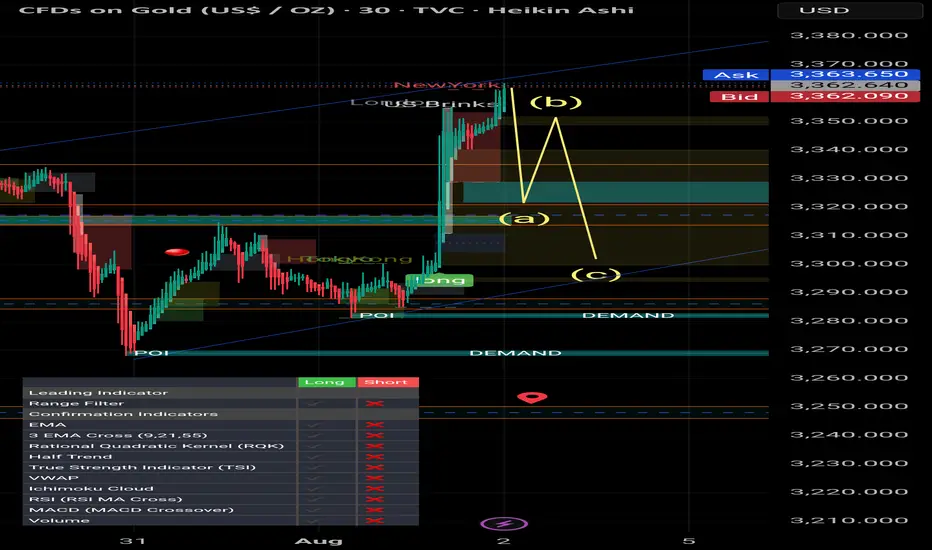
### Step-by-Step:
1. Select the `ABC Pattern` tool from the **left toolbar** under “Prediction and Measurement Tools”.
2. Click on **Point A** (3320$).
3. Click on **Point B** (3350$).
4. Click on **Point C** (final corrective wave 3300$ ).
5. TradingView will automatically plot the shape with labels.
---
## 🧠 Pro Tips:
- Look for **liquidity sweep** or **order blocks** near Point C.
- Entry opportunity is often **after C**, targeting a **continuation** of the main trend.
- ABC is often part of **larger structures** like **complex pullbacks** or **smart money retracements**.
---
## ✅ Example Use:
- **Buy Scenario**:
- Strong uptrend → Price drops from A to B (retracement).
- Then price rises to C, failing to break above A → Possible new higher low formed.
- Enter long if price breaks above Point B again.
- **Sell Scenario**:
- Strong downtrend → A to B is a pullback.
- C attempts new high, fails → short entry after break of B.
---
## 📌 Settings Tip for Mobile Users:
- Zoom in for better point control.
- Use “Lock” feature to prevent accidental move.
- Customize color and label visibility in the style tab.
---
## 🔍 Keywords:
`ABC Pattern`, `Elliott Correction`, `Smart Money`, `Liquidity Grab`, `Break of Structure`, `Trend Continuation`, `Price Action Trading`, `Market Structure`
---
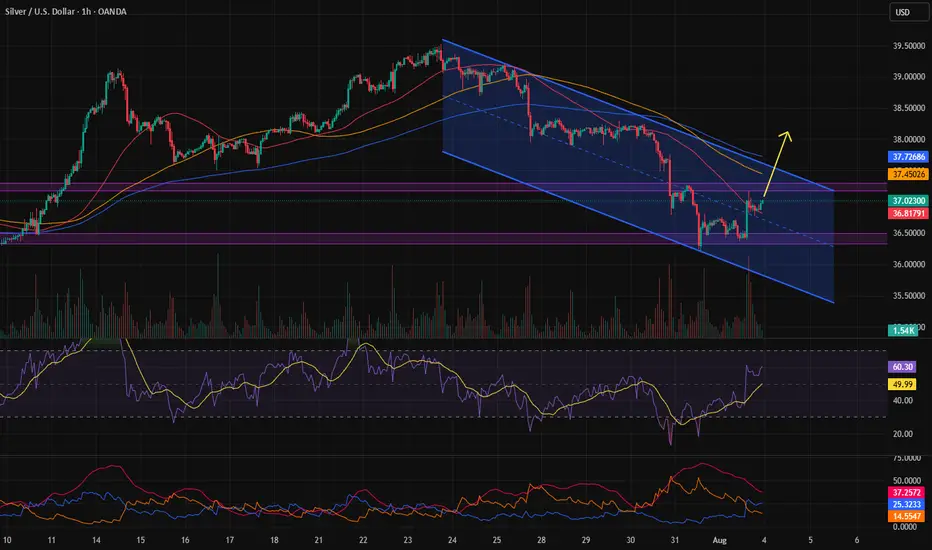
Trend reversal?If the support in the \$37–\$38 range is confirmed, a long position can be taken targeting a new all-time high (ATH).