BTC Dominance at a Critical Point – Is Altseason About to Begin?🔍 Technical Breakdown (BTC.D Weekly Chart)
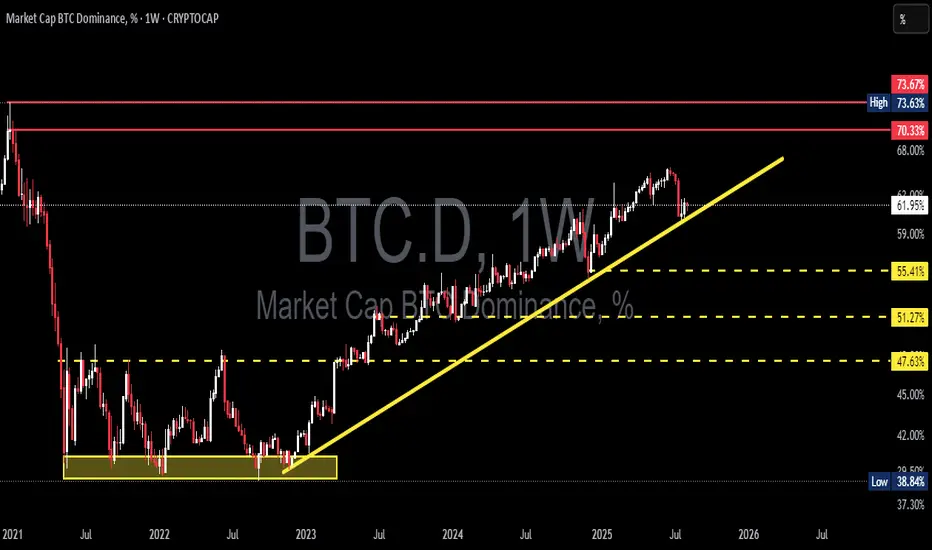
The weekly BTC Dominance chart shows Bitcoin's dominance is now testing a critical ascending trendline, which has supported its bullish momentum since early 2023.
After hitting a major resistance zone between 70.33% – 73.67%, BTC.D faced a sharp rejection — signaling a potential capital rotation from BTC into altcoins, which is often the first clue of an incoming Altseason.
---
🧩 Structure & Pattern Highlights:
✅ Rising Trendline Support:
A strong uptrend structure has been in place since the 2022 bottom (~39%), marked by consistent higher highs and higher lows.
⚠️ Minor Double Top near 70.33% – 73.67%:
This classic reversal pattern at a macro resistance zone hints at possible exhaustion in BTC dominance.
🟡 Historical Accumulation Zones:
Key horizontal levels at 55.41%, 51.27%, and 47.63% have acted as major decision zones in the past and will serve as critical support if the trend breaks.
---
🟢 Bullish Scenario (BTC Dominance Rises):
If BTC.D can:
Successfully hold above the ascending trendline
Print a strong weekly bullish reversal
➡ Then a move back up to retest 70.33% is likely.
A confirmed breakout above 73.67% would suggest BTC dominance could surge further.
📌 What it means? Altcoins would likely underperform, as BTC reclaims market control — usually a risk-off signal for crypto.
---
🔴 Bearish Scenario (BTC Dominance Falls):
If BTC.D:
Breaks below the ascending trendline
Fails to hold the 61.91% support zone
➡ This could signal a significant capital outflow from BTC to altcoins — an early indicator of Altseason.
Bearish targets below:
55.41% – First support area.
51.27% – Key psychological and technical level.
47.63% – A drop to this level would be a strong confirmation that Altseason is in full effect.
📌 In this case, we’d expect strong moves across sectors like AI tokens, DeFi, L1s, and mid/low cap altcoins.
---
📊 Key Confirmations to Watch:
1. Weekly candle reaction to the trendline
2. Volume – strong selling on breakdown confirms trend shift
3. ETH.D and TOTAL2 (Altcoin Market Cap) – if rising while BTC.D falls, it's strong evidence for Altseason
---
🚨 Final Takeaway:
BTC Dominance is now at a make-or-break level that could define the direction of the broader crypto market for the next several months.
A breakdown = risk-on environment, favoring altcoins.
A bounce = BTC continues to dominate while altcoins stall.
Either way, the next big move is coming — this is the moment serious traders and investors have been waiting for.
#BTCdominance #AltseasonAlert #BitcoinVsAltcoins #CryptoRotation #CryptoBreakout #AltcoinSeason #CryptoMarketAnalysis #BTC.D #CryptoTrend #SmartMoneyMoves #CryptoTA #TradingViewAnalysis
Harmonic Patterns
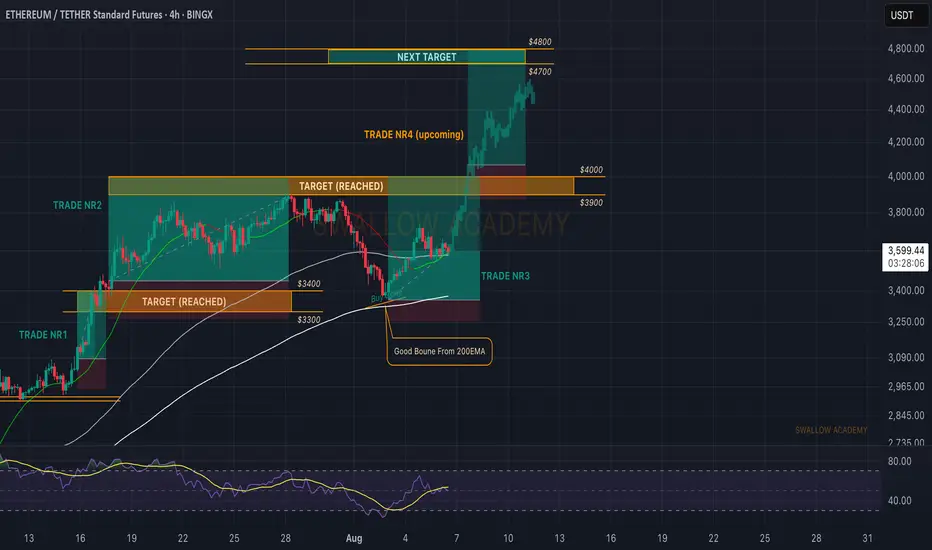
Ethereum (ETH): Seeing Struggle But Nothing Serious | Bullish AFETH still looks bullish to us, with the price staying above the local 200EMA, where last time we had a decent bounce from it.
Now, as many remember and know, we are bullish on ETH only due to 1 big reason: the liquidity of BTC has to go somewhere, and as investors have already had their fun (most of it, at least) with BTC, now they need to relocate their money and ETH is the next step.
$4000 is still our target (once again, as we already reached it once basically), and the current zone seems like a good bounce area with the 100 EMA and the middle line of the BB sitting there, in addition to lots of liquidity being distributed here (based on the order book we use)!
Swallow Academy
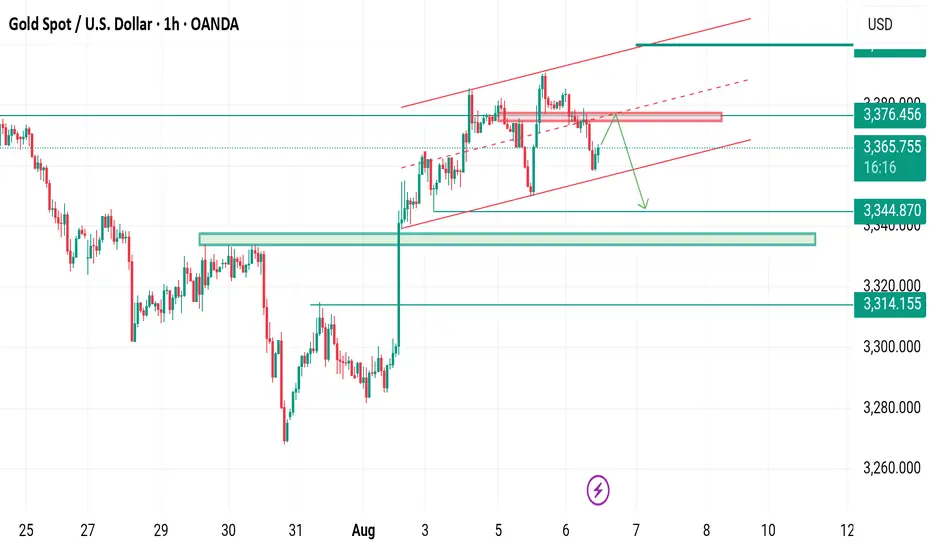
XAUUSD needs retest before swing highM30-H1 TIMEFRAME SETUP
Currently we have range of 3345-3380 area also we have proper CHOCH on H4 at 3335 support area
What possible scenarios we have ?
• If market remains low 3372-3378 then you can scalp a sell trades towards 3360-3350 area which I take sell with minimal risk.
• secondly I wait for drop to my Buying area where I will buy XAUUSD in dips and my optimal target will be 3402-3410.
Additional Tip:
Market is on bullish Bias ,above 3385 no sell Trade .
#XAUUSD

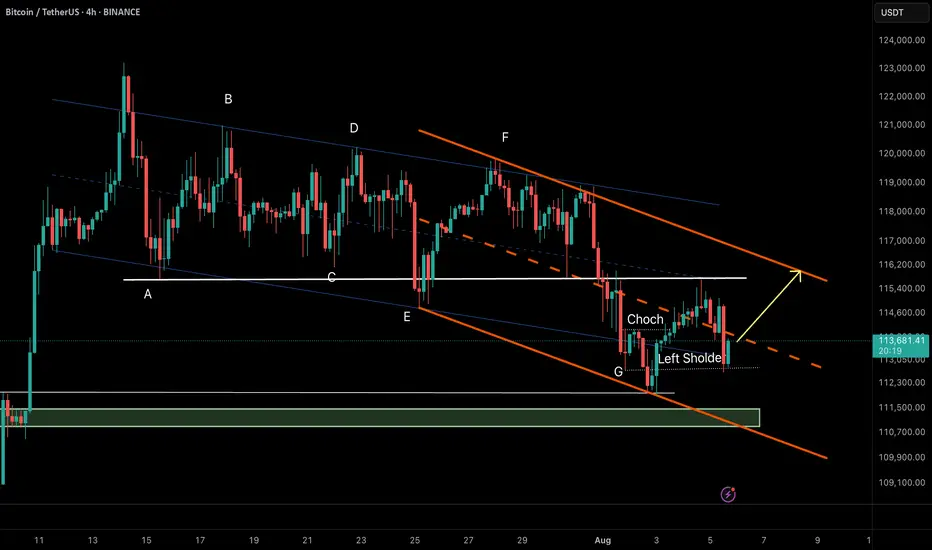
Bitcoin (BTC/USDT) – RTM Reversal Pattern in Action🔸 Market Structure:
Bitcoin has formed a descending channel after a prolonged correction. Recently, price tapped the channel bottom and printed a CHoCH (Change of Character), indicating a potential reversal.
The price has now retraced to the left shoulder of a potential inverse head & shoulders pattern—an RTM classic structure—which held as support, suggesting bullish continuation.
⸻
🔸 Key Technical Signals:
• ✅ CHoCH confirmed at demand zone near $112,300
• ✅ Retest of the left shoulder validates bullish structure
• ✅ Holding above the internal bullish trendline
• ✅ Price aiming toward upper channel resistance
⸻
🎯 Target:
$116,200 – Top of the descending channel & next key resistance.
❌ Invalidation:
Break and close below $112,800 would invalidate the current RTM setup and open room for deeper correction.
⸻
📌 Summary:
This is a textbook RTM reversal:
CHoCH → Retracement → Left Shoulder Test → Continuation
As long as the structure holds, we remain bullish toward the channel top.
BTC/USD - KEY SUPPORT BREAKOUT IN FOCUS!Bitcoin is currently trading near a critical support level, and price action is setting up for a decisive move.
📉 Bearish Scenario (Primary Bias):
Key support at ~$117,800 has broken, signaling a shift in market sentiment.
If the breakdown holds, we could see a strong bearish continuation toward the demand zone around $111,000.
Price may retest the broken support before the next leg down.
📈 Bullish Scenario (Alternate):
If buyers regain control and reclaim the broken support, BTC could retest the strong high at $120,700, and possibly push toward the supply zone near $123,000.
🔎 Structure Highlights:
Supply Zone: $122,000 – $123,000
Demand Zone: $110,000 – $111,500
Key Resistance/Support: $117,800
Strong High: ~$120,700
📌 Watch Closely:
Price behavior on the retest of the broken support
Bearish confirmation for downside continuation
Bullish reclaim for short-term recovery
A decisive move is near – be ready for both scenarios with tight risk management!

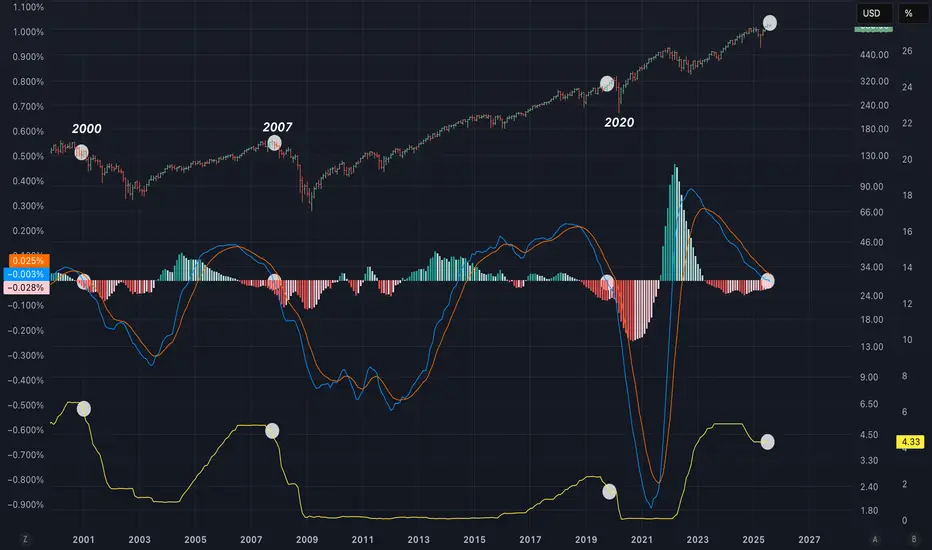
LMACD of the US02Y has just dipped bellow 0!In the past while rates have been elevated for a period of time things have gone bad for risk markets once the LMACD dipped bellow 0. Could be this time different?
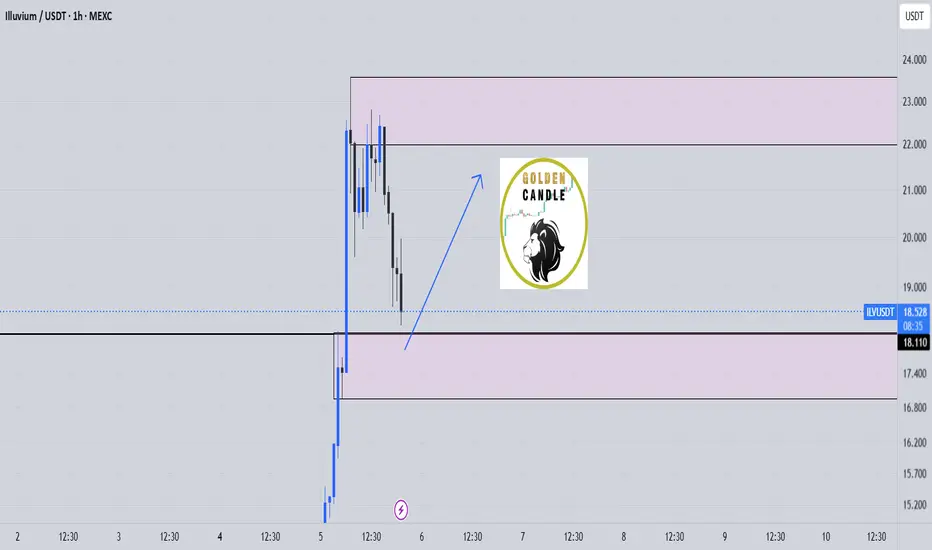
ilv buy midterm"🌟 Welcome to Golden Candle! 🌟
We're a team of 📈 passionate traders 📉 who love sharing our 🔍 technical analysis insights 🔎 with the TradingView community. 🌎
Our goal is to provide 💡 valuable perspectives 💡 on market trends and patterns, but 🚫 please note that our analyses are not intended as buy or sell recommendations. 🚫
Instead, they reflect our own 💭 personal attitudes and thoughts. 💭
Follow along and 📚 learn 📚 from our analyses! 📊💡"
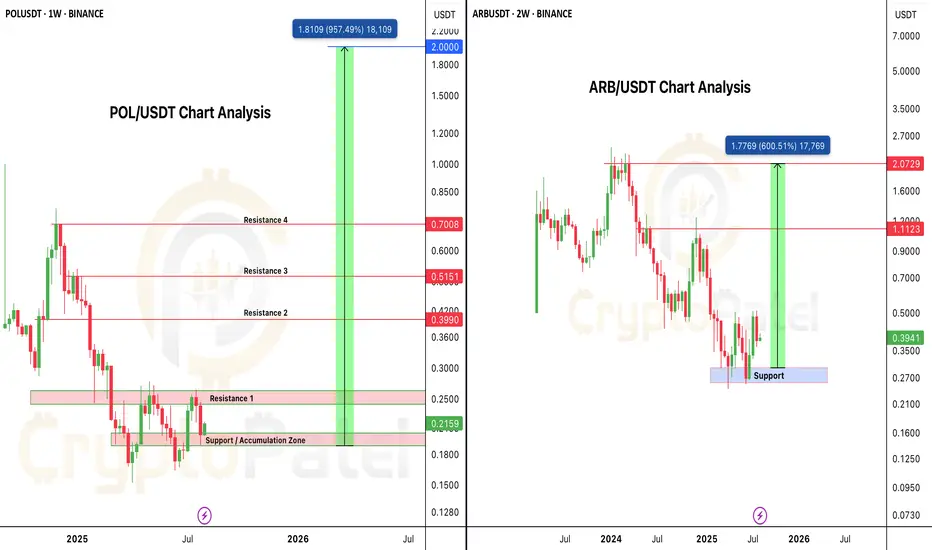
Altseason is Loading... Which One’s Your 10x Pick – $POL or $ARB🚨 BULL MARKET ACCUMULATION ALERT 🚨
Both PSX:POL and AMEX:ARB are currently trading below $0.40, and both charts are showing strong long-term bullish structure.
PSX:POL Analysis:
• Current Price: Under $0.40
• Strong Entry Zone: $0.20 – $0.17
• Bull Run Targets: $2 – $5
• Backed by powerful fundamentals, strong tech, and serious investors.
AMEX:ARB Analysis:
• Current Price: ~$0.40
• Key Accumulation Zone: $0.40 – $0.30
• Bull Run Targets: $2 – $5
• One of the strongest L2 ecosystems with deep liquidity and solid fundamentals.
Both are technically oversold, fundamentally strong, and positioned for major upside in the coming altseason.
Question for the community:
Which one hits $2 first — PSX:POL or AMEX:ARB ?
Drop your pick below 👇
NFA & DYOR
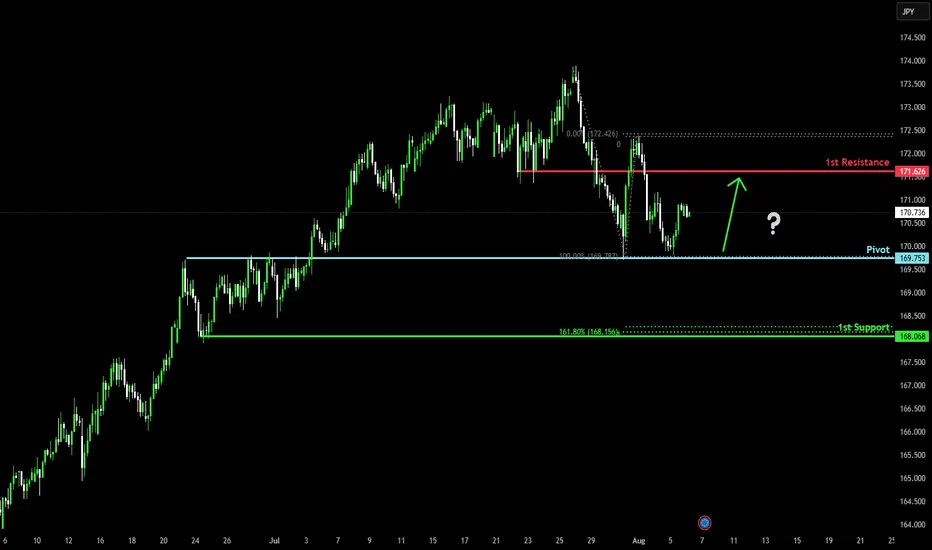
Bullish bounce off?EUR/JPY has bounced off the pivot which has been identified as an overlap support and could rise to the 1st resistance.
Pivot: 169.75
1st Support: 168.06
1st Resistance: 171.62
Risk Warning:
Trading Forex and CFDs carries a high level of risk to your capital and you should only trade with money you can afford to lose. Trading Forex and CFDs may not be suitable for all investors, so please ensure that you fully understand the risks involved and seek independent advice if necessary.
Disclaimer:
The above opinions given constitute general market commentary, and do not constitute the opinion or advice of IC Markets or any form of personal or investment advice.
Any opinions, news, research, analyses, prices, other information, or links to third-party sites contained on this website are provided on an "as-is" basis, are intended only to be informative, is not an advice nor a recommendation, nor research, or a record of our trading prices, or an offer of, or solicitation for a transaction in any financial instrument and thus should not be treated as such. The information provided does not involve any specific investment objectives, financial situation and needs of any specific person who may receive it. Please be aware, that past performance is not a reliable indicator of future performance and/or results. Past Performance or Forward-looking scenarios based upon the reasonable beliefs of the third-party provider are not a guarantee of future performance. Actual results may differ materially from those anticipated in forward-looking or past performance statements. IC Markets makes no representation or warranty and assumes no liability as to the accuracy or completeness of the information provided, nor any loss arising from any investment based on a recommendation, forecast or any information supplied by any third-party.
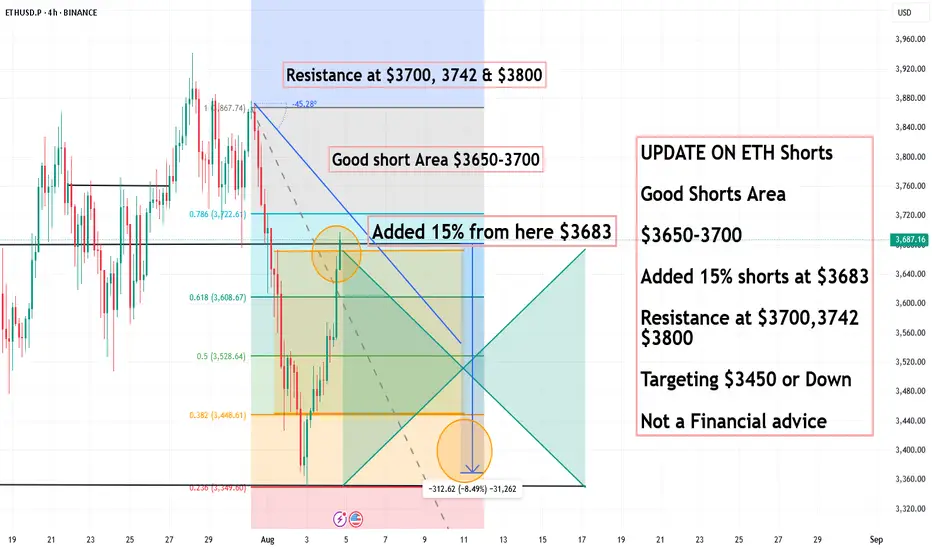
UPDATE ON ETH Shorts, Good Shorts Area $3650-3700UPDATE ON ETH Shorts
Good Shorts Area
$3650-3700
Added 15% shorts at $3683
Resistance at $3700,3742
$3800
Targeting $3450 or Down
Not a Financial advice
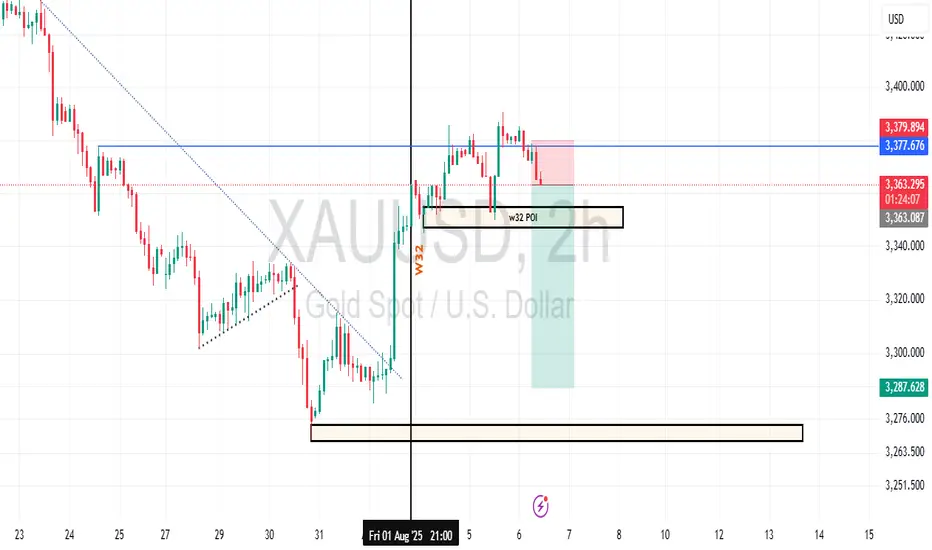
Gold Week 32 Possible reversalGold prices are in a clear downtrend, with critical support at $3,287.628 and resistance at $3,379.874. The 'W32 POI 2H' on Aug 1 highlighted a volatile 2-hour period with a sharp drop and recovery, signaling potential support strength. Fibonacci retracement levels could play a key role in identifying retracement targets. Stay disciplined with risk management as you navigate these levels.
PHAUSDT at Make-or-Break Zone Is This the Calm Before the Storm?📍 Chart Overview (6D Timeframe – Binance)
PHA/USDT is currently retesting a major historical demand zone between $0.0703 - $0.0986, highlighted by the yellow box. This zone has acted as a strong base since mid-2022, repeatedly absorbing selling pressure and bouncing the price back up.
Over the past two years, this accumulation zone has consistently held, forming a classic sideways structure, typically seen before a major breakout. However, the inability to break through the upper resistances suggests persistent bearish pressure.
Now, the market is nearing a make-or-break moment that could lead to a decisive move in either direction.
---
🔎 Pattern Identified: "Extended Accumulation + Volatility Compression"
The price is trading inside a long-term accumulation range, indicating that smart money might be quietly buying.
We're seeing signs of volatility compression, a precursor to breakout volatility.
Repeated lower wicks near the demand zone show strong buying interest on dips.
This setup may produce a “spring” scenario, where a false breakdown triggers a strong reversal rally.
---
🟢 Bullish Scenario (Rejection From Demand Zone):
If the price continues to hold above $0.0986 and forms a higher low structure:
Bullish Targets:
1. $0.1357 – Minor historical resistance
2. $0.1897 – Key horizontal resistance
3. $0.3790 – Mid-range breakout target
4. $1.0666 – Long-term retracement target
Bullish Confirmation Signals: ✅ Break and daily close above $0.1357
✅ Increased volume on breakout
✅ Bullish candle structure near support
---
🔴 Bearish Scenario (Breakdown of Accumulation Zone):
If the price fails to hold $0.0703 – $0.0986 and breaks down with strong volume:
Bearish Targets:
1. $0.0590 – Psychological support
2. Below $0.0500 – Open downside
3. Trend shifts into bearish continuation structure
Bearish Confirmation Signals: ❌ Strong close below $0.0703
❌ Volume spike on red candle
❌ Lack of bullish response
---
🧠 Strategic Notes for Traders & Investors:
This zone offers a low-risk, high-reward opportunity for speculative positioning, with a tight stop-loss below $0.0703.
Due to prolonged compression, any breakout (up or down) could be explosive.
Be cautious of false breakouts. Wait for confirmation via volume and price action.
---
🗣️ Conclusion:
PHA/USDT is sitting at a technical inflection point that has historically triggered strong market reactions. After two years of coiling price action, this extended accumulation phase is nearing its resolution.
What happens next will likely define the long-term trajectory for this asset. Don’t sleep on this setup — whether you’re bullish or bearish, this is where attention should be focused.
#PHAUSDT #PHA #CryptoAnalysis #AltcoinSetup #TechnicalAnalysis #BreakoutWatch #AccumulationZone #StrongSupport #CryptoTrading

BITCOIN BITCOIN is cooling off from last attempted all time high at 123k 122k zone .the daily ascending trend and 4hr is giving a demand floor which will be watched on possible breakout from the structure ON 4HRS
On 4hrs we have a break out of a descending trendline and followed by two successful sell off connecting us from our current all time high. if we dont reclaim that supply roof by returning to buying floor ,then sellers will push to break the daily ascending trendline acting as dynamic support and our target from our EMA+SMA STRATEGUY IS 99-100 ZONE and on a flip side if we see buying liquidity from cooperate buying ,then we will hope for retest if 123k and extend the greed buying 128k-130k-135k will be targeted.
trading is 100% probability and any key level can fail, pls manage your risk
A trader without capital is a demo trader.
As a trader, your biggest weapon in the financial market is your capital,dont play or gamble with it.
GOODLUCK,PLS LIKE AND SHARE IF YOU LIKE THE IDEA AND INSIGHT.

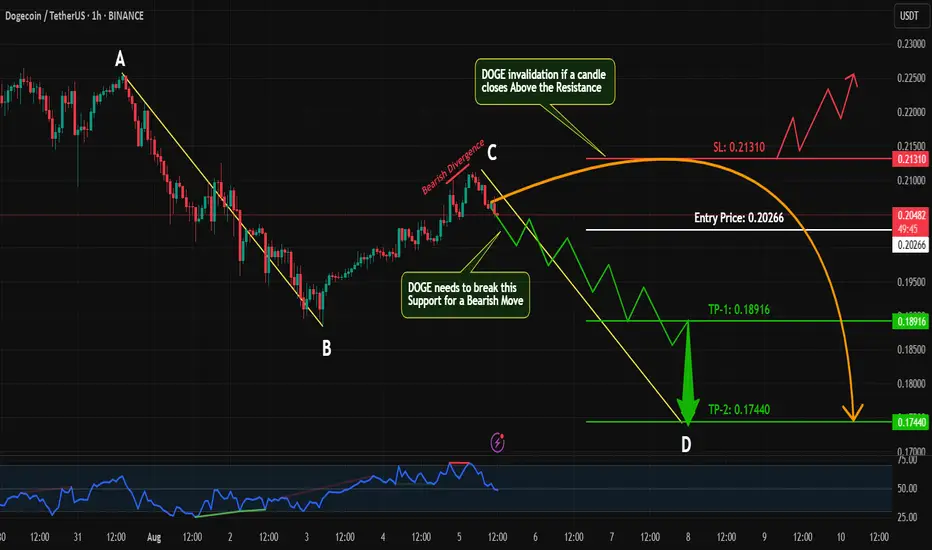
DOGE Bearish Setup in Progress |AB=CD Pattern+Bearish Divergence Hey Traders!
#DOGE/USDT is currently showing signs of a bearish continuation on the 1H timeframe 📉. Here's why I'm watching this closely:
🔹 AB=CD Harmonic Pattern:
The AB leg is already complete, and the price action is now progressing toward forming the CD leg — a classic harmonic setup suggesting further downside.
🔹 Bearish Divergence on RSI:
While the price made a higher high, RSI failed to confirm — signaling weakening momentum and potential reversal ahead.
🔹 Key Support Level in Focus:
I’m watching the previous minor support zone for confirmation. If price breaks and retests this level, it could be a great entry point for a short trade with solid risk-reward.
📌 Trade Plan:
✅ Wait for confirmation below support
✅ Look for bearish candlestick patterns or breakdown
✅ Enter short with proper risk management (SL just above local highs)
💬 What do you think about this setup? Are you already short on #DOGE or waiting for more confirmation? Drop your thoughts below 👇 and let’s discuss!
If you find this analysis helpful, don’t forget to:
👍 Like
💬 Comment
🔁 Share
📥 Follow for more high-probability setups!
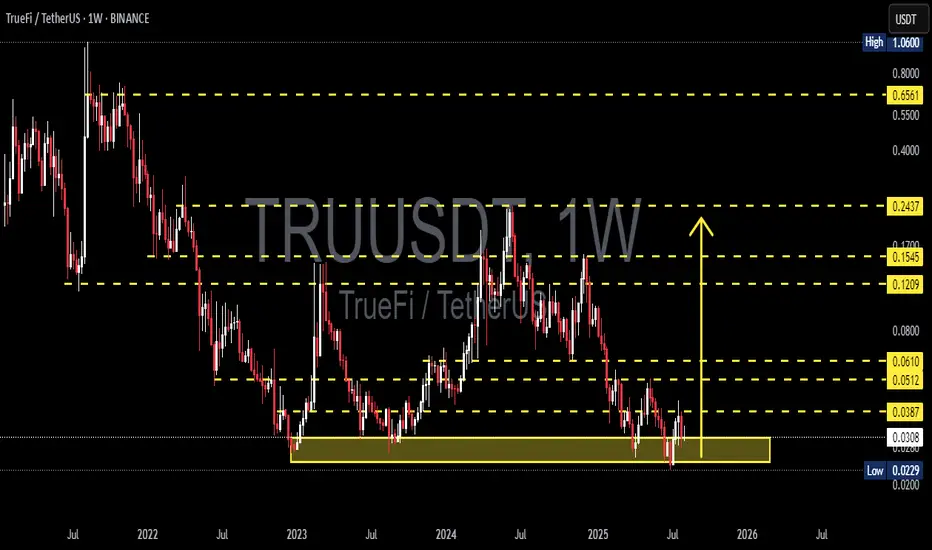
TRU/USDT Weekly – On the Verge of a Reversal or Breakdown?📌 Overview:
TRU/USDT is currently trading within a key long-term demand zone between $0.0229–$0.0307 — an area that has consistently acted as a strong bounce level since early 2023. Now that this zone is being tested again, the outcome could define the next major move for TrueFi.
---
🔍 Market Structure & Pattern:
The pair has been moving sideways in a year-long accumulation range, hinting at a potential accumulation phase by smart money.
There's a possibility of a triple bottom formation, a classic reversal signal, should price break above resistance with momentum.
Although the overall trend remains bearish, selling pressure is weakening, suggesting a possible trend transition phase.
---
📈 Bullish Scenario (Reversal Potential):
If price holds the support zone and confirms a bullish weekly candle:
Upside Targets:
🔹 $0.0387 (First breakout level)
🔹 $0.0512 – $0.0610 (Previous distribution range)
🔹 $0.1209 – $0.1545 (Mid-term trend shift target)
Potential catalysts: strong breakout volume, improving market sentiment, and weakening BTC dominance.
---
📉 Bearish Scenario (Breakdown Risk):
If price fails to hold above $0.0229 and closes below on the weekly chart:
Price could fall further toward the psychological level around $0.0200 or even lower.
This would confirm a new lower low, continuing the broader bearish trend and possibly entering a capitulation phase.
---
🎯 Key Levels to Watch:
Level Significance
$0.0229 – $0.0307 Major demand zone (historical support)
$0.0387 Initial resistance / bullish trigger
$0.0512 & $0.0610 Previous supply zones
$0.1209 & $0.1545 Mid-term reversal targets
$0.2437 Long-term target if uptrend confirms
---
🔄 Conclusion:
TRU/USDT is at a make-or-break point. Bulls and bears are clashing at this critical support. Will this be the start of a long-awaited reversal, or will we see a deeper breakdown?
The coming weekly candles will be crucial. Smart traders will wait for clear confirmation — not just reaction.
---
🧲 Trading Strategy Ideas:
Conservative Bulls: Wait for a weekly breakout above $0.0387 with volume confirmation.
Aggressive Traders: Consider entry at support with tight stop-loss below $0.0225, aiming for $0.0512 short-term.
Bearish Bias: Short after confirmed weekly close below support.
#TRUUSDT #TrueFi #CryptoReversal #AltcoinAnalysis #SupportZone #TripleBottom #BreakoutSetup #WeeklyChart
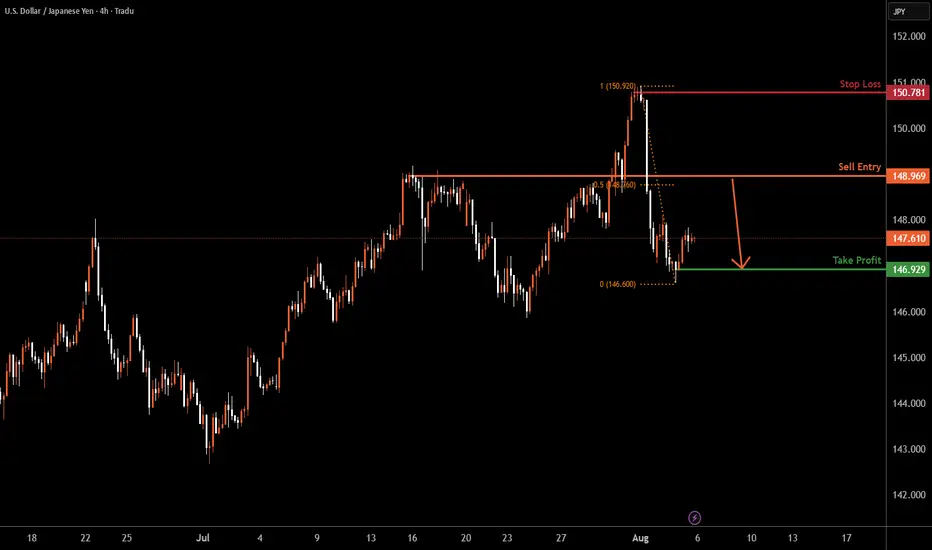
USDJPY H4 | Bearish reversal off pullback resistanceUSD/JPY is rising towards the sell entry which is a pullback resistance that is slightly above the 50% Fibonacci retracement and could drop from this level to the take profit.
Sell entry is at 148.96, which is a pullback resistance that is slightly above the 50% Fibonacci retracement.
Stop loss is at 150.78, which is a swing high resistance.
Take profit is at 146.92, which is a swing low support.
High Risk Investment Warning
Trading Forex/CFDs on margin carries a high level of risk and may not be suitable for all investors. Leverage can work against you.
Stratos Markets Limited (tradu.com ):
CFDs are complex instruments and come with a high risk of losing money rapidly due to leverage. 65% of retail investor accounts lose money when trading CFDs with this provider. You should consider whether you understand how CFDs work and whether you can afford to take the high risk of losing your money.
Stratos Europe Ltd (tradu.com ):
CFDs are complex instruments and come with a high risk of losing money rapidly due to leverage. 66% of retail investor accounts lose money when trading CFDs with this provider. You should consider whether you understand how CFDs work and whether you can afford to take the high risk of losing your money.
Stratos Global LLC (tradu.com ):
Losses can exceed deposits.
Please be advised that the information presented on TradingView is provided to Tradu (‘Company’, ‘we’) by a third-party provider (‘TFA Global Pte Ltd’). Please be reminded that you are solely responsible for the trading decisions on your account. There is a very high degree of risk involved in trading. Any information and/or content is intended entirely for research, educational and informational purposes only and does not constitute investment or consultation advice or investment strategy. The information is not tailored to the investment needs of any specific person and therefore does not involve a consideration of any of the investment objectives, financial situation or needs of any viewer that may receive it. Kindly also note that past performance is not a reliable indicator of future results. Actual results may differ materially from those anticipated in forward-looking or past performance statements. We assume no liability as to the accuracy or completeness of any of the information and/or content provided herein and the Company cannot be held responsible for any omission, mistake nor for any loss or damage including without limitation to any loss of profit which may arise from reliance on any information supplied by TFA Global Pte Ltd.
The speaker(s) is neither an employee, agent nor representative of Tradu and is therefore acting independently. The opinions given are their own, constitute general market commentary, and do not constitute the opinion or advice of Tradu or any form of personal or investment advice. Tradu neither endorses nor guarantees offerings of third-party speakers, nor is Tradu responsible for the content, veracity or opinions of third-party speakers, presenters or participants.
Wyckoff Logic GCFound this picture of Wyckoff Theory and overlay it on GC Daily chart,
Looks scary good, I will follow it for sure.
Picture from: forexfactory.com/thread/369763-richard-demille-wyckoff-method?page=14
I highly recommend ForexFactory.com

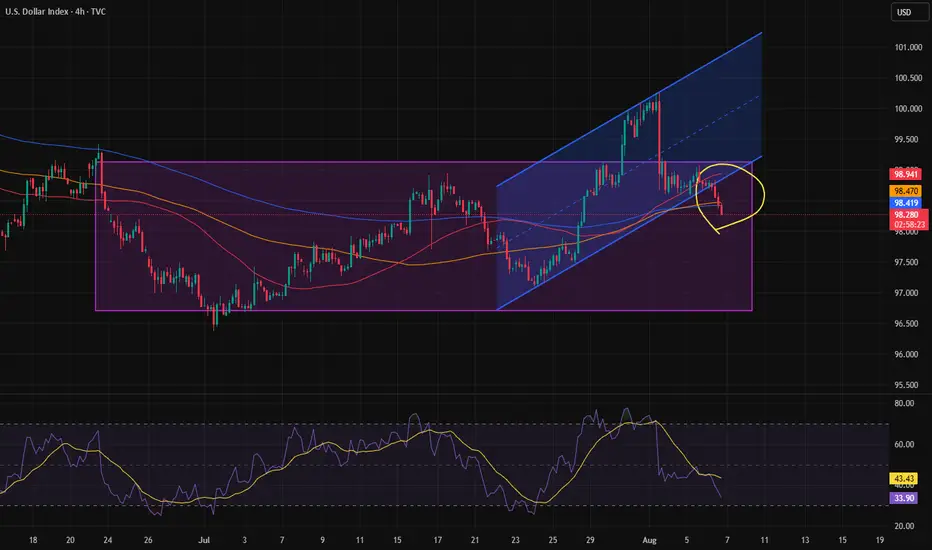
Dollar dropWith the break of the ascending channel's bottom, the price is expected to reach the bottom of the range.
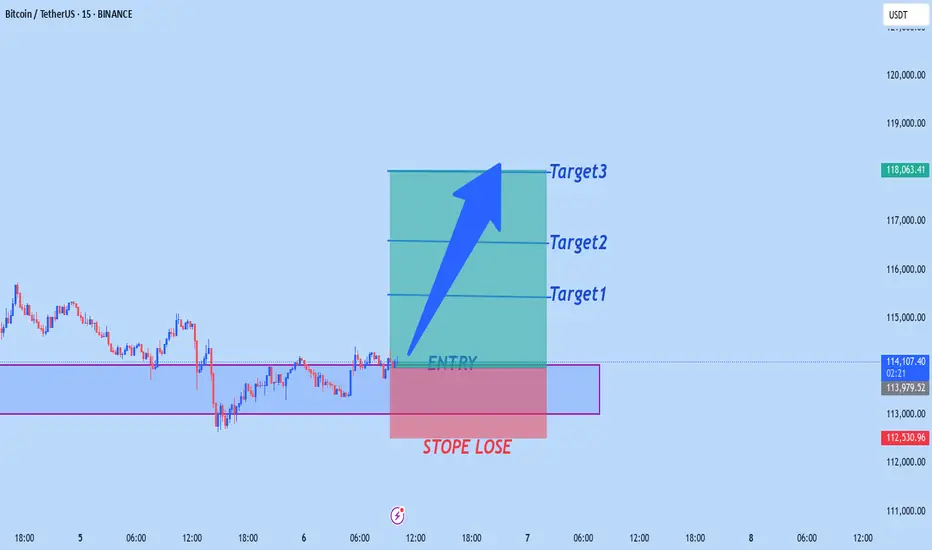
BTCUSD CAN FLY HIGHbtcusd buy from 114,000
target1 115,500
target2 116,500
target3 118,000
Stope lose 112,500
TRADE AT YOUR OWN RISK
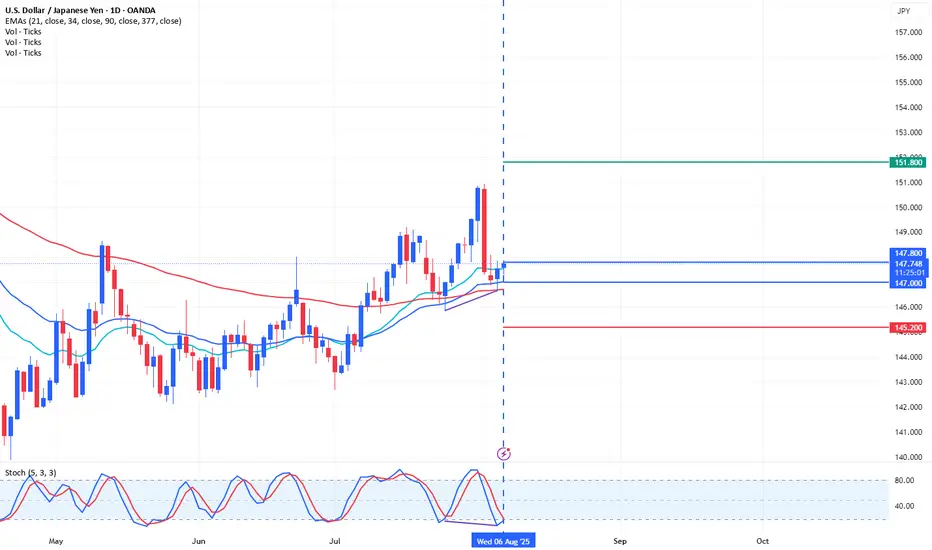
Trading Ideas USDJPY 1D [Disc On]Technical Analysis:
There is a hidden bullish stochastic divergence on the 1D timeframe, indicating a potential continuation of the previous trend. The price has also entered the Fibonacci 0.618 retracement area.
Conclusion:
There is a high probability of seeking BUY positions in the range of 147.800 – 147.000, with a Take Profit target at 151.800 and a Stop Loss at 145.200.
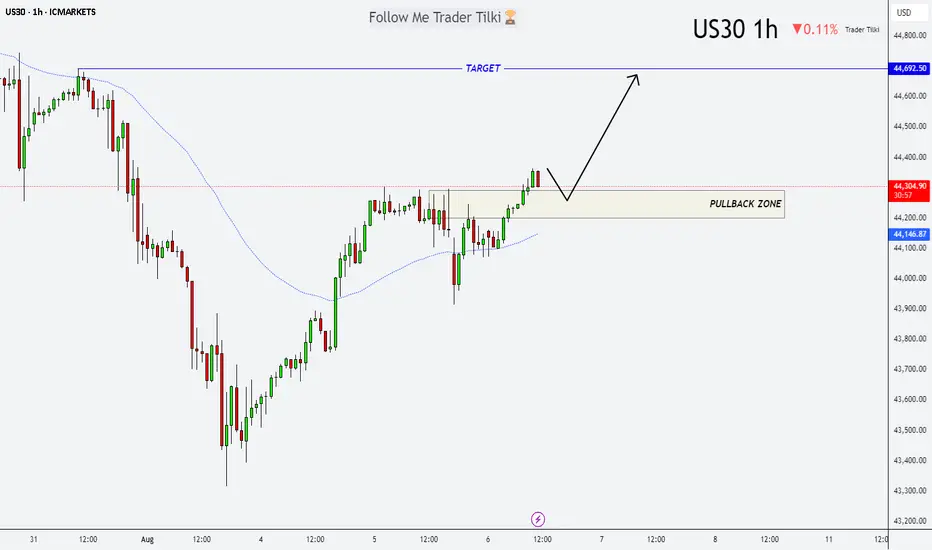
US30 at the Turn: Buy Setup from the Pullback ZoneHey friends 👋
Here’s my latest analysis on US30 (Dow Jones). I’m watching a potential pullback into the zone I marked: 44,292 – 44,190. I plan to open a buy position from that range, targeting 44,692 as my take-profit level.
Every single like you send is a huge source of motivation for me to keep sharing these insights. Big thanks to everyone supporting with a tap of appreciation 🙏
#SUI/USDT 4H: Broke out of a falling wedge with bullish momentum#SUI/USDT 4H: Broke out of a falling wedge with bullish momentum, now holding an ascending trendline. Watch for a retest around $3.40–$3.20. Holding above this zone targets $4.00 and $4.80. A break below $3.00 invalidates the setup.
