Market StructureIf we look at the underlying market structure, Bitcoin's structure isn't fully formed yet. There are still unsolved puzzles around 135,000. I believe Bitcoin will finalize its final structure around 135,000, which will be its expansionary structure.
The final candle on this weekly timeframe will determine Bitcoin's direction. This August, Bitcoin will either continue its bullish structure or continue its minor retracement.
Disclamer: Any information provided is for educational and informational purposes only and does not constitute investment advice.
Harmonic Patterns

Is it a time for BONK? 40% potential profit - 0.035 USD TARGETOn the 4-hour chart of the 1000BONK/USDT pair, we can observe a corrective phase following a strong prior bullish impulse, which peaked around the 0.041 USDT level. Currently, the price is in a consolidation zone after a sharp downward move, but there are early signs of a potential trend reversal.
Key observations:
Support and rebound: The price has stabilized around the 0.012 level and is starting to form a local bottom, which may suggest exhaustion of selling pressure.
Moving Averages (MA): The price is attempting to break above the short-term moving average (green line), which could signal the beginning of a trend reversal. A break above this level and a test of the longer-term moving average (red line) in the 0.018–0.020 range would be an important bullish confirmation.
Momentum (bottom indicator – WaveTrend/WT): The WT oscillator indicates oversold conditions (below -50), and the lines are starting to curve upward, which often precedes upward moves.
Bullish scenario:
If the current consolidation proves to be an accumulation phase and the price breaks through the nearest resistance in the 0.018–0.020 range, a move toward 0.035 is possible. This level corresponds to a previous consolidation zone and acts as a local resistance area. Such a move would align with a technical rebound following the strong decline and would represent a retest of the equilibrium zone from the end of July.
Potential TP: 0.035 USD

XAU
Gold (XAU/USD) – Bullish Breakout and Key Resistance Zones Ahead
Gold has recently broken out of a descending channel on the 4H timeframe, indicating a potential shift in market structure. The breakout was strong and clean, suggesting momentum is building up for further upside.
Price is now approaching a series of key resistance zones, which I’ve marked as potential short-term targets:
3387.025
3406.948 – 3409.846
3421.203
As long as price holds above the breakout zone and maintains support around 3318–3330, the bullish scenario remains intact. A rejection from the 3271 demand zone also supports this move.
I'll be watching price action closely near each resistance for signs of continuation or reversal. This idea is based purely on technical analysis and market structure.

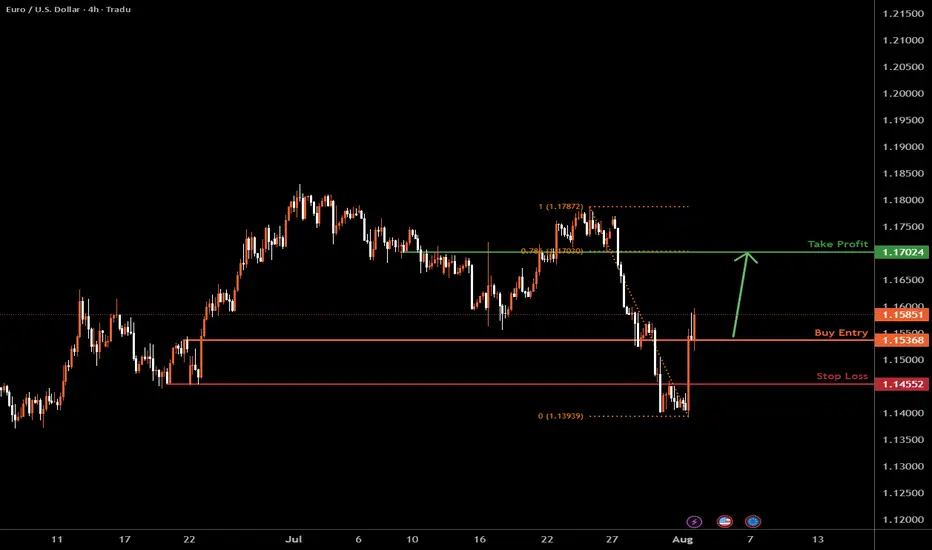
The Fiber H4 | Bullish riseEUR/USD has bounced off the support level, which serves as a pullback support and could potentially rise from this level to our take-profit target.
Buy entry is at 1.1585, which is a pullback support.
Stop loss is at 1.1455, which is a pullback support.
Take profit is at 1.1702, which is a pullback resistance that aligns with the 78.6% Fibonacci retracement.
High Risk Investment Warning
Trading Forex/CFDs on margin carries a high level of risk and may not be suitable for all investors. Leverage can work against you.
Stratos Markets Limited (tradu.com ):
CFDs are complex instruments and come with a high risk of losing money rapidly due to leverage. 65% of retail investor accounts lose money when trading CFDs with this provider. You should consider whether you understand how CFDs work and whether you can afford to take the high risk of losing your money.
Stratos Europe Ltd (tradu.com ):
CFDs are complex instruments and come with a high risk of losing money rapidly due to leverage. 66% of retail investor accounts lose money when trading CFDs with this provider. You should consider whether you understand how CFDs work and whether you can afford to take the high risk of losing your money.
Stratos Global LLC (tradu.com):
Losses can exceed deposits.
Please be advised that the information presented on TradingView is provided to Tradu (‘Company’, ‘we’) by a third-party provider (‘TFA Global Pte Ltd’). Please be reminded that you are solely responsible for the trading decisions on your account. There is a very high degree of risk involved in trading. Any information and/or content is intended entirely for research, educational and informational purposes only and does not constitute investment or consultation advice or investment strategy. The information is not tailored to the investment needs of any specific person and therefore does not involve a consideration of any of the investment objectives, financial situation or needs of any viewer that may receive it. Kindly also note that past performance is not a reliable indicator of future results. Actual results may differ materially from those anticipated in forward-looking or past performance statements. We assume no liability as to the accuracy or completeness of any of the information and/or content provided herein and the Company cannot be held responsible for any omission, mistake nor for any loss or damage including without limitation to any loss of profit which may arise from reliance on any information supplied by TFA Global Pte Ltd.
The speaker(s) is neither an employee, agent nor representative of Tradu and is therefore acting independently. The opinions given are their own, constitute general market commentary, and do not constitute the opinion or advice of Tradu or any form of personal or investment advice. Tradu neither endorses nor guarantees offerings of third-party speakers, nor is Tradu responsible for the content, veracity or opinions of third-party speakers, presenters or participants.
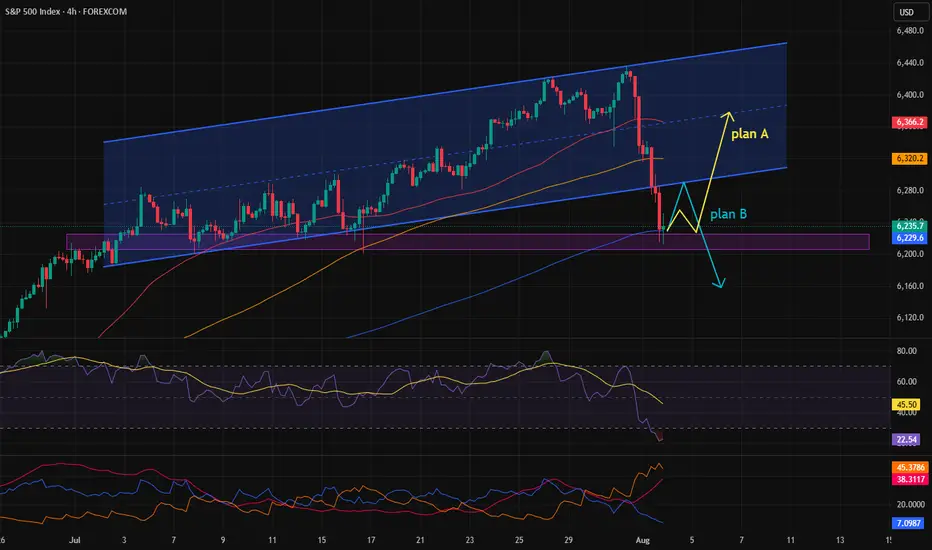
Possible return of the stock market downtrend.After a sharp drop due to last week's news, the S\&P stock index is now at a critical point.
Given the strong bullish trend it had previously, there’s a possibility we might see a return to the uptrend this week.
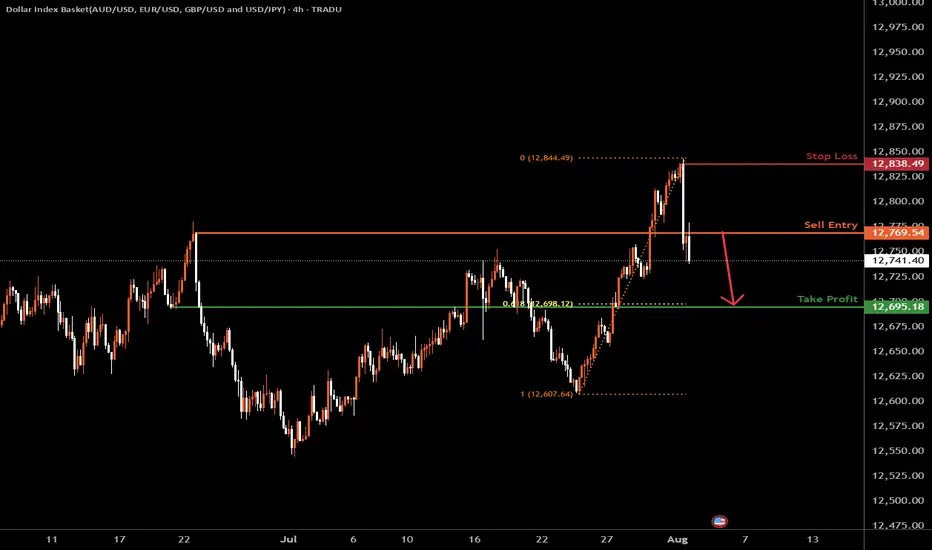
USDOLLAR H4 | Bearish dropBased on the H4 chart analysis, we could see the price drop lower from the sell entry, which is a pullback resistance and could drop to the downside.
Sell entry is at 12,769.54, which is a pullback resistance.
Stop loss is at 12,834.49, which is at 12,695.18, which is a pullback resistance.
Take profit is at 12,695.18, which is a pullback support that aligns with the 61.8% Fibonacci retracement.
High Risk Investment Warning
Trading Forex/CFDs on margin carries a high level of risk and may not be suitable for all investors. Leverage can work against you.
Stratos Markets Limited (tradu.com ):
CFDs are complex instruments and come with a high risk of losing money rapidly due to leverage. 65% of retail investor accounts lose money when trading CFDs with this provider. You should consider whether you understand how CFDs work and whether you can afford to take the high risk of losing your money.
Stratos Europe Ltd (tradu.com ):
CFDs are complex instruments and come with a high risk of losing money rapidly due to leverage. 66% of retail investor accounts lose money when trading CFDs with this provider. You should consider whether you understand how CFDs work and whether you can afford to take the high risk of losing your money.
Stratos Global LLC (tradu.com ):
Losses can exceed deposits.
Please be advised that the information presented on TradingView is provided to Tradu (‘Company’, ‘we’) by a third-party provider (‘TFA Global Pte Ltd’). Please be reminded that you are solely responsible for the trading decisions on your account. There is a very high degree of risk involved in trading. Any information and/or content is intended entirely for research, educational and informational purposes only and does not constitute investment or consultation advice or investment strategy. The information is not tailored to the investment needs of any specific person and therefore does not involve a consideration of any of the investment objectives, financial situation or needs of any viewer that may receive it. Kindly also note that past performance is not a reliable indicator of future results. Actual results may differ materially from those anticipated in forward-looking or past performance statements. We assume no liability as to the accuracy or completeness of any of the information and/or content provided herein and the Company cannot be held responsible for any omission, mistake nor for any loss or damage including without limitation to any loss of profit which may arise from reliance on any information supplied by TFA Global Pte Ltd.
The speaker(s) is neither an employee, agent nor representative of Tradu and is therefore acting independently. The opinions given are their own, constitute general market commentary, and do not constitute the opinion or advice of Tradu or any form of personal or investment advice. Tradu neither endorses nor guarantees offerings of third-party speakers, nor is Tradu responsible for the content, veracity or opinions of third-party speakers, presenters or participants.
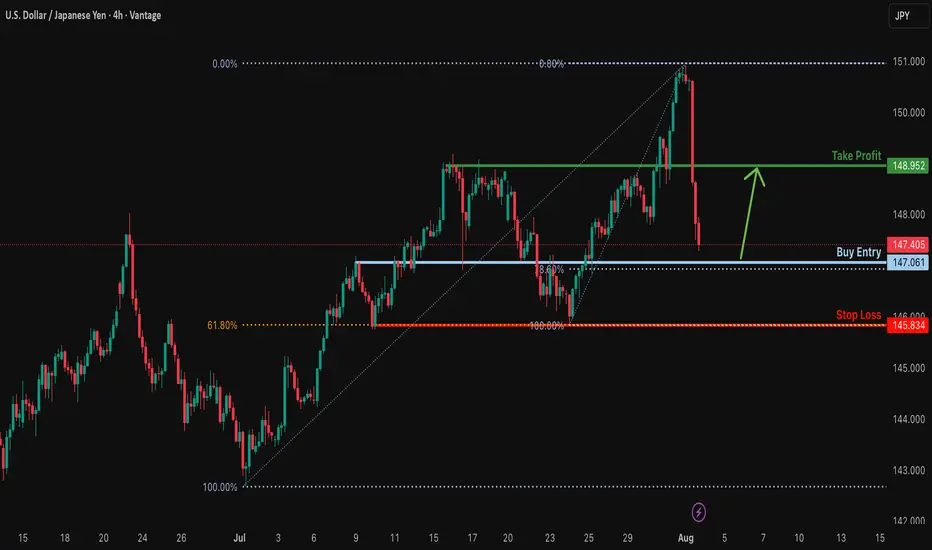
Falling towards 78.6% Fibonacci support?USD/JPY is falling towards the support level, which is an overlap support that aligns with the 78.6% Fibonacci retracement and could bounce from this level to our take profit.
Entry: 147.06
Why we like it:
There is an overlap support that aligns with the 78.6% Fibonacci retracement.
Stop loss: 145.83
Why we like it:
There is a multi-swing low support that aligns with the 61.8% Fibonacci retracement.
Take profit: 148.95
Why we like it:
There is a pullback resistance.
Enjoying your TradingView experience? Review us!
Please be advised that the information presented on TradingView is provided to Vantage (‘Vantage Global Limited’, ‘we’) by a third-party provider (‘Everest Fortune Group’). Please be reminded that you are solely responsible for the trading decisions on your account. There is a very high degree of risk involved in trading. Any information and/or content is intended entirely for research, educational and informational purposes only and does not constitute investment or consultation advice or investment strategy. The information is not tailored to the investment needs of any specific person and therefore does not involve a consideration of any of the investment objectives, financial situation or needs of any viewer that may receive it. Kindly also note that past performance is not a reliable indicator of future results. Actual results may differ materially from those anticipated in forward-looking or past performance statements. We assume no liability as to the accuracy or completeness of any of the information and/or content provided herein and the Company cannot be held responsible for any omission, mistake nor for any loss or damage including without limitation to any loss of profit which may arise from reliance on any information supplied by Everest Fortune Group.
Analysis For The Next WeekHello Traders,
I hope you had joyful weekend, the market is going to open tonight so we are back with new idea for next week.
As you know gold was dropping for last two weeks and suddenly pumped almost 650 pips after the impact of NFP News. We saw the high pressure in the market on Friday due to news impact.
Gold has broken the buy trend line D1,H4. According to D1,H4 gold still wants to drop till 3251.
If price respects area 3372-3393, then gold will drop. If price breaks the area 3400 then it will pump and it can make another All Time High. As you know 3501 is the All Time High (ATH). Price can break if there will be a breakout for bullish moment.
Keep in touch and drop positive comments here, Thanks.

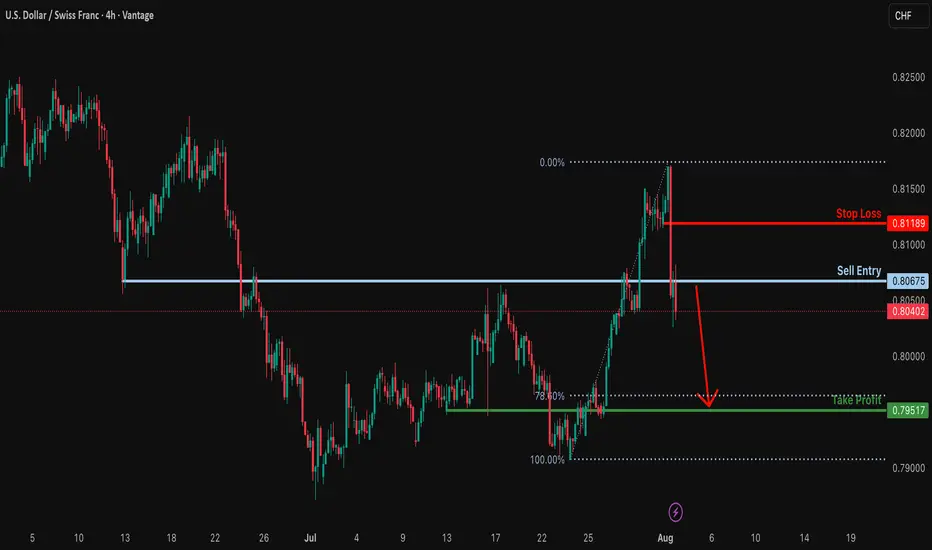
Potential bearish drop?USD/CHF has reacted off the sell entry, which is a pullback resistance, and could drop from this level to our take profit.
Entry: 0.8067
Why we like it:
There is a pullback resistance.
Stop loss: 0.8118
Why we like it:
There is a pullback resistance.
Take profit: 0.7951
Why we like it:
There is a pullback support level that is slightly below the 78.6% Fibonacci retracement.
Enjoying your TradingView experience? Review us!
Please be advised that the information presented on TradingView is provided to Vantage (‘Vantage Global Limited’, ‘we’) by a third-party provider (‘Everest Fortune Group’). Please be reminded that you are solely responsible for the trading decisions on your account. There is a very high degree of risk involved in trading. Any information and/or content is intended entirely for research, educational and informational purposes only and does not constitute investment or consultation advice or investment strategy. The information is not tailored to the investment needs of any specific person and therefore does not involve a consideration of any of the investment objectives, financial situation or needs of any viewer that may receive it. Kindly also note that past performance is not a reliable indicator of future results. Actual results may differ materially from those anticipated in forward-looking or past performance statements. We assume no liability as to the accuracy or completeness of any of the information and/or content provided herein and the Company cannot be held responsible for any omission, mistake nor for any loss or damage including without limitation to any loss of profit which may arise from reliance on any information supplied by Everest Fortune Group.
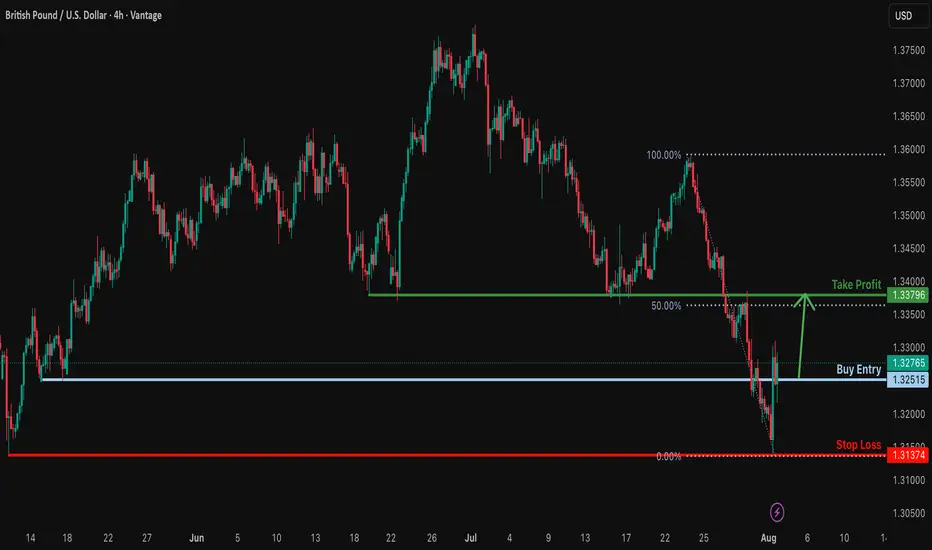
Could the Cable rise from here?The price is reacting off the support level and could rise from this level to our take profit.
Entry: 1.3251
Why we like it:
There is a pullback support.
Stop loss: 1.3137
Why we like it:
There is a multi swing low support.
Take profit: 1.3379
Why we like it:
There is an overlap resistance that is slightly above the 50% Fibonacci retracement.
Enjoying your TradingView experience? Review us!
Please be advised that the information presented on TradingView is provided to Vantage (‘Vantage Global Limited’, ‘we’) by a third-party provider (‘Everest Fortune Group’). Please be reminded that you are solely responsible for the trading decisions on your account. There is a very high degree of risk involved in trading. Any information and/or content is intended entirely for research, educational and informational purposes only and does not constitute investment or consultation advice or investment strategy. The information is not tailored to the investment needs of any specific person and therefore does not involve a consideration of any of the investment objectives, financial situation or needs of any viewer that may receive it. Kindly also note that past performance is not a reliable indicator of future results. Actual results may differ materially from those anticipated in forward-looking or past performance statements. We assume no liability as to the accuracy or completeness of any of the information and/or content provided herein and the Company cannot be held responsible for any omission, mistake nor for any loss or damage including without limitation to any loss of profit which may arise from reliance on any information supplied by Everest Fortune Group.
Bullish rise?EUR/USD has reacted off the support level and could potentially rise from this level to our takeprofit.
Entry: 1.1535
Why we like it:
There is a pullback support.
Stop loss: 1.1405
Why we like it:
There is a swing low support.
Take profit: 1.1684
Why we like it:
There is a pullback resistance that is slightly below the 78.6% Fibonacci retracement.
Enjoying your TradingView experience? Review us!
Please be advised that the information presented on TradingView is provided to Vantage (‘Vantage Global Limited’, ‘we’) by a third-party provider (‘Everest Fortune Group’). Please be reminded that you are solely responsible for the trading decisions on your account. There is a very high degree of risk involved in trading. Any information and/or content is intended entirely for research, educational and informational purposes only and does not constitute investment or consultation advice or investment strategy. The information is not tailored to the investment needs of any specific person and therefore does not involve a consideration of any of the investment objectives, financial situation or needs of any viewer that may receive it. Kindly also note that past performance is not a reliable indicator of future results. Actual results may differ materially from those anticipated in forward-looking or past performance statements. We assume no liability as to the accuracy or completeness of any of the information and/or content provided herein and the Company cannot be held responsible for any omission, mistake nor for any loss or damage including without limitation to any loss of profit which may arise from reliance on any information supplied by Everest Fortune Group.

Beautiful Bullish Divergence on Bigger tf.TNON
CMP 1.46 (03-08-2025)
Beautiful Bullish Divergence on Bigger tf.
However, this time it should not break 0.80;
otherwise we may witness further selling pressure.
Immediate Resistance seems to be around
2.50 - 3.50

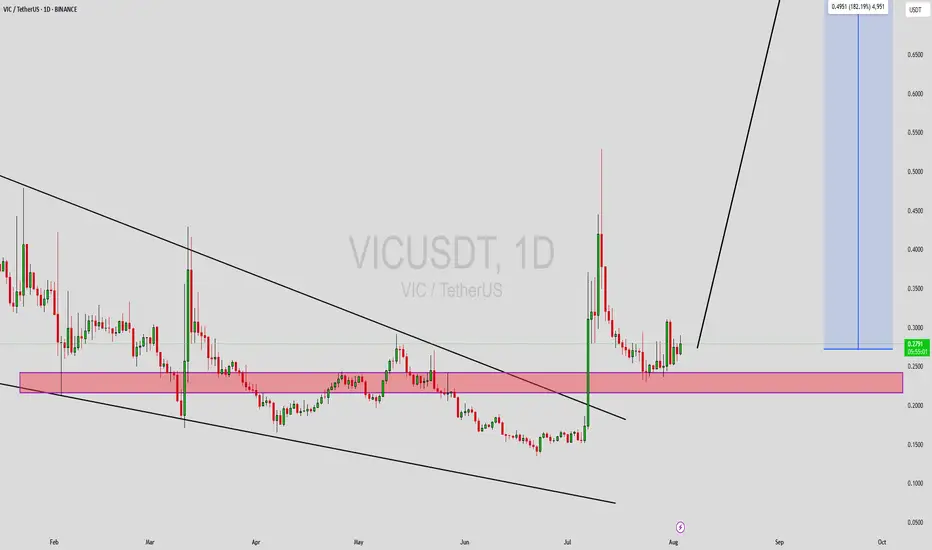
VICUSDT Forming Descending ChannelVICUSDT is currently showing a classic descending channel pattern, which often signals a potential bullish reversal upon breakout. After a sustained downtrend, the price appears to be stabilizing and respecting the lower boundary of the channel, while volume remains healthy. This combination of falling price within a defined channel and consistent volume is often a precursor to an explosive breakout. A breakout above the upper resistance line of this descending structure would validate a trend reversal and trigger a wave of bullish momentum.
What makes VICUSDT particularly compelling is the aggressive profit potential of 140% to 150%+. This high reward expectation aligns with typical breakouts from descending channels, especially when paired with strong investor interest and favorable market conditions. The technical setup suggests that the asset is currently undervalued, and any breakout move could quickly be followed by a sharp rally as buyers rush to capitalize on the momentum.
Recent market sentiment around VICUSDT has turned positive, with increasing attention from retail traders and investors alike. As capital rotates into mid-cap altcoins showing strong breakout formations, VIC is positioned to benefit significantly. Traders should closely watch for confirmation of a breakout with strong candle closes above the upper trendline and rising volume. That would be the green light for entering long with a well-defined risk.
This is a prime candidate for traders who prefer breakout setups and are seeking high-risk, high-reward opportunities. Given the technical indicators, volume support, and increasing investor interest, VICUSDT could be one of the most explosive plays in the coming sessions.
✅ Show your support by hitting the like button and
✅ Leaving a comment below! (What is You opinion about this Coin)
Your feedback and engagement keep me inspired to share more insightful market analysis with you!
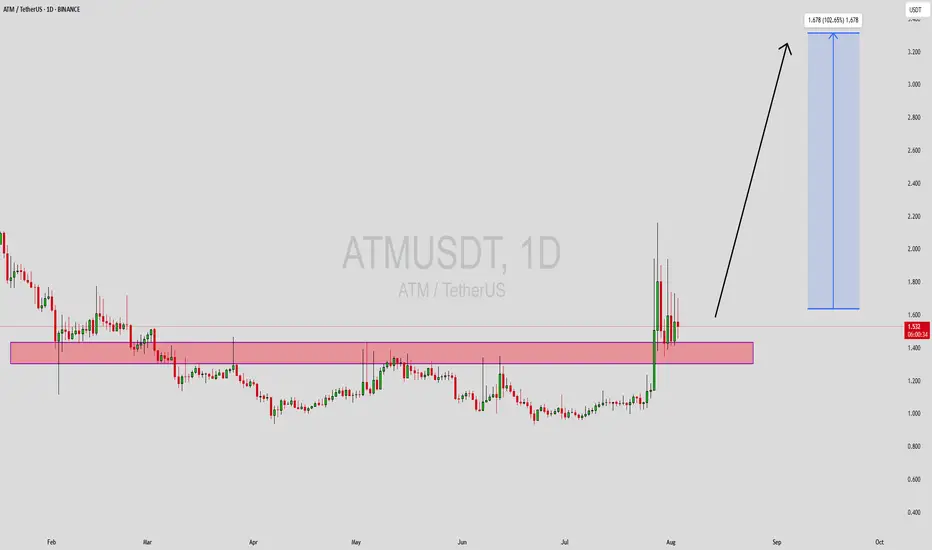
ATMUSDT Forming Bullish ContinuationATMUSDT is displaying a strong bullish continuation signal following its recent breakout from a prolonged consolidation zone. The price has surged above a critical resistance range, now turned into a support zone (highlighted in pink), which held the price down for months. This shift in structure signals renewed bullish sentiment, with price action stabilizing just above the breakout area — a textbook sign of accumulation before the next leg upward.
The trading volume accompanying this breakout is notably strong, reinforcing the legitimacy of the move. With an expected gain of 90% to 100%+, the current market structure suggests there's still substantial upside potential. The projection points to a move towards the $3.20 area, aligning with previous high-volume sell zones. If bulls maintain control and the price remains above the new support zone, this target becomes increasingly realistic in the short-to-mid term.
Investors are beginning to show strong interest in ATM, which is likely due to both technical and fundamental reasons. As the crypto market regains momentum, low-cap or mid-tier altcoins with solid breakout structures tend to outperform. The chart setup on ATMUSDT is appealing to both swing traders and breakout traders who are targeting high-reward scenarios with proper risk control.
ATMUSDT is a coin to watch closely. Any retest of the support zone could be a solid entry opportunity for those who missed the initial breakout. As long as the structure holds, this setup remains bullish and could offer one of the most rewarding trades on Binance’s spot market in the coming weeks.
✅ Show your support by hitting the like button and
✅ Leaving a comment below! (What is You opinion about this Coin)
Your feedback and engagement keep me inspired to share more insightful market analysis with you!
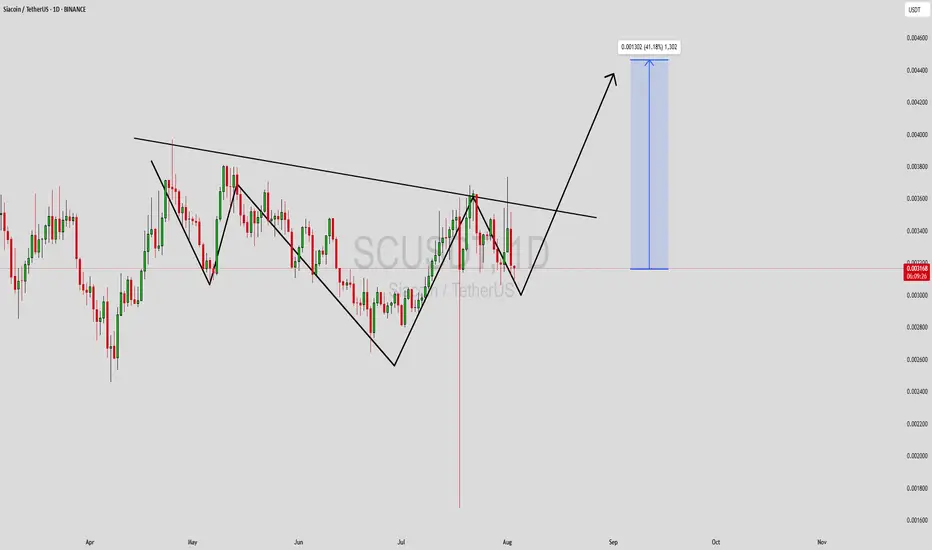
SCUSDT Forming Potential BreakoutSCUSDT (Siacoin paired with USDT) is currently shaping up to be an interesting opportunity for bullish traders. The chart reveals a potential breakout setup forming after a series of higher lows and a well-defined descending trendline. This pattern suggests a coiled price action, which typically precedes a breakout. The volume has remained healthy during the consolidation phase, and a breakout from this structure could lead to a significant upward movement.
The expected gain range of 30% to 40%+ is supported by the current price structure and projected breakout targets. If SCUSDT manages to break above the resistance zone, the momentum could accelerate quickly, especially with investor sentiment building around decentralized storage solutions like Siacoin. This crypto asset has a history of sharp upside moves when volume kicks in, and this setup aligns well with previous bullish phases.
Interest in SCUSDT is also gaining traction from the broader community, as decentralized storage continues to be a hot topic in blockchain utility. As the ecosystem around data privacy and censorship resistance grows, coins like SC become increasingly relevant. This fundamental narrative, paired with the technical breakout pattern forming, makes SCUSDT worth watching closely.
Traders should keep an eye on the breakout zone marked on the chart. A confirmed candle close above that trendline with volume could ignite a fresh rally toward the 40% target area. Managing risk properly and watching for continuation patterns post-breakout can help capitalize on the upcoming move.
✅ Show your support by hitting the like button and
✅ Leaving a comment below! (What is You opinion about this Coin)
Your feedback and engagement keep me inspired to share more insightful market analysis with you!
Hood Targeting The Hights
📈 **HOOD BULLISH SETUP - WEEKLY TRADE IDEA (08/03)** 📈
**Ticker:** \ NASDAQ:HOOD | **Bias:** 🟢 *Moderate Bullish*
🔁 **Call/Put Ratio:** 2.13 = **Strong Bullish Flow**
💼 **Volume:** 166K Calls vs. 78K Puts = Institutional Interest
📉 **Gamma Risk:** LOW | ⏳ **Time Decay:** Moderate
🔥 **TRADE SETUP** 🔥
• 💥 **Buy CALL @ \$109**
• 💰 *Entry:* \$0.85
• 🎯 *Target:* \$1.70 (100% ROI)
• 🛑 *Stop Loss:* \$0.43
• ⏰ *Expiry:* 08/08/25 (5DTE)
• 🧠 *Confidence:* 65%
• 📈 *Size:* 5 contracts
• 🕒 *Entry Timing:* Market Open
💡 **Why it matters:**
Despite mixed RSI and conflicting trend models, **massive call volume + low gamma risk** supports a short-term breakout play.
📌 **Watch for confirmation at open. Tight risk/reward. High upside if momentum holds.**

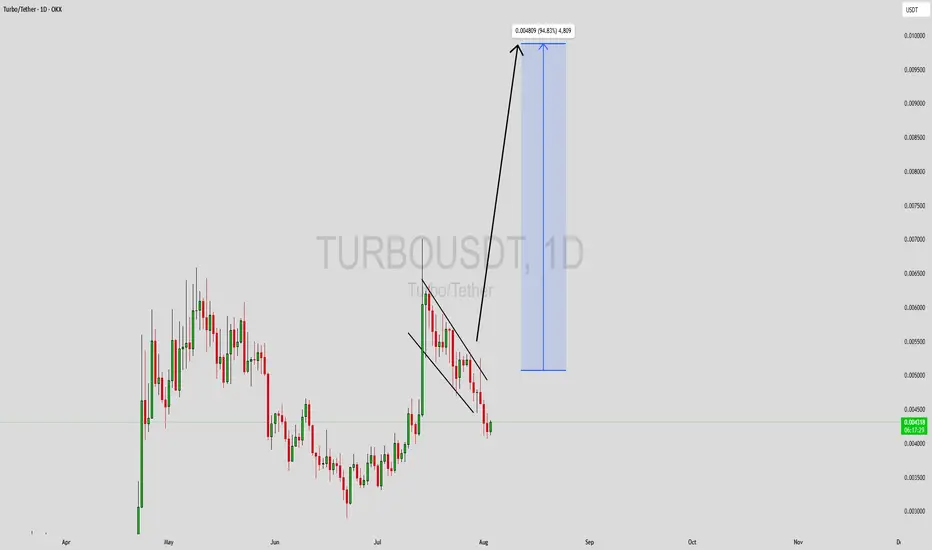
TURBOUSDT Forming Bullish PennantTURBOUSDT is currently exhibiting a bullish pennant pattern on the charts—a continuation setup that often leads to strong upward movement after a period of consolidation. This pattern typically forms after a sharp upward move, followed by a tightening range that resembles a pennant or small symmetrical triangle. The breakout from this structure is generally explosive, especially when backed by strong volume. TURBOUSDT has seen just that—an increase in trading volume that aligns with growing investor confidence.
The technical structure suggests that the recent consolidation phase is nearing its end, and a breakout to the upside could potentially yield a move of 80% to 90% or more. Bullish pennants are powerful indicators of renewed buying interest, and with price coiling near resistance, the odds of a breakout are increasing. Traders are watching this setup closely for confirmation, as a successful breakout could attract further momentum and trigger a new bullish trend leg.
Beyond the technicals, TURBO’s growing presence in the meme and altcoin sectors has captured investor attention. The project has been gaining traction due to its unique branding, active community engagement, and listings on major exchanges. These fundamental strengths further reinforce the bullish outlook from a technical standpoint.
If the breakout confirms with strong volume, this could be one of the top short-term opportunities in the current market. Keep a close eye on the price action in the coming sessions as the pattern nears its apex—TURBOUSDT could soon enter a high-velocity rally phase.
✅ Show your support by hitting the like button and
✅ Leaving a comment below! (What is You opinion about this Coin)
Your feedback and engagement keep me inspired to share more insightful market analysis with you!
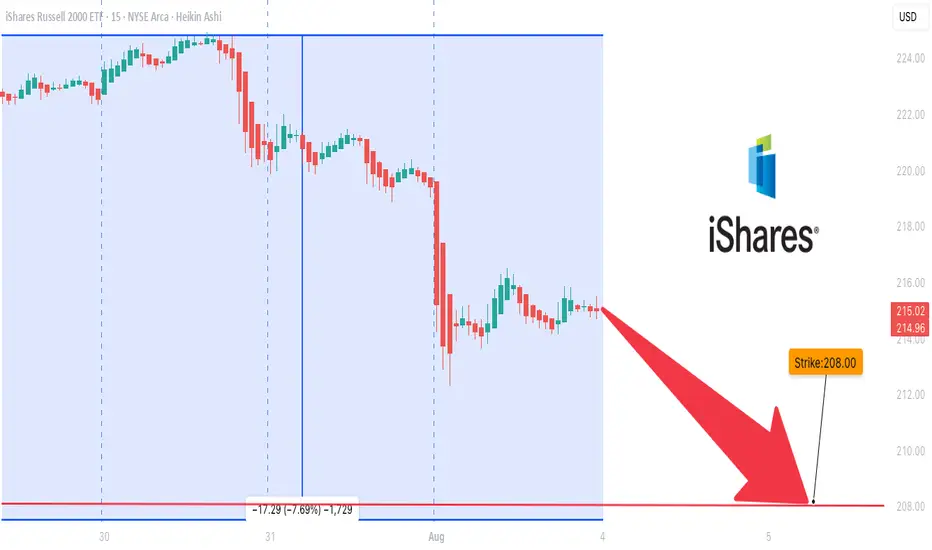
IWM is Overbought### ⚠️ \ AMEX:IWM Bearish Setup Alert — Weekly PUT Trade (Aug 3, 2025)
> **Momentum breakdown + institutional volume = high-probability short play**
📉 **Market Breakdown:**
* **📉 Daily RSI:** 34.9 → Bearish momentum under key 45 level
* **📊 Weekly RSI:** 53.0 → Neutral but slipping = trend weakening
* **📈 Volume Spike:** 1.4x → Institutional moves hint at potential sell-off
* **⚖️ Options Flow:** 1.00 C/P ratio → No bias = wait for price action
* **💀 Max Pain:** \$222.50 → Downward price magnet
* **🌪️ VIX:** 20.38 → Normal vol zone, good for option plays
---
### 💥 Trade Setup – 5D Weekly PUT
| Entry | 🎯 Target | 🛑 Stop Loss | ⚖️ R/R Ratio | 📅 Expiry |
| ------ | ------------- | ------------- | ------------ | ---------- |
| \$0.92 | \$1.35 (+50%) | \$0.45 (-50%) | 1:1.5 | 2025-08-08 |
🔻 **Strike:** \$208.00
💼 **Type:** Naked PUT
⏰ **Timing:** Enter at market open
📈 **Confidence:** 70%
🧠 **Logic:** Bearish RSI + volume surge + neutral flow = downside edge
---
### 🔍 Summary
> “IWM is losing grip. Momentum says down. Big players are already positioning.”
> 🔸 Short-term PUTs offer attractive R/R
> 🔸 Low volatility improves pricing
> 🔸 Weekly RSI still neutral → stay nimble
---
📊 **TRADE DETAILS**
🎯 Instrument: **IWM**
🔀 Direction: **PUT (SHORT)**
🎯 Strike: **\$208.00**
💵 Entry: **\$0.92**
🎯 Target: **\$1.35**
🛑 Stop Loss: **\$0.45**
📅 Expiry: **2025-08-08**
📈 Confidence: **70%**
🕒 Entry Timing: **Open**
---
### 💡 Tag It:
\#IWM #PutOptions #WeeklyTrade #BearishMomentum #RSIAlert #OptionsFlow #MaxPainTheory #VolatilityTrading #MarketOutlook #TradingView #OptionsAlert
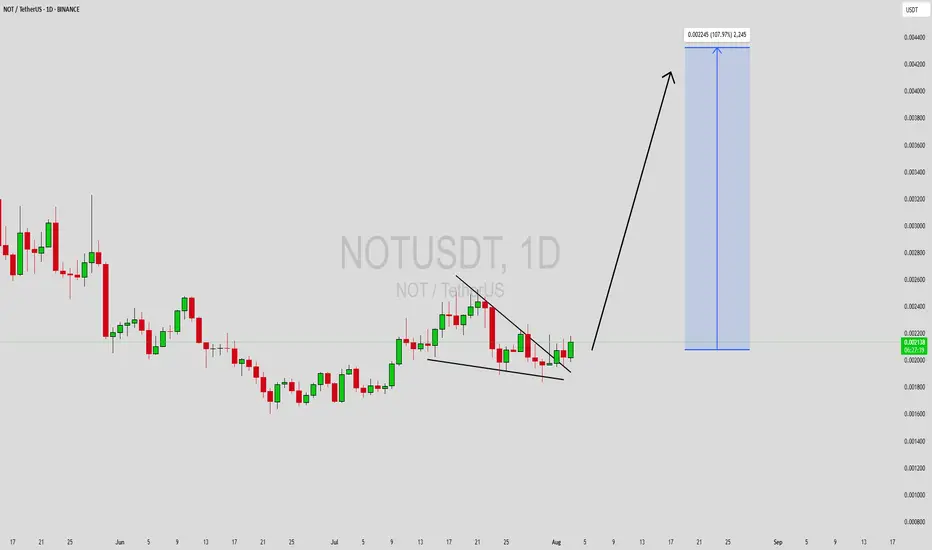
NOTUSDT Forming Falling WedgeNOTUSDT is forming a textbook falling wedge pattern, a well-known bullish reversal signal in technical analysis. After an extended downtrend, the price action has begun to consolidate within a narrowing range, indicating a potential breakout is imminent. Falling wedge formations often lead to explosive upward moves once the price breaks above the upper trendline resistance. With volume gradually picking up and bullish momentum building, NOTUSDT appears poised for a significant rally.
Traders and investors are closely watching this pair due to its high potential for a breakout. Historical price behavior around current levels shows strong accumulation, and the volume profile supports a bullish breakout scenario. The expected upside target projects a gain between 90% to 100%+ if the wedge pattern plays out as anticipated. This setup offers a strong risk-reward opportunity for those looking to catch an early trend reversal.
Market sentiment around NOT (Notcoin) has improved notably, fueled by its strong community, emerging utility in the Telegram ecosystem, and listing support from major exchanges. These fundamentals are adding confidence to the technical setup. The price currently sits at a critical juncture, and a breakout above resistance could attract significant attention and trigger FOMO among retail traders.
As always, confirmation is key—traders should wait for a strong breakout with increased volume before entering. Once confirmed, NOTUSDT could rapidly push toward its upper targets, making this a high-potential trade setup.
✅ Show your support by hitting the like button and
✅ Leaving a comment below! (What is You opinion about this Coin)
Your feedback and engagement keep me inspired to share more insightful market analysis with you!
AMD Don't Miss Out
### 🚀 \ NASDAQ:AMD Bullish Reversal Play — Weekly Options Setup
**🔥 Institutional Flow + RSI Momentum + Volume Surge = Opportunity**
---
📊 **Model Consensus Summary (Grok, Claude, Gemini, Llama, DeepSeek):**
* **🟢 Weekly RSI:** Climbing ⬆️ — confirms trend
* **🔴 Daily RSI:** Slight dip = caution, but **volume overrides**
* **💰 Call/Put Ratio:** 2.00 → **Big Money** loading calls
* **📈 Volume Spike:** 1.7x last week → institutional confirmation
* **🧠 AI Sector Tailwind:** Adds strong narrative fuel
---
### 🎯 Trade Setup – 5D Weekly CALL
| 🧾 Entry | 🎯 Target | 🛑 Stop Loss | 🎲 Risk/Reward | 📅 Expiry |
| -------- | --------------------------- | ------------ | --------------- | ---------- |
| \$4.40 | \$6.75 (TP1) / \$9.00 (TP2) | \$2.60 | 1:1.78 / 1:3.46 | 2025-08-08 |
**📌 Strike:** \$180.00
**🎯 Strategy:** Naked CALL (single-leg)
**⏰ Entry:** Market open
**✅ Confidence:** 75%
**⚠️ Risk Flag:** Short-term volatility from daily RSI dip
**🔍 SL based on 40% drawdown tolerance**
---
### 📣 TL;DR
> **“Smart money is early. Momentum is building. AMD could break out hard.”**
> 🔸 Weekly RSI + Volume + Calls = Setup
> 🔸 Short-dated play for aggressive profits
> 🔸 Tight stop, wide upside
---
### 💡 Tag It:
\#AMD #OptionsTrading #WeeklySetup #TradingSignals #AIStocks #InstitutionalFlow #RSI #CallOptions #MomentumPlay #TradingView #SwingTrade

KAIA Bullish DivergenceBINANCE:KAIAUSDT
Trade Setup:
Target 1: 0.1472 (0.786 Fibonnaci Golden Zone).
Target 2: 0.1544 (0.618 Fibonnaci Golden Zone).
Target 3: 0.1594 (0.5 Fibonnaci Golden Zone).
Target 4: 0.1808 (0 Fibonnaci).
Stop Loss: 0.1265 (1.272 Fibonnaci).
RSI Analysis: The RSI is showing a bullish divergence, suggesting potential bullish momentum. The current RSI is around 21.23, approaching oversold territory, so caution is advised.

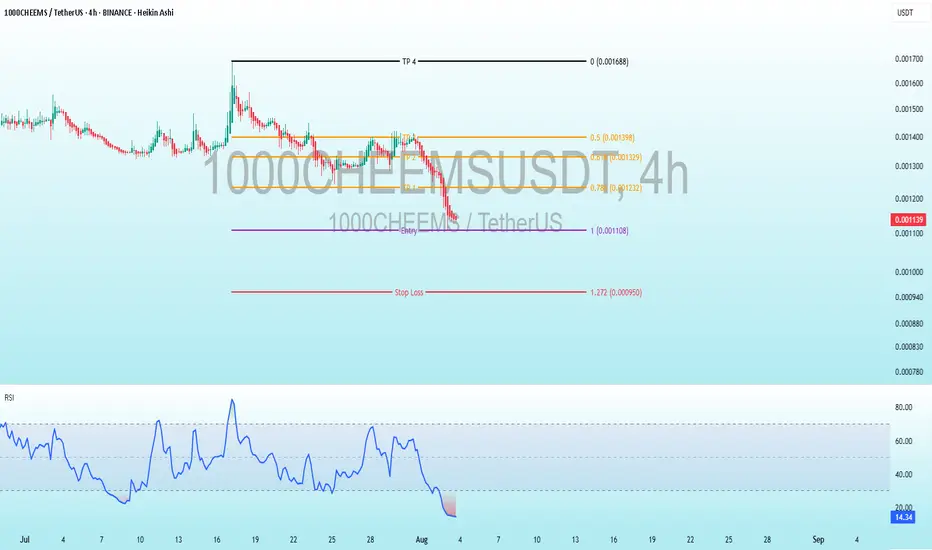
1000CHEEMS Bullish DivergenceBINANCE:1000CHEEMSUSDT
Trade Setup:
Target 1: 0.001232 (0.786 Fibonnaci Golden Zone).
Target 2: 0.001329 (0.618 Fibonnaci Golden Zone).
Target 3: 0.001398 (0.5 Fibonnaci Golden Zone).
Target 4: 0.001688 (0 Fibonnaci).
Stop Loss: 0.000950 (1.272 Fibonnaci).
RSI Analysis: The RSI is showing a bullish divergence, suggesting potential bullish momentum. The current RSI is around 14.36, approaching oversold territory, so caution is advised.
APT 4H – Holding the Higher Low, But Will Bulls Follow Through?APT is holding at a critical demand zone, testing both trendline support and prior consolidation structure.
Price action is forming a potential higher low, with a bullish reaction candle and a sharp Stoch RSI reversal from oversold.
🧠 What to Watch:
– Breakout from descending structure
– Higher high confirmation above $4.60
– Volume follow-through on breakout
This setup offers clean risk: a breakdown invalidates quickly, but if buyers step in here, it could fuel a sharp leg back to $5+.
