OP 4H – Bounce From Golden Pocket, But Will It Hold Above $0.65?Optimism is bouncing directly from the 0.618 Fibonacci retracement ($0.620), showing respect to the golden pocket region — but with Stoch RSI flipping into overbought, this bounce could be tested quickly.
📊 Fibonacci Zones:
– 0.5 = $0.668
– 0.618 = $0.620 (current reaction)
– 0.786 = $0.551 (last line of defense)
So far, the reaction is strong — but to confirm continuation, bulls will need to reclaim the $0.66–$0.68 range with volume.
A failure to hold may trigger a deeper move toward $0.55.
Harmonic Patterns

Dow Jones August GameplanNow that the first trading day of August has printed, can one reliably forecast the possible month based on just the first day? I am inclined to believe that one can with a small amount of accuracy. Not perfect.
There are two types of monthly cycles when the first traded day is a bearish candle right from the open of the month.
Type 1 is a bearish trending cycle that trends lower and lower. It is then followed up by small number of bullish pullbacks halfway through the month before rolling back over and closing near the lows.
Type 2, more common, is when the first traded day is bearish right from the get-go as well, trades lower but reverses near the beginning of the month before trading higher than the open and forming a bullish bar.
So, in my opinion, there are only two probably outcomes for August.
Type 1:
Type 2:

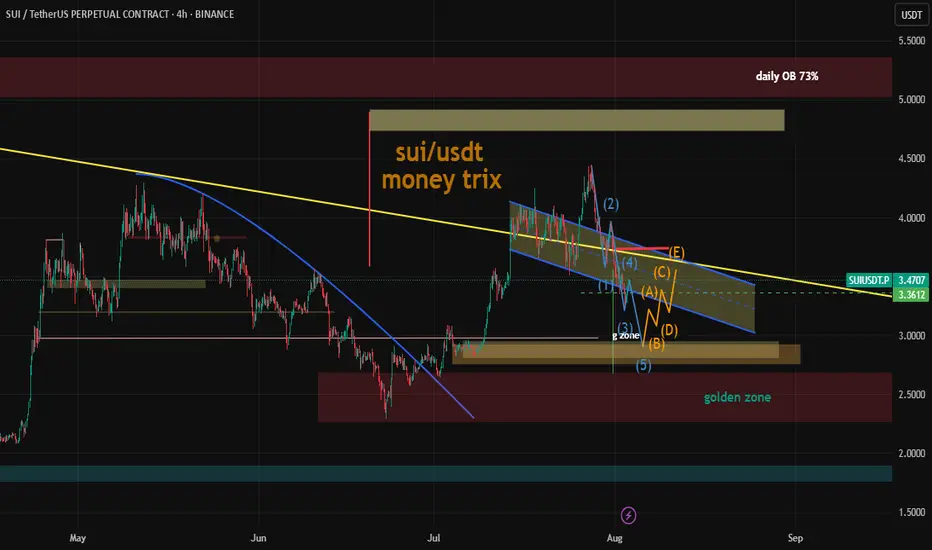
SUI 4H – Rejected From Resistance, But Fib Golden Pocket NearSUI just cleanly rejected from a major supply zone near $4.40 — now pulling back into a deep retracement zone that’s historically acted as support.
The 0.5–0.786 Fibonacci levels align perfectly with a previous structure zone, making this a key area for potential bounce setups.
🔹 0.5 = $3.09
🔹 0.618 = $2.77
🔹 0.786 = $2.31
Momentum indicators like Stoch RSI are also rotating downward, suggesting room for a full reset.
⚠️ If buyers step in at the golden pocket, expect volatility. If not — we could revisit May’s lows.

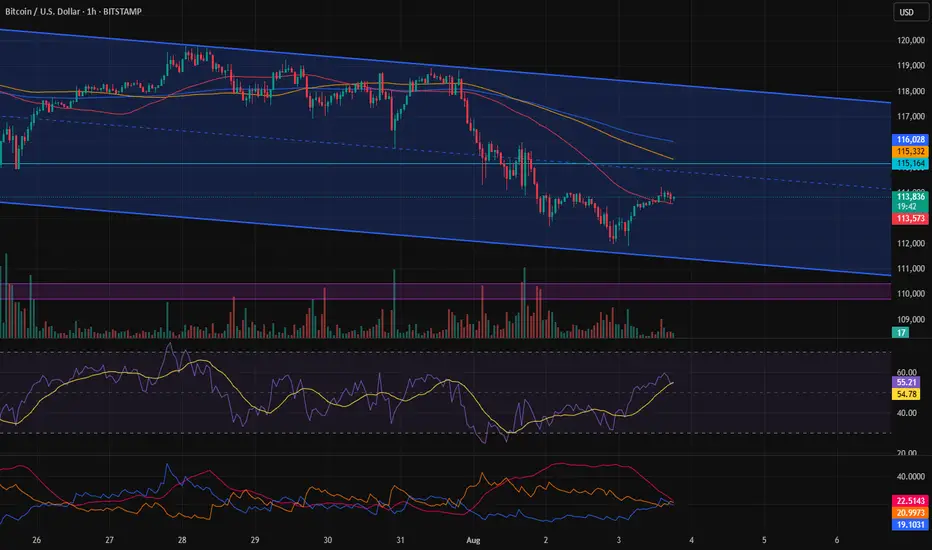
End of the correction and continuation of the drop?Given the recent days of decline, it’s become much harder for Bitcoin to move up. It needs significant volume to break through the resistances ahead, and from a technical perspective, I don’t see that volume. I prefer a bearish scenario for now, as it could offer better short opportunities.
XAUUSD We can expect a nasty spike towards the downside at market open. Overall, price is bearish for this coming week but bullish for the long run. We may see price test 3150 before the end of this week.

Solanawe can see price, going in perfect channels all price level are golden levels, So we look to buy dip between 137 and 145, next target will be 220$

#Bitcoin Sunday Update $BTC bounced from the $112,398 support #Bitcoin Sunday Update
CRYPTOCAP:BTC bounced from the $112,398 support and is now trading above $113,700. If it holds above this level, a push toward $120K is likely. However, if downside continues, next key support sits near $110K — both supports could trigger a rebound toward $120K. Stay alert for range play before breakout.

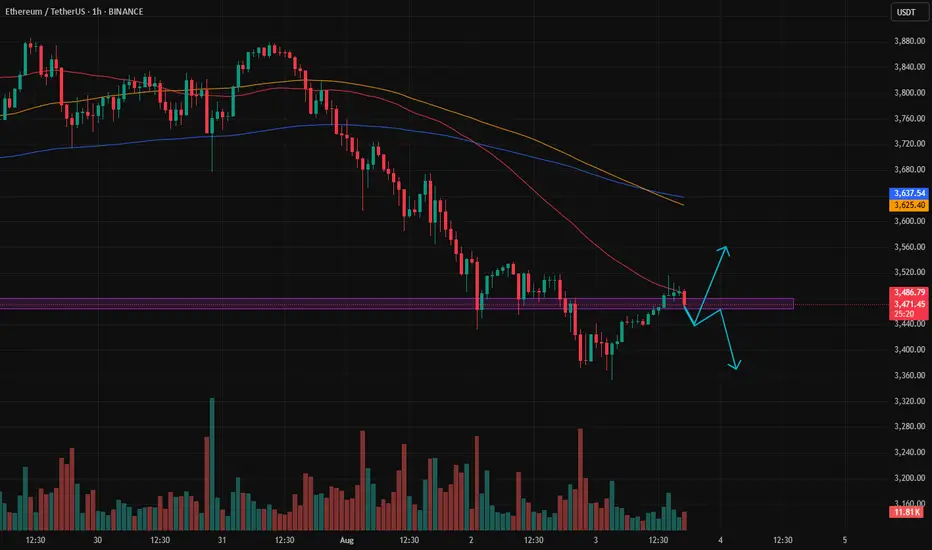
Patience to identify the market trendBased on the previous analysis, after hitting the sell target, the price made an upward correction.
Right now, it’s unclear whether we’re seeing the beginning of a trend reversal to the upside, or if the price is going to drop back below the zone, giving us another short opportunity.
If it does drop again, there’s a possibility it could fall as far as 3000.
We need to be patient and let the market show its hand — then we can respond accordingly.
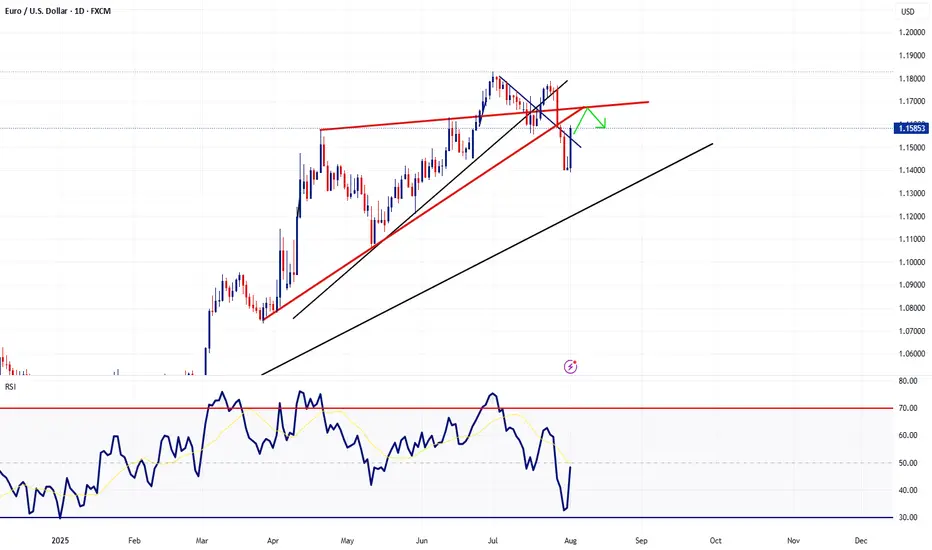
EURUSD - Scaling into Confluence ZoneTaking a look at EURUSD on the daily timeframe we had quite the rebound in EURUSD last Friday following the NFP report. However price action is now heading towards a cluster of resistance levels which is why I'm implement my scaling in technique using a specially designed and programmed EA that i use for MT5.
== TRADE PLAN ==
Scale-in with short positions and target a 0.5% growth on the account. In other words, once the basket arrives in profit by 0.5% CLOSE ALL.
Trade Safe - Trade Well
BTCUSD CORRECTIONBTCUSD just met strong supply at 120 K, showing clear distribution from large sellers, yet price still respects the primary rising trendline. Below, absorption blocks cluster at 110 K–105 K where bids keep stepping in.
Targets:
• Upside — 125 K if the trendline holds and 120 K is reclaimed.
• Downside — 110 K on a break of trend support.
#BTCUSD #globaltrade #investment #investing #stockmarket #wealth #realestate #markets #economy #finance #money #forex #trading #price #business #currency #blockchain #crypto #cryptocurrency #airdrop #btc #ethereum #ico #altcoin #cryptonews #Bitcoin #ipo

Target 3470 Tests zone Gold will going towards 3470/3480 zone for retesting area its because of fill imbalance over long term candle stick , Two area need to watched one 3470/3480 or 3520

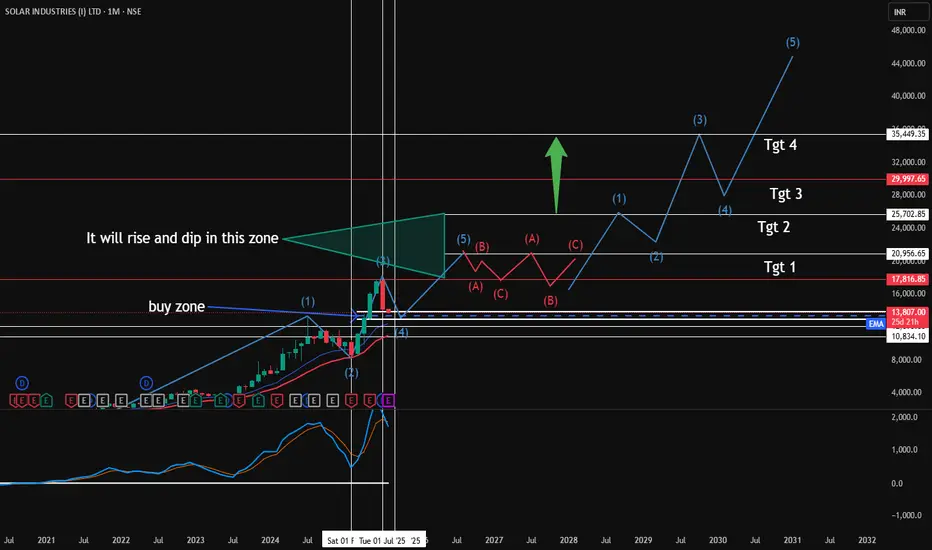
Share over view of long term 10 yearsExpected path and view.
This for educational purpose only. Not buying or selling recomendation
#GBPUSD A bearish sign where sellers are getting strengthAn expected bearish move where sellers are getting strength against buyers. A strong supply zone where we can make a huge green pips with sellers. #GBPUSD #forex #fx #fxtrading

sui/usdt 4h analysis run for 10-15 days soon it will touch golden zone but point of invalidation will be updated soon after btc closing and others.d vs btc.d thats how i analyse but DYOR b4 jump and manage your trades accordingliy its financial ocean
Multi-Timeframe Market Analysis – Bullish Opportunity Setting U🔍 Multi-Timeframe Market Analysis – Bullish Opportunity Setting Up?
I’ve been closely tracking a potential bullish setup using a multi-timeframe approach. Here’s a quick breakdown:
📅 Weekly Timeframe:
Price is currently trading inside a Weekly Type 2 Bullish Fair Value Gap (FVG) — a key higher timeframe support zone.
No bearish break on weekly structure yet, so bullish bias remains valid unless this FVG fails.
📉 Daily Timeframe:
We’re seeing a bearish orderflow leg, but this is unfolding within the weekly bullish FVG, reducing confidence in downside continuation.
My bias here: Neutral to bullish, watching lower timeframes for confirmation.
⏳ H4 Timeframe:
A dealing range is forming, hinting at potential accumulation or reversal.
Since this is happening after price tapped the weekly FVG, I suspect smart money is accumulating long positions.
I’ll be watching for bullish FVG formation within this range to confirm the setup.
⏱ Lower Timeframes (H1–M15):
Looking for internal liquidity sweeps followed by bullish FVGs.
These will be my entry triggers, with targets at external liquidity levels like daily swing highs.
🎯 My Trading Plan:
Favoring buy setups unless weekly FVG is invalidated.
Focused on H4 breakout and lower timeframe confirmation.
Risk managed entries only, with clear invalidation and targets.
💬 How do you approach multi-timeframe confluence in your trades? Drop your thoughts below!
#Trading #Forex #TechnicalAnalysis #SmartMoney #FVG #MarketStructure #Liquidity #MultiTimeframe #PriceAction #TraderMindset #SwingTrading

Buy usdjpyOur last buying idea already running 500+ pips in buying
Now more buy expected after a lil more retracment

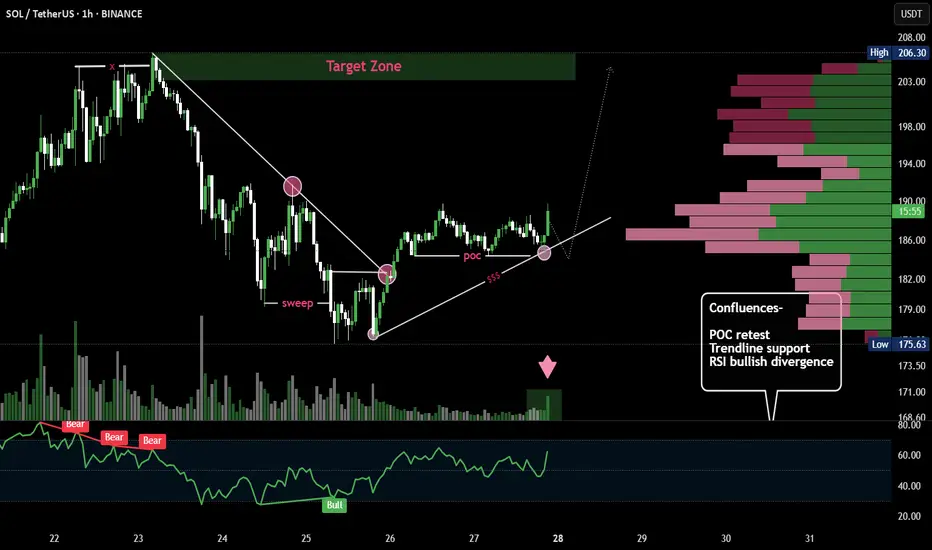
SOL/USDT 1H Chart – Technical Analysis BreakdownTrend Reversal Structure: Price broke out of a descending trendline after sweeping prior lows (liquidity grab), indicating a possible bullish reversal setup.
Point of Control (POC): Price is currently retesting the POC area (high-volume node), aligning with the trendline and prior support — a potential bounce zone.
RSI Divergence: Bullish RSI divergence marked near the sweep confirms the loss of bearish momentum, strengthening the case for upward continuation.
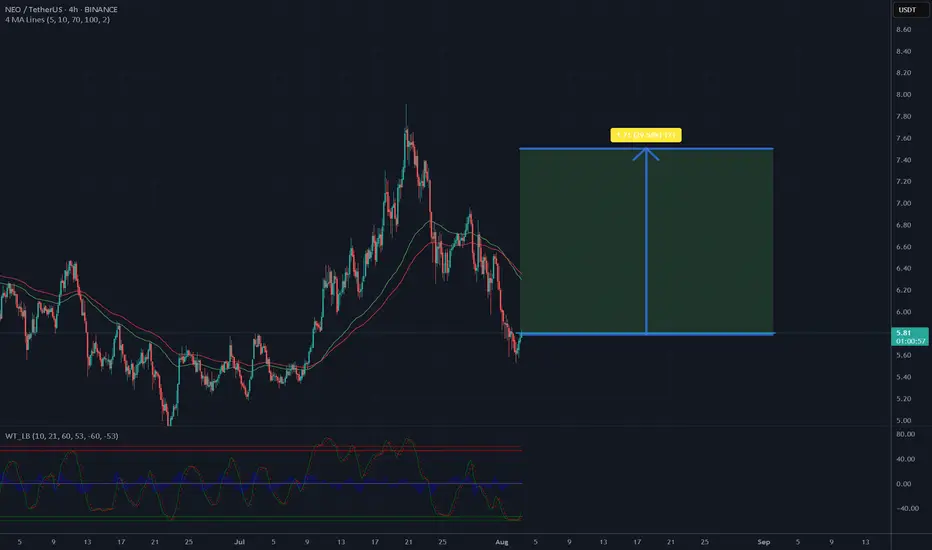
Is it a time for NEOUSDT? 30% potential profit - 7.50 USD targetThe chart shows a 4-hour candlestick pattern for NEO/USDT on Binance, covering mid-July to early August 2025. The price has recently declined from a peak near 8.81 USD to the current level of 5.76 USD, indicating a significant pullback. The moving averages (red and green lines) suggest a bearish trend with a crossover, but the price is approaching a support level around 5.5 USD. The oscillator at the bottom shows oversold conditions with a slight upward movement, hinting at a potential reversal. If buying volume increases and the support holds, a recovery to 7.50 USD appears achievable in the near term, aligning with the previous resistance zone.
Potential TP: 7.50 USD
Sell eurjpy More selling expected
Still valid for sellers
Respecting its weekly supply level
Targat still 161.000

EURUSD Trade Plan 03/08/2025Dear Trader,
The price was propelled upwards from the 1.14 range on Friday. I expect the price to rise in a corrective wave towards the 1.16500-1.17000 area. From there, after confirming a rejection, I will enter a sell position with a target at 1.14 and then 1.11
Regards,
Alireza!

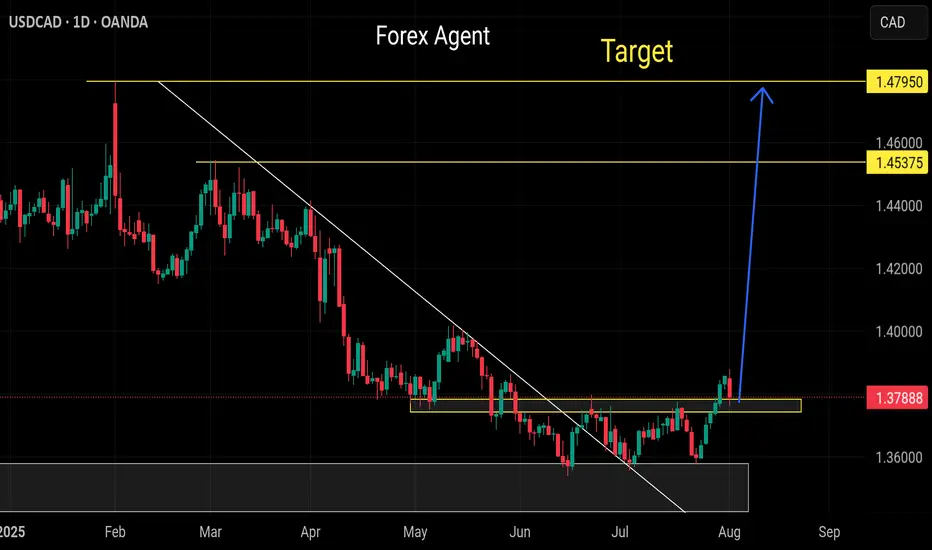
Strong buy usdcadOur last buying idea already running 200+ pips
More bullish correction expected
Daily down trend breaks
Respecting fresh support level
800+ pips minimum target
Buy usdchfStrong bullish continue from fresh support level
Our last buying idea already running 200+ pips
More bullish correction expected minimum 500+ pips

FTTUSDT – new accumulation in an interesting zone🚨 This information is intended for thoughtful market participants who are willing to work in this field - not for those chasing gambling, guesswork, or getting stuck in news flow.
Price has returned to the support zone of the outer horizontal channel. Accumulation is currently taking place in this area.
📰 FTX is preparing for its third round of distributions - $1.9 billion, expected around September 30. Marked it on the chart. Whether they shift the date or not, the essence remains unchanged.
Possible scenarios:
1️⃣ A double bottom forms in the lower zone of the channel, with a pattern range of about 60%.
👇
- - - - - - - - - - - - - - - - - - - - - - - - - - - - - - - - - - - - - - - - - - - - - - - - -
2️⃣ Another option is a descending wedge, followed by a breakout on volume, a retest of the breakout zone, and further continuation.
👇
- - - - - - - - - - - - - - - - - - - - - - - - - - - - - - - - - - - - - - - - - - - - - - - - -
3️⃣ Next scenario: sideways consolidation within the current zone, with an inner range of 40% and outer range of 90%, followed by a breakout and movement toward the main targets of the larger channel.
👇
- - - - - - - - - - - - - - - - - - - - - - - - - - - - - - - - - - - - - - - - - - - - - - - - -
❗ I marked the downward (protective) zones on the chart that should be taken into account for each of the proposed scenarios — to align with your strategy. This is important. First the plan - then action.
👇
- - - - - - - - - - - - - - - - - - - - - - - - - - - - - - - - - - - - - - - - - - - - - - - - -
📌 P.S. In fact, everything is simpler than it seems.
I believe time is a key factor.
The main thing is to be ready for different scenarios before the final move.
There’s nothing to guess here.
Even if you add another pattern, it won’t change the core idea.
