Seven topics explaining why Ethereum might be heading towards atSeven topics explaining why Ethereum might be heading towards at least $4,500 after returning to its trend:
1. Market Sentiment and Bullish Reversal
When Ethereum breaks out of a consolidation phase or a downtrend, it often signals a shift in market psychology. A bullish reversal can be triggered by technical patterns such as ascending triangles, breakouts above key resistance levels, or bullish candlestick formations. Positive news (e.g., regulatory clarity, major partnerships, or favorable market reports) enhances investor confidence. Once traders recognize a trend reversal, it leads to increased buying momentum, further propelling ETH higher. This shift in sentiment often acts as a self-fulfilling prophecy, attracting more capital into the asset.
2. Institutional Adoption and Investment
Institutional investors, including hedge funds, asset managers, and pension funds, play a crucial role in cryptocurrency price dynamics. Large-scale investments, ETFs, or custodial solutions designed for institutional clients can generate significant buy pressure. Notable endorsements from major financial firms or integration of Ethereum-based products into mainstream financial platforms can serve as a validation, encouraging broader participation. This institutional involvement often brings stability and confidence, supporting sustained upward movement towards higher targets like $4,500.
3. DeFi and NFT Growth
Ethereum's ecosystem is the backbone of the decentralized finance (DeFi) sector and NFTs. The expanding adoption of DeFi applications (lending, borrowing, staking) and booming NFT markets increase demand for ETH, since it is essential for transaction fees and smart contract execution. As new projects and use cases emerge, the utility of ETH grows, directly impacting its value. Additionally, mainstream adoption of DeFi and NFTs draws more retail and institutional investors into the ecosystem, contributing to price appreciation.
4. Network Developments
Ethereum continues to undergo significant upgrades to address scalability, security, and sustainability. Ethereum 2.0, with features like proof-of-stake (PoS) consensus, shard chains, and Layer 2 scaling solutions (like Rollups), greatly enhance network efficiency. These upgrades improve user experience and reduce transaction costs, making Ethereum more attractive for developers and users. The improving technology infrastructure can result in increased transaction volume, user activity, and investor confidence, which collectively drive the price upward.
5. Macro and Cryptocurrency Market Factors
Broader macroeconomic conditions influence Ethereum’s price. A declining dollar, inflation concerns, or global economic uncertainty can push investors toward alternative assets like cryptocurrencies. Bitcoin’s market movement often correlates with ETH, and a bullish Bitcoin trend can lift ETH prices as well. Additionally, positive regulatory developments or a general rally in the crypto market can create a favorable environment, supporting Ethereum’s ascent to higher levels.
6. Technical Indicators
Traders rely heavily on technical analysis. Breakouts above significant resistance levels (e.g., previous highs around $3,500 or $4,000), increased trading volume, and bullish chart patterns such as flags or bullish divergence reinforce the upward trend. These technical signals attract momentum traders and institutional players, which accelerate the price increase. Consistent bullish technicals contribute to a self-sustaining upward trajectory toward the $4,500 target.
7. Supply Dynamics
Ethereum's supply mechanics significantly influence its price. The implementation of EIP-1559 introduced a fee-burning mechanism that reduces circulating supply over time, creating a deflationary pressure. When network activity is high, more ETH is burned, decreasing supply and potentially increasing scarcity. Furthermore, the transition to Ethereum 2.0's proof-of-stake reduces issuance, limiting new ETH supply entering the market. These supply-side dynamics, combined with growing demand, can lead to significant appreciation, moving ETH toward and beyond the $4,500 level.
Harmonic Patterns

Sell gbpusdOur last selling idea already running 400+ pips in sell
Now market structure clear for sellers
Daily trend broken making lower lows and lower high
In our view we more looking sell
Monthly selling engulfed
More sell side minimum 600+ pips

Bitcoin Price Analysis and Market Outlook (Next: $118,100)Bitcoin Price Analysis and Market Outlook (Next: $118,100)

USDJPY BUYThe year will be politically marked by Trump’s return to the White House. A Republican government is seen as positive for financial markets, but Trump’s pledge to cut taxes and impose tariffs on foreign goods and services may introduce uncertainty to both the political and economic landscape.
In Japan, political uncertainty looms, as the ruling Liberal Democratic Party (LDP) lacks a parliamentary majority and may call fresh elections. An LDP victory could strengthen the Yen by ensuring stability, while opposition gains might lead to fiscal expansion and weaken the currency. If no elections occur, a modest budget would likely keep the Yen supported.
In terms of monetary policy, the Fed and BoJ are set to diverge in monetary policy. The Fed expects to deliver only two additional rate cuts in 2025, the BoJ is expected to maintain its dovish stance, avoiding rate hikes amid weak inflation and a shrinking economy, leaving the Yen vulnerable to market disappointment over policy inaction
SUPPORT 149.232
SUPPORT 148.598
SUPPORT 147.963
RESISTANCE 147.285
RESISTANCE 146.913


EURUSD : Status @ 1/8Direction: Buy
Signal triggered: 1/8/2025
Stop when:
a) Stop Loss @ 1.1400; or if
b) Buy signal triggered
Action:
Buy the dip (or not at all)
Good luck.
P/S: Price has made a sudden rise, and it would not be wise to buy now. It is better to wait for the sell signal.
The day before the big rise, the signal was hesitant to give a BUY. I think the MARKET is unsure as well. Price can move either way. Missing out is not necessarily a bad idea, as such moves can easily result in huge losses.

$BTC.D🩸 CRYPTOCAP:BTC.D ⁀➷
#BitcoinDominance. Macro chart Another
💯 Intermediate Target - 48%
🚩 Macro Target 1 — 44 %
🚩 Macro Target 2 — 40 %
🚩 Macro Target 3 — 35 %
- Not financial advice, trade with caution.
#Crypto #BitcoinDominance #BTC.D #Investment
✅ Stay updated on market news and developments that may influence the price of Bitcoin Dominance. Positive or negative news can significantly impact the cryptocurrency's value.
✅ Exercise patience and discipline when executing your trading plan. Avoid making impulsive decisions driven by emotions, and adhere to your strategy even during periods of market volatility.
✅ Remember that trading always involves risk, and there are no guarantees of profit. Conduct thorough research, analyze market conditions, and be prepared for various scenarios. Trade only with funds you can afford to lose and avoid excessive risk-taking.

Gold Trend Reversal: MSS Completed Eyes on OB and Breaker Block!The gold market has executed a Market Structure Shift (MSS) in the New York session, indicating a trend reversal. Initially, the market made a Break of Structure (BoS) to the upside, but later dropped sharply and closed below the MSS level, confirming a bearish shift. Currently, the market is likely entering a retracement phase and may look to fill its Pending Demand (PD) arrays.
There are two critical levels from which the market could potentially drop again:
1. The first is an Order Block (OB).
2. The second is a Breaker Block (BB).
Keep a close watch on these two levels. If the market returns to either and presents bearish confirmation signals, it could resume the downward move towards swing lows.
Do Your Own Research (DYOR).

XAUUSD 4H Analysis – Smart Money Trap Setup🚨 Gold is currently reacting off mid-range demand, with a clear liquidity sweep + bullish push underway.
🔴 Key Supply Zones:
3,450–3,480 = Extreme high imbalance
3,400–3,420 = Previous consolidation before selloff
🟢 Key Demand Zone:
3,150–3,200 = Untouched demand zone and liquidity pool from May
📊 My Expectation:
Price is likely to induce breakout traders above 3,420–3,450, tap into premium supply, then aggressively reverse back into demand around 3,160.
🧠 Why this setup?
Equal highs = Liquidity trap 🔥
Price approaching unmitigated supply
Structure shift possible after sweep
SMC model: Buy into premium → Sell from supply → Target demand
🔻 Bearish Plan:
Wait for price to run above 3,450
Look for strong rejection / bearish OB / SFP
Enter short → Target 3,160 zone
💬 What do you think?
Will XAUUSD break this supply or fall from there?
📍Like + comment your thoughts below!
📌 Follow for daily Smart Money charts 🔐
#XAUUSD #GOLD #SMC #ICT #Liquidity #Forex #SmartMoney #PriceAction #GoldAnalysis #OrderBlock

Gold Trade Plan 31/07/2025Dear Traders,
3304-3307 is very important area for Gold,
Pay close attention to the 3303-3307 zone. If you see a rejection in this area, you can enter a sell position.
if Fix above 3305------> 3351
IF Fix below 3305----->3267 (again)
Regards,
Alireza

Gold Weekly Outlook. 03.08.2025, SundayCOMEX:GC1!
Expecting a run up to daily BPR. Previous weekly closure suggesting bullish price action on Gold. Paytience is the key

BTC Trade Plan 03/08/2025 - where to buy BTC?Dear Trader,
Bitcoin's price is currently moving within a double channel, with the midline of the channel around 108,000. The first scenario is that the price reaches the midline of the channel and then starts an upward movement. The second scenario involves a sharp downward move towards a stop hunt target around 97,000-100,000. In both cases, as long as the price remains above the 100822 level(Daily Close), the bullish trend will continue.
Regards,
Alireza!

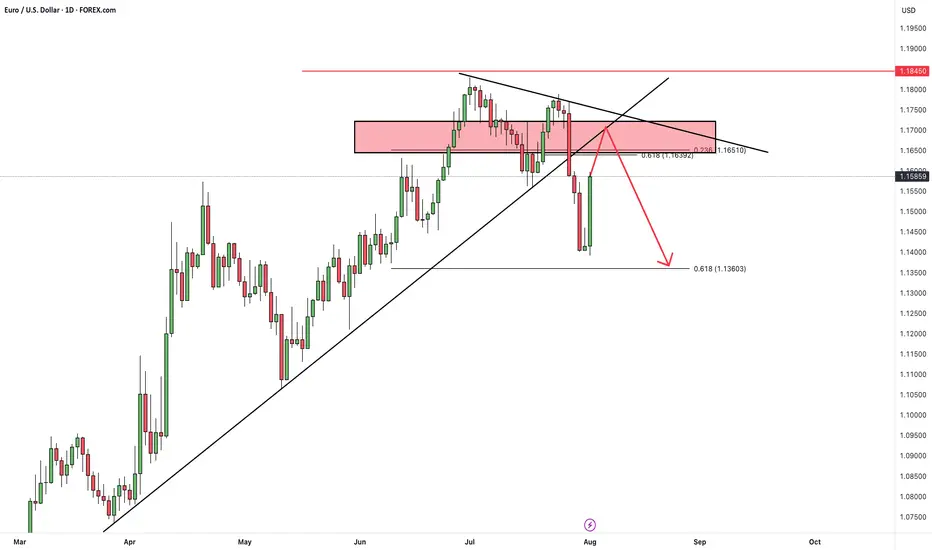
EURUSDHello Traders! 👋
What are your thoughts on EURUSD?
After last week's sharp decline, EUR/USD rebounded slightly on Friday, initiating a corrective move to the upside.
We anticipate this retracement to extend over the next few days, likely reaching the broken trendline and former support zone, which now acts as resistance.
As long as the pair remains below this resistance area, the bearish outlook remains valid.
Once the pullback is complete, we expect renewed downside pressure toward the next support levels.
💬 Is this just a corrective move before another leg down? Let us know your thoughts below! 👇
Don’t forget to like and share your thoughts in the comments! ❤️
USD/CAD Daily - Triple Bottom Breakout PatternUSD/CAD Daily – Triple Bottom Breakout
The USD/CAD pair on the 1D chart has formed a Triple Bottom pattern, a classic bullish reversal setup after a downtrend. This pattern suggests that sellers were unable to push the price below the established support zone on three separate occasions, signaling strong buying interest.
🔍 Chart Highlights:
Three distinct lows at a consistent support level
Strong bounce after each test of support, confirming bullish defense
Neckline (resistance line) successfully broken, indicating a breakout
Price target projected from the height of the pattern added to the breakout level
📈 Pattern: Triple Bottom
📍 Breakout Level (Neckline): Around 1.37800
🎯 Target: Approx. 1.42000
🛑 Invalidation: A daily close back below the neckline
This breakout may indicate the beginning of a bullish trend continuation, with momentum favoring the bulls as long as price holds above the neckline.

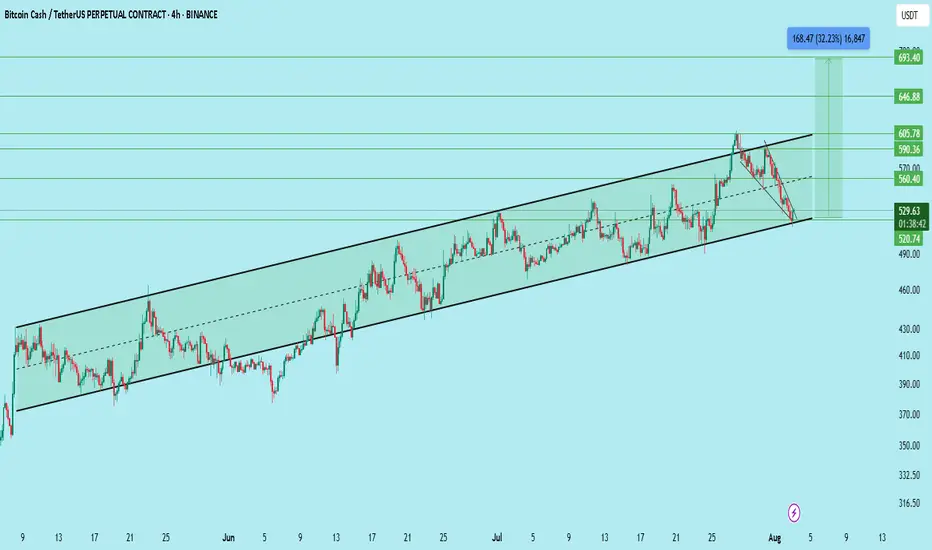
BCHUSDT : Potential Long Setup – Trendline Support Falling WedgeBCH has been trading in a well-defined ascending channel on the 4H chart. After multiple higher highs and higher lows, price recently corrected to the channel support and formed a falling wedge — a bullish reversal pattern.
Current Price: ~$528
Entry Zone: $520–$540
Stop Loss: Below $495 (clean invalidation below channel support)
Targets:
TP1: $560
TP2: $590
TP3: $605
TP4: $646
TP5: $693
Potential Upside: +32% from entry zone
Analysis:
The falling wedge breakout near channel support confirms buyer interest.
Volume drop during the correction phase supports bullish reversal conditions.
Risk-reward ratio favorable near the channel low.
Trade Plan:
Start building position between $520–$540 using DCA. Keep SL below $495. Expect gradual move toward the upper resistance zones if the breakout sustains.
Watch for breakout confirmation above $540–$550 for momentum entry.
DYOR | Not Financial Advice
US10YTHE non farm employment data report has given us a reason to sell of US10Y.the lower than forecast of 73K was a big shock ,the slower job growth reflects caution amongst employers amid uncertainties related to tariff, trade and immigration policies. Wages grew with average hourly earnings increasing about 0.3% month over month. overall, the labor market shows signs of cooling but remains fundamentally resilient with payroll gains still keeping pace with working age population growth.
the US10Y COULD SLIP DOWN MORE ON ECENONOMIC OUTLOOK,IF THEY DONT DEFEND THE DEMAND FLOOR .
#US10Y #BONDS #YIELD

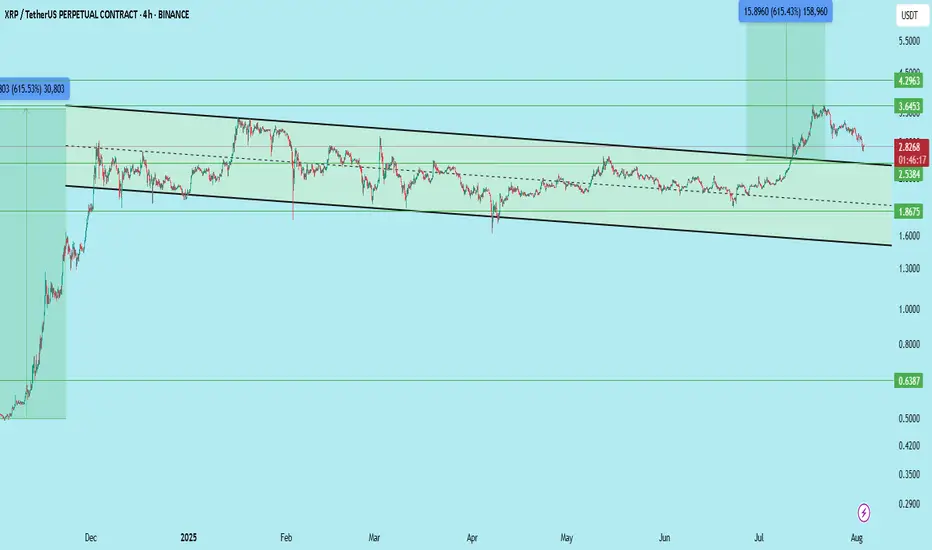
#XRP/USDT – Breakout from Downward Channel | Bullish OutlookXRP has finally broken out of the long-standing downward parallel channel on the 4H chart — a strong bullish signal supported by volume and structure shift.
Falling Channel Structure:
XRP had been consolidating within a well-defined descending channel since late 2024. This structure capped price advances and formed a strong resistance ceiling.
Breakout Confirmation:
Recent price action cleanly broke above the upper trendline with volume expansion, followed by a classic retest of the breakout zone near 2.53, confirming the breakout is valid and not a fakeout.
Volume Analysis:
Breakout was supported by a noticeable increase in buying volume. The retest phase is happening on reduced volume, which is typical for a healthy bullish structure.
Support Zones:
2.53 – Key breakout level and current support
1.87 – Mid-channel level, strong previous base
0.638 – Long-term demand zone (unlikely to revisit unless severe macro breakdown)
Resistance Levels / Targets:
3.64 – Local resistance, recent swing high
4.29 – Major horizontal resistance
Further upside open if macro trend remains bullish
Setup Summary:
Structure: Falling Channel → Breakout → Retest
Entry Zone: Between 2.53 and CMP (~2.83) using DCA
Stop Loss: Below 2.38 to protect against fakeouts
Targets:
TP1: 3.64
TP2: 4.29
Long-Term Open
Why This Matters:
XRP breaking out of a 9-month downtrend indicates a major sentiment shift.
Similar breakouts in the past have led to 600%+ moves, and current structure resembles that setup.
Macro trend shows buyers stepping in with conviction.
DYOR | Not Financial Advice
GOATUSDT Retest at Key Demand Zone – Accumulation or Breakdown?🔍 Comprehensive Technical Analysis
After experiencing a prolonged downtrend since late 2024, GOATUSDT finally broke out of a long-term descending trendline in early May 2025 — a potential early signal of a medium-term trend reversal. However, the price has now pulled back, retesting a major support zone that coincides with the previous breakout structure.
---
🧱 Key Zone: Demand Area + Trendline Retest
Price is currently trading within a crucial demand zone between $0.090 – $0.100, which previously acted as a major resistance and now serves as support. This area is technically significant due to:
Confluence of horizontal support and the retest of the descending trendline.
A previous accumulation zone that led to a breakout.
Clear historical buyer reaction from this region.
---
📐 Price Structure & Pattern
Descending Triangle Breakout: Successfully broken to the upside in May.
Support-turned-Resistance-turned-Support: A classic structure flip.
Horizontal Consolidation: Price is ranging in a narrow zone, indicating either accumulation or distribution.
---
🐂 Bullish Scenario (Potential Rebound):
If the price holds and bounces with increased volume from the $0.090 – $0.100 zone, it could confirm a strong accumulation phase and initiate the next leg up.
🎯 Bullish targets:
1. $0.15745 — Minor resistance
2. $0.21071 — Psychological and technical resistance
3. $0.24889 — Fibonacci extension level
4. $0.41017 — Mid-term breakout target
> Bullish confirmation: Bullish engulfing or hammer candle with high volume from the demand zone.
---
🐻 Bearish Scenario (Breakdown Risk):
If the price breaks below $0.093 and closes with strong bearish volume, this may confirm weakness and trigger a deeper correction.
📉 Downside targets:
$0.06500 — Minor historical support
$0.04900 — Previous base level
$0.03550 — All-time low (critical support)
> Bearish confirmation: Clean breakdown followed by a failed retest back into the range.
---
📊 Strategic Summary:
GOATUSDT is currently at a pivotal decision point. The zone between $0.093–$0.100 acts as a battleground for bulls and bears. A bounce could signal accumulation and a bullish reversal, while a breakdown could lead to continuation of the bearish trend.
🎯 Key focus: Price action and volume reaction at the demand zone.
---
🧲 Bullish Narrative Catalysts:
Renewed interest in low-cap altcoins
Gradual increase in volume since the breakout
Selling pressure weakening near key support
#GOATUSDT #CryptoBreakout #TrendlineRetest #TechnicalAnalysis #AltcoinAnalysis
#DemandZone #SmartMoneyConcepts #BreakoutOrFakeout

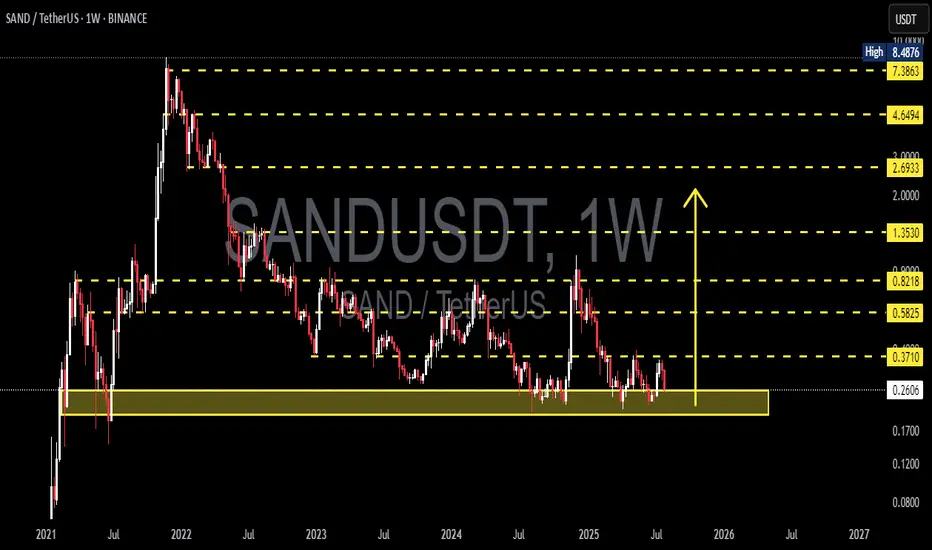
SAND/USDT Analysis – Major Accumulation or Imminent Breakdown?🔍 Overview:
SAND is currently trading at a crucial historical support zone, which has held firm multiple times since mid-2022. The chart shows a prolonged accumulation phase, offering significant potential for a major breakout or a decisive breakdown depending on market reaction.
---
🧠 Price Structure & Price Action:
After reaching an all-time high at $8.4876 in late 2021, SAND has been in a long-term downtrend.
However, over the past year, it has formed a wide base around the $0.26–$0.37 range — a clear sign of potential accumulation.
Price is currently moving sideways in a compression structure, signaling the build-up of energy for the next explosive move.
---
🧱 Key Levels:
Level Function Status
$0.2613 Primary Historical Support Currently being tested
$0.3710 Local Resistance Needs to be reclaimed
$0.5825 Major Resistance Bullish confirmation level
$0.8218 Weekly S/R Flip Mid-range target
$1.3530 Psychological Resistance Potential medium-term target
$2.6933 / $4.6494 Expansion Phase Targets Long-term upside potential
$7.3863 Pre-ATH Resistance Late-cycle target
---
🟢 Bullish Scenario:
1. If price holds and bounces off the $0.26–$0.37 demand zone, a bullish reversal may unfold.
2. A weekly close above $0.3710 would be the first sign of strength.
3. Breaking $0.5825 with solid volume would confirm trend reversal and open the path toward $0.82 – $1.35.
📌 Additional Bullish Confirmation:
Bullish divergence on RSI (if present)
Increasing volume during upward moves
---
🔴 Bearish Scenario:
1. A clear breakdown below $0.2613 on the weekly timeframe would signal a loss of major support.
2. This opens downside risk toward:
$0.17
$0.12
Possibly even $0.08 if the market seeks a deeper revaluation.
3. Such a move would likely represent a full structure reset.
📌 Additional Bearish Confirmation:
Strong bearish candles with high volume
Weak or no bullish reaction within the demand zone
---
🔁 Formations in Play:
Accumulation Rectangle: A sideways range often found at market bottoms before new bull cycles.
Multi-year Base Formation: Can serve as a launchpad for major parabolic moves if resistance is broken.
---
📚 Conclusion:
SAND is at a make-or-break zone. The market is coiled like a spring — preparing either for a new bullish expansion or for further downside pain. Smart traders and investors will:
Wait for breakout confirmation
Or exit positions on breakdown signals
This is a golden zone for preparation, not reaction.
---
📌 Suggested Trading Plan:
✅ Bullish Bias: Scale in within support zone; tight stop below $0.26
❌ Bearish Bias: Short only after weekly close below $0.26
🧠 Neutral/Waiting: Let the market prove itself
#SANDUSDT #CryptoBreakout #AltcoinAnalysis #TechnicalAnalysis #MetaverseToken #SupportZone #BullishScenario #BearishOutlook #SmartMoneyAccumulation #CryptoTA #AccumulationPhase
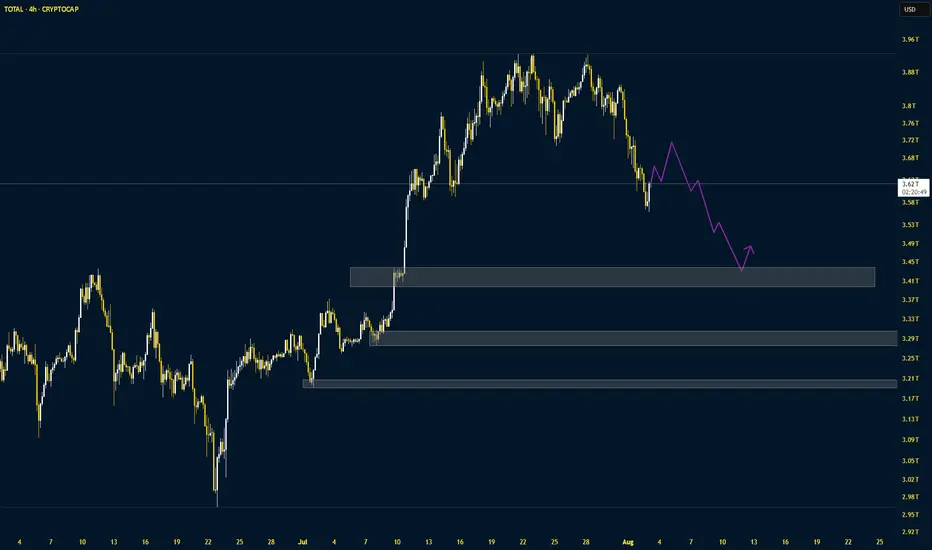
Crypto Total Market CapThe market is correcting at a very fast pace. The correction pattern could be 5-3-5. The following supports are important
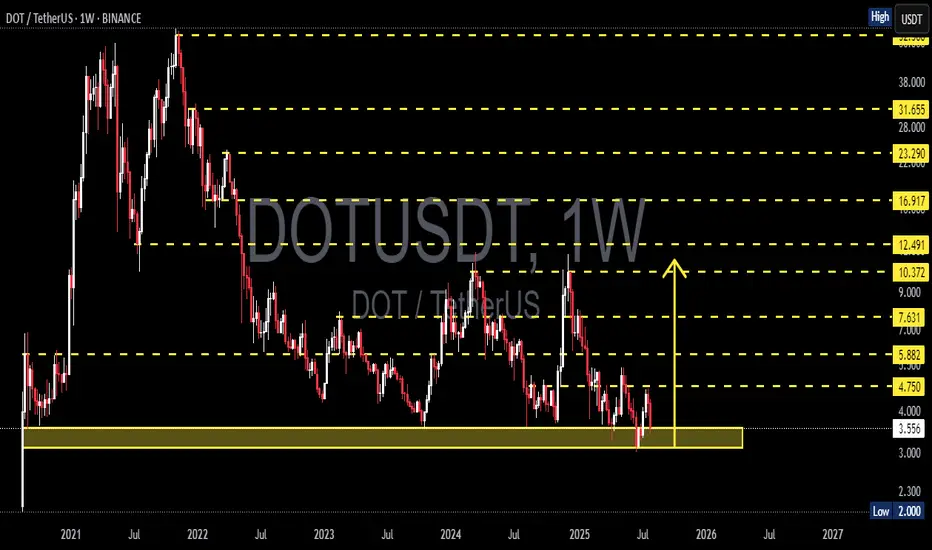
DOTUSDT On the Edge of a Major Rebound or a Devastating BreakdowPolkadot (DOT) is once again retesting one of its strongest macro support zones between $4.00 – $3.55, a historically significant demand area that has provided major price bounces since mid-2022.
This isn’t just a random level—it’s a critical accumulation base where large buyers have consistently shown interest. With price now hovering around this zone again, the next move could be decisive for DOT's mid- to long-term trend.
---
🔍 Price Structure & Key Patterns
Extended Accumulation Phase: DOT has been trading in a sideways range for over 80 weeks, indicating a potential bottoming structure forming after a prolonged downtrend.
Strong Historical Demand: The $4.00 – $3.55 region has acted as a key support multiple times since 2022, reinforcing its importance as a make-or-break zone.
Potential Trap Setup: Current price action could be forming either a bull trap or bear trap, depending on whether price rebounds or breaks down. Weekly candle confirmation will be key.
---
🟢 Bullish Scenario (Upside Reversal)
If price holds and prints a strong bullish candle (e.g., bullish engulfing or long-tailed hammer), expect the following upside targets:
Short-term: $4.75 – $5.88
Mid-term: $7.63 – $9.00
Long-term: $10.37 – $12.49, aligning with prior distribution zones
✅ A breakout from this long accumulation base could trigger a massive short squeeze and renewed buying momentum.
---
🔴 Bearish Scenario (Breakdown)
If DOT closes below $3.55 on the weekly chart:
Confirms breakdown from macro support
Opens downside risk toward $2.30 – $2.00
Would print a new lower low, extending the bear market phase and potentially triggering capitulation
⚠️ Speculative long positions should include tight risk management below $3.50.
---
🧠 Market Sentiment & Strategy
DOT appears to be in a "Capitulation meets Hope" phase—selling pressure is exhausting, but bullish conviction hasn't yet taken control.
Ideal entry zones lie within the current demand range, with tight stops.
Watch for a daily breakout or bullish momentum confirmation next week before committing to positions.
---
📌 Final Takeaway
> DOT is standing at the edge of a cliff—or a launchpad. The $3.55–$4.00 zone has repeatedly been the foundation for rebounds. If history repeats, this may be the beginning of a new uptrend. If not—brace for deeper downside.
⏳ The market is watching. Will DOT break out… or break down?
#DOTUSDT #Polkadot #CryptoTechnicalAnalysis #SupportResistance #CryptoRebound #BearishOrBullish #AltcoinOutlook #CryptoBreakdown #WeeklyChart #AccumulationZone #DOTAnalysis

INITUSDT at a Crossroads: Bounce or Break Break Down?📊 Comprehensive and Relevant Analysis
On the 12-hour timeframe, the INIT/USDT pair is currently retesting a crucial demand zone between $0.3500 – $0.3685. This zone previously acted as a strong support that triggered a sharp upward move in mid-July.
Now, price is sitting just above the lower edge of that demand box — a critical moment that could dictate the short- to mid-term trend.
---
🐂 Bullish Scenario (Potential Rebound):
Price has tested the $0.35 - $0.3685 zone multiple times and continues to reject further downside.
A micro higher low structure is forming inside the demand zone, indicating that buyers may be regaining control.
If a bounce occurs and price breaks above the minor resistance at $0.4045, the next upside targets are:
$0.4805 – previous consolidation area
$0.5843 to $0.6421 – historical high-volume zones
Confirmation will be stronger if a bullish engulfing, hammer, or volume spike candle forms at this level.
---
🐻 Bearish Scenario (Breakdown of Support):
If price closes convincingly below $0.35, the demand zone will be invalidated.
This could trigger a continuation of the downtrend toward:
$0.3000 – next psychological support
Possibly as low as $0.2650 – the major long-term support
A breakdown will confirm a new lower low structure, validating seller dominance and increasing bearish momentum.
---
📐 Visible Patterns and Structures:
Range Consolidation between $0.35 – $0.48: suggests either accumulation or distribution before a breakout.
Descending Channel on the mid-term structure: indicates a controlled bearish trend.
Potential Double Bottom: if the price bounces and reclaims $0.48, a reversal pattern may play out.
Support Zone Compression: repeated hits to the same support often lead to a break if buyers lose strength.
---
📌 Key Takeaway:
INIT is currently at a decision point. This level is known to precede large directional moves — either a strong bounce or a significant breakdown.
📉 A confirmed breakdown below the demand zone = a strong short setup.
📈 A bullish reaction with volume and reversal signals = a potential buy opportunity.
Traders should wait for confirmation from the next few candles and watch for reaction volume before committing to a position.
#INITUSDT #CryptoAnalysis #DemandZone #BreakoutOrBreakdown #AltcoinWatch #SupportAndResistance #VolumeAnalysis #TechnicalOutlook #PriceActionSetup #CryptoTrend
