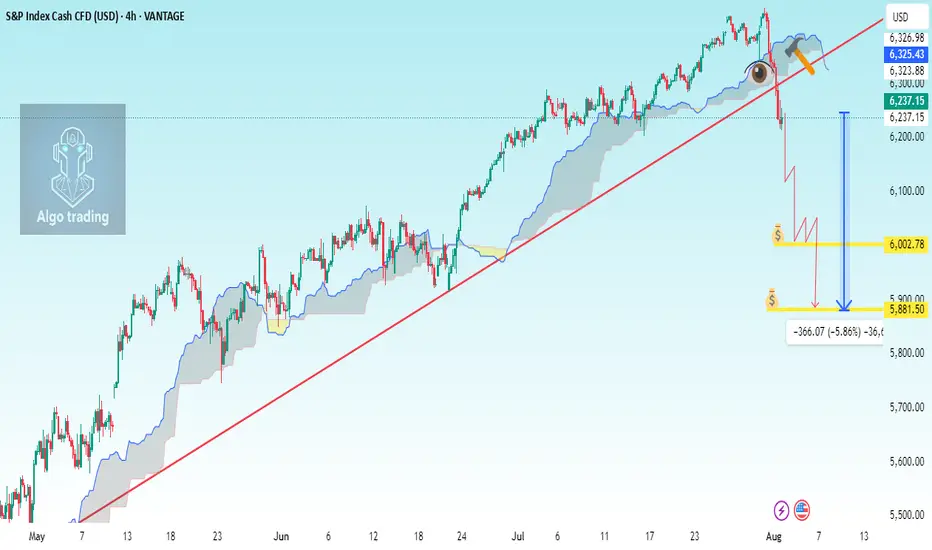
SP500 H4 analysis Breakdown TrendlineChart Components Observed:
Ichimoku Cloud: For trend and support/resistance visualization.
Uptrend line (manually drawn): Connecting higher lows since early May 2025.
Support break: Price has recently broken below the trendline and below the Ichimoku cloud.
Current Price: 6,237.15 (▼ -1.64%)
---
📉 Analysis Summary:
The trendline and Ichimoku cloud were acting as major dynamic support.
A bearish breakdown has occurred — price closed below the trendline and the cloud.
This suggests a potential trend reversal or correction underway.
---
🎯 Trade Setup Suggestion (Short Entry)
🟢 Entry Target (Short Position):
Sell Entry: Around 6,237 – 6,245 (current zone or slight pullback)
If price retests the underside of the broken trendline/cloud, that's a better entry confirmation.
📉 Take Profit Levels:
1. TP1: 6,130 (recent consolidation zone)
2. TP2: 6,000 (psychological + historical support)
3. TP3: 5,880 (next major support based on previous consolidation in early June)
🛡 Stop Loss:
SL: 6,300 – 6,310 (above the cloud and broken trendline for safe buffer)
---
📊 Risk Management:
Position size should be based on your account size, using 1–2% risk per trade.
Watch the S&P futures and macro news (e.g., U.S. data, Fed news) to avoid whipsaw.
Harmonic Patterns
Next week's gold price target is above $3,400.Next week's gold price target is above $3,400.
Continue buying on dips.
Any pullback in gold prices next week will be an optimal buying opportunity.
Gold Technical Analysis:
This week's non-farm payroll data demonstrated significant bullish momentum, directly driving gold prices soaring. The price increase has completely erased all of this week's losses, demonstrating exceptionally strong upward momentum.
The current trend shows a significant shift in the balance of power between bulls and bears in the gold market, completely reversing the previous bull-bear pattern.
Gold prices broke through the $3,300 mark and have surged strongly, climbing to $3,362 so far, with no signs of stopping.
Based on this strong performance, it's not impossible for gold prices to test the $3,370 level next week. Bullish forces are clearly dominant in the market.
It's worth noting that the rapid market rally was driven by these strong data.
If you didn't buy in on the initial rally or go long when the price broke through support, subsequent pullbacks may provide few entry opportunities.
Therefore, investors need to be more proactive when selecting entry points.
Specifically for next week's trading:
If the price falls back to 3340, we recommend continuing to buy and maintain a bullish outlook.
Upward resistance levels include 3375-3385.
Overall, the short-term gold strategy for next week recommends buying on dips.
Upward resistance levels are 3377-3382.
Downward support levels are 3345-3335.

might be going insanebasically ive been thinking way too much and i am trying to be in set and forget mode because i think this is what happens

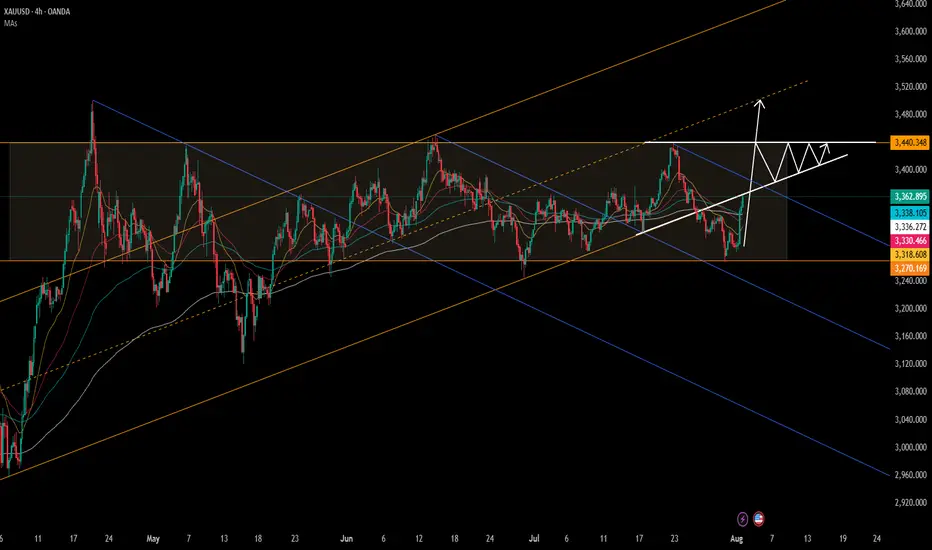
Go long on gold at low prices, targeting above 3400.Go long on gold at low prices, targeting above 3400.
Gold 4-Hour Chart:
As shown in the chart, from a macroeconomic perspective, despite the rise in gold prices, it remains trapped within a trend channel.
Currently, gold prices are under pressure in the 3370-3380 range.
On Friday, driven by risk aversion, gold prices briefly rose to $3363. With the Federal Reserve resuming its rate hikes over the weekend, expectations for a September rate hike have risen to 80%.
The most robust strategy for gold prices next week: enter long at low prices and manage your position accordingly.
Going long at current prices is not recommended. Instead, watch for potential declines due to profit-taking after the price dips.
Upward resistance lies near 3370 and 3380, where previous reversals occurred.
Every waterfall pattern offers a buying opportunity on the decline.
Although gold is currently strong, if we are bullish, we should not chase the gains. Simply wait patiently for prices to fall back to lower levels before going long.
Short-term intraday trend
Upside focus: Resistance at 3372-3385
Downside focus: Support at 3345-3340 and 3315-3320.
Gold Strategy:
1: Buy on the first dip into the 3338-3343 range, with a small stop-loss and a target price of 3370-3380.
2: Go long at low prices and control position size. This is definitely the most stable trading strategy. Patiently maintain a swing strategy. Target 3400+.
3: Continue to monitor resistance near 3440 next week. As shown in the chart, a converging triangle pattern may form.
TOTAL - Gonna Hold My Coins, Wait & See...This is my own experiment, gonna buy the most underrated top 30 coin, the most hated one. Put $5k on it right now and wait until this happens. Maybe this wont work but we will see!

Monthly Breakout.PPL Analysis
Closed at 181.78 (01-08-2025)
Monthly Breakout.
Extremely Bullish; potential to touch 240+
However, it should not break 128 now.
174 - 175 & then 165 - 167 seems to be a
Good Support level.

XAUUSD
XAUUSD Updated in H1 :
The gold signal is marked on the chart based on the latest price changes and the supply and demand in the market. These points include the entry point, stop loss, and take profit

BTC/USD has formed a symmetrical triangle pattern on the 1-hour Price has broken downwards from the consolidation zone, signaling potential bearish momentum. If selling pressure continues, the projected target aligns with the measured move from the pattern’s height, indicating a possible decline toward the next major support zone. Traders should monitor volume for confirmation and manage risk accordingly.


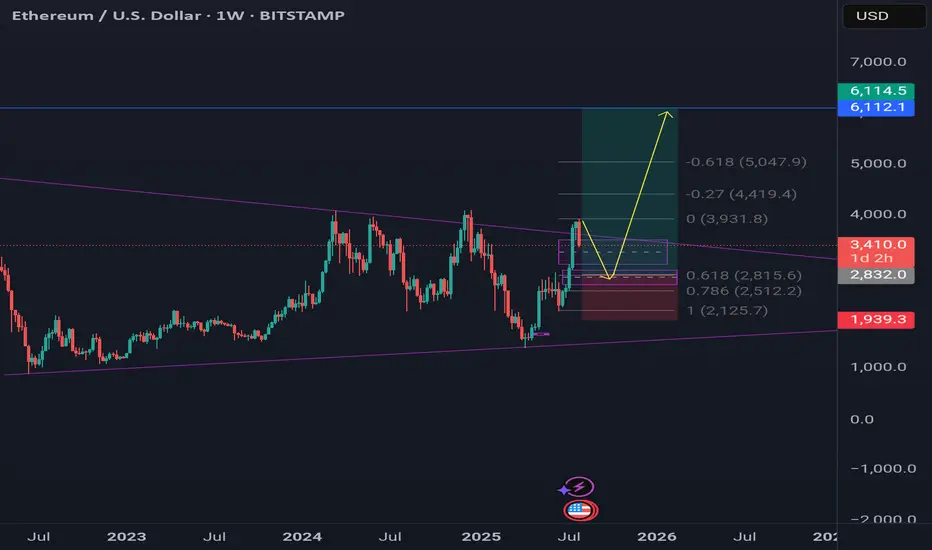
ETHER send it higher and higher and higher.Ether is not going anywhere without makin a new all time high.
Soon 6k ether and even 10k .
The sleeping giant is waking up and when it fully awakes ,it will obliterate everyone.
Beautiful Monthly Closing.SNGP Analysis
Closed at 123.46 (01-08-2025)
Beautiful Monthly Closing.
However, immediate Resistance is
around 130 - 131.
Crossing & Sustaining this level with
Good Volumes may result in upside
move targeting 145 - 150 & then around 190.
It should not Break 105, otherwise we may
witness further selling pressure.

Cypher patternI see a Cypher Pattern on this chart, which could correct to lower areas for now. Again, please trade with your own analysis, I am not responsible for your profits or losses.📉
Winter is coming!This idea reflects the beggining of the bear market phase. Just wait patiently around 400 days to start scooping again like a maniac. Dont listen to the Maxis, instead use a plan like this one to remove emotions and buy more sats with less capital.

ETHEREUM ETHUSDTTHE structure and strategy will never lie. Watch demand and supply roof .
from the top layers ,we have seen the 3touch supply roof sending Ethereum tanking again expect the retest of the broken supply from the bottom to provide buy opportunity
trading is 100% probability, please lower your expectations and know that any key level can fail.
#ethusdt #ethereum #bitcoin #btc #crypto

China50 LongChina50 showing bullish potential! 📈
Could rise from 13.46k toward its target,
supported by the Crab pattern. 🚀

BTC WARNINGEvery time BTC has broken its ATH, it has moved three fractals up, and then corrected. In addition, every time it has touched the blue line marked as a trend, it has corrected. It has already done all of this. And I dare say there will be a strong correction.

BTC Double BottomFibonacci sequence is a mathematical concept; it appears in various aspects of everyday life and nature. It's not directly used in a calculated way, but its principles are reflected in the patterns we see around us. Its key for traders to pinpoint these reversal areas to keep a positive risk/reward ratio. Bulls will target 116k if this low can be sustained.

BTC SHORT SETUP INTRADAY ( 02 AUG 2025 )If you have doubt on our trades you can test in demo.
Details:
Entry: 113,680 $ - 113,450 $
Target Price: 112,300 $
Stop loss: 114,370 $
Trade Ideas:
Idea is clearly shown on chart + we have some secret psychologies and tools behind this.
What is required to Join VIP?
- Nothing just you have to share 10% of your profit with us at the end of the month which you earned from our signals. Yeah this is just the requirement, trade where ever you like your favorite broker or else you don't need to pay fees first or create account thru our link.
Trade Signal:
I provide trade signals here so follow my account and you can check my previous analysis regarding BITCOIN. So don't miss trade opportunity so follow must.
BINANCE:BTCUSDT BINANCE:BTCUSDT.P BINANCE:BTCUSD

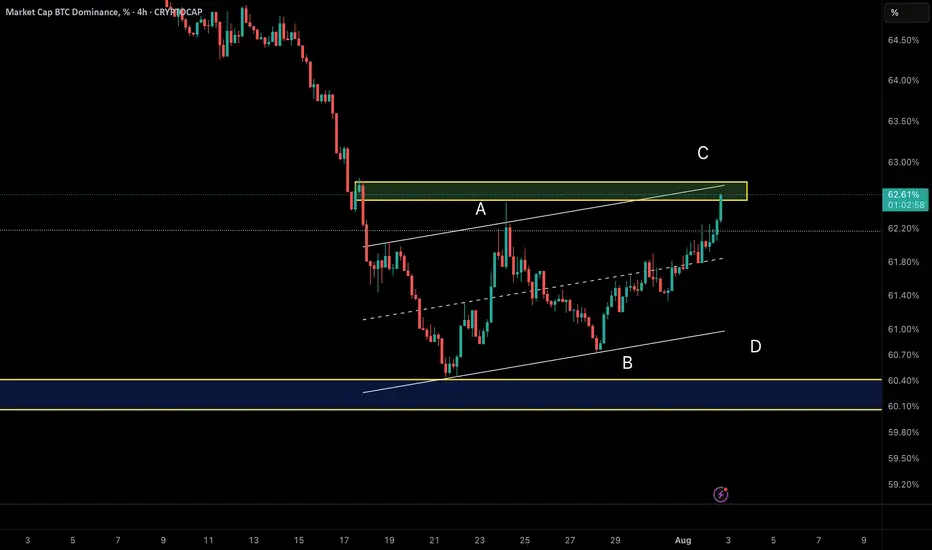
Smart Money Watching BTC Dominance – Rotation to Alts IncomingAfter a deep correction, BTC Dominance has entered a corrective upward phase inside an ascending channel.
Wave A rallied from 60.5% to 62.3%, followed by Wave B retracing to 60.74%.
Currently, Wave C is developing and has reached around 62.2%.
The key resistance sits near 62.7%, exactly at the upper trendline of the channel. This could act as a reversal point, potentially ending Wave C and triggering a bearish move.
💡 Implication:
If dominance drops from this zone, we could see capital rotation into altcoins, supporting a bounce across the broader altcoin market.
total 3 crypro cap without eth , bearish
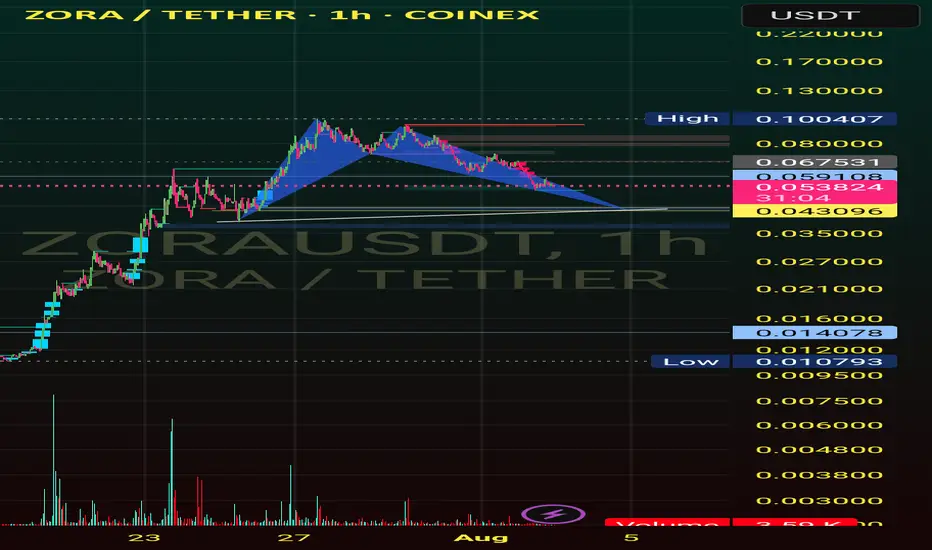
Bearish harmonic patterns are advanced technical analysis tools used by traders to identify potential trend reversals to the downside. They are based on the principle that market movements often follow specific geometric and Fibonacci ratio relationships. When a price chart forms one of these patterns, it suggests that the current uptrend is losing momentum and a downward move is likely.
Here are three of the most well-known bearish harmonic patterns:
1. The Bearish Gartley Pattern
The Gartley is one of the oldest and most reliable harmonic patterns. It is a reversal pattern that looks like an "M" shape and forms after an uptrend.
Structure: The pattern is a five-point formation labeled X, A, B, C, and D.
Fibonacci Ratios: It is defined by these specific ratios:

The outlook for EUR/USD in the upcoming weekIn the past week, EUR was in a downtrend on the lower cycles, while showing a corrective move on the higher ones.
Following Friday’s news, we saw a strong bullish candle. Unfortunately, the market closed shortly after, so we couldn't confirm whether it was the beginning of a solid trend or just a reaction to the news.
As a result, in the coming week, we need to be more cautious and patient when looking for setups. Since the recent candles were news-driven, it's important to wait for a clear confirmation before acting.
In the chart, three possible scenarios have been outlined — be prepared for any of them.

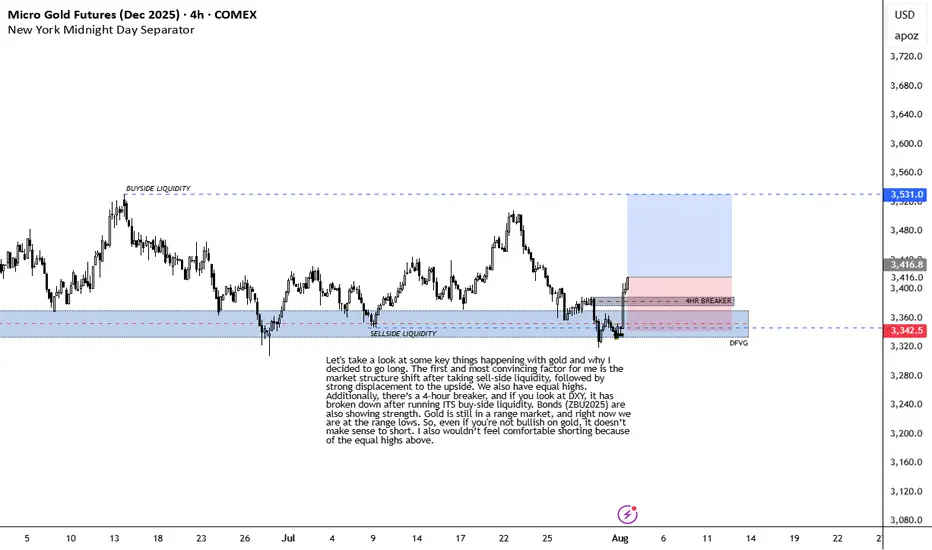
BULLISH ON GOLDLet's take a look at some key things happening with gold and why I decided to go long. The first and most convincing factor for me is the market structure shift after taking sell-side liquidity, followed by strong displacement to the upside. We also have equal highs. Additionally, there’s a 4-hour breaker, and if you look at DXY, it has broken down after running ITS buy-side liquidity. Bonds (ZBU2025) are also showing strength. Gold is still in a range market, and right now we are at the range lows. So, even if you're not bullish on gold, it doesn’t make sense to short. I also wouldn’t feel comfortable shorting because of the equal highs above.
INVALIDATION IS RECENT 4HR LOW.
USDT + USDC Dominance🦇 Bearish Bat Pattern Forming :
A potential Bearish Bat is developing, with price nearing the final zone where reversals typically occur — the Potential Reversal Zone (PRZ).
What to watch:
🔻 If the pattern completes and gets rejected in the PRZ:
That could signal a shift away from stables and back into riskier assets — a bullish sign for altcoins and the broader crypto market.
🔼 If price breaks through the PRZ:
The pattern fails. That would point to continued risk-off behavior — more capital flowing into stables and away from alts.
🧠 Pattern isn't confirmed yet — the key move is still ahead. Watch price closely as it enters the PRZ. The reaction there will shape the next major trend.
