LIVE TRADEHello friends🙌
Given the good trend we had, now that we have had a price correction, we can enter the trade with risk and capital management and move towards the specified goals.
🔥Follow us for more signals🔥
*Trade safely with us*
Harmonic Patterns
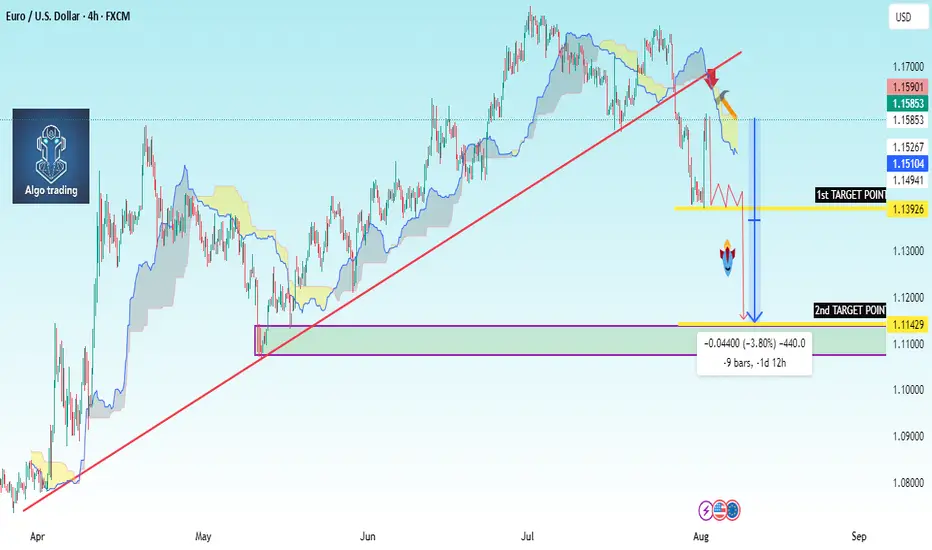
EUR/USD Chart Summary (Bearish Setup):Trendline Break: A long-term bullish trendline has been broken.
Price below Ichimoku Cloud: Indicates bearish momentum.
Bearish Retest: Price pulled back to retest the broken trendline and is now forming a bearish continuation pattern.
Double Target Zones Identified:
1st Target Point: ~1.1329
2nd Target Point: ~1.1144
---
🟠 Suggested Trade Setup:
🔹 Entry (Sell):
Around 1.1585 (where price is hovering now; or on a small pullback).
🔻 Take Profit (TP):
🎯 TP1: 1.1329 (short-term target)
🎯 TP2: 1.1144 (main target if bearish momentum continues)
🛑 Stop Loss (SL):
Place above the recent swing high or cloud resistance — around 1.1670
---
📊 Risk-Reward:
TP1 = ~250 pips
TP2 = ~440 pips
SL = ~85 pips
This gives you a favorable risk-reward (1:3+ to TP
Apple Short Trade ideaAfter the positive earning brought enough buyside liquidity to be taken i have executed this short trade idea on Friday with almost 3 RR #Apple #short #smc #smartmoney #liquidity #trader #ict #liquiditygrab

Could this be the end of Bitcoin’s trend?The Current State of Bitcoin’s Trend: Has the Uptrend Come to an End...?
Based on recent analyses, Bitcoin has exited its 4-hour channel over the past few days, and there is still a possibility for further correction. However, this does not mean that the uptrend for Bitcoin is over.
My targets for Bitcoin remain the same as before: 123,700 and 129,710. It’s even possible that we might see a wick above these prices.
For those with more capital who are looking to buy Bitcoin, there are two good entry levels:
110,880
109,770
Everything else is clearly shown on the chart. Please be cautious, as there will likely be high volatility once the market opens.
Be sure to open the analysis link and boost the analysis with your likes.

Potential Sell Opportunity on EURGBPReasons I think this pair will fall.
- RSI was overbought on 4H
- Bearish RSI Divergence on 4H
- Lower high potentially being printed on 4H
Looking to sell on the retest once price breaks though previously printed low.
What do you think?

ETHUSDTDISTRIBUTION +ACCUMULITON= RE ACCUMULITON
Accumulation begins and reaccumulation is being completed and the Wyckoff structure is completed
Composite Academy and Analysis
Professor Ramtia Siddiqui
Aram Pizbin Professor
BINANCE:ETHUSDT

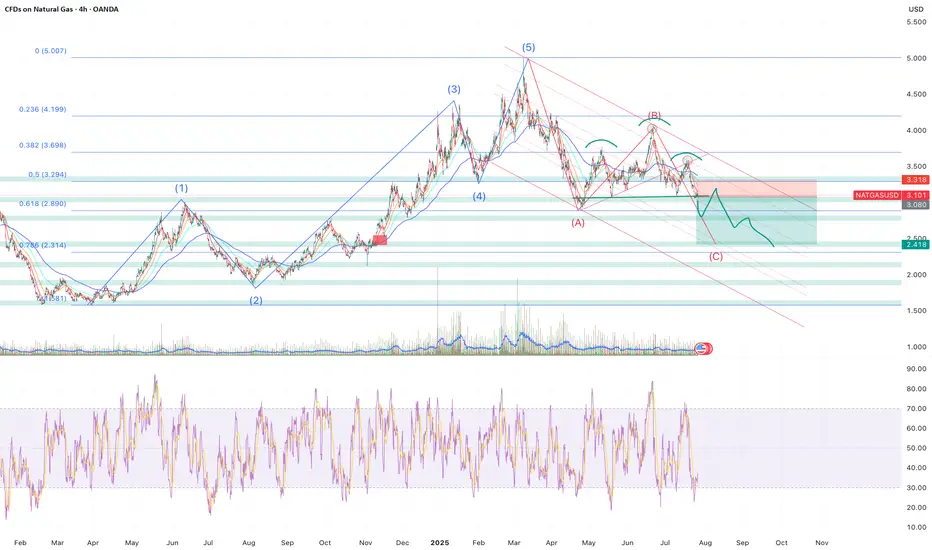
Sell NATGAS into OCT/NOVNatalie has fromed a H&S and has broke through all of the supporting EMAs leading to most of the indicators turning bearish.
My approach for the forseeable is seeling bounces until the winter season approaches.
Of course Natalie is extremely susceptible to trend changes due to economical data and has to be monitored closely. Currenlty I'm a bear.
Only selling once it breaks and retests, where I will once again reasses based on economics such as storage, production, imports and demand.
Target around $2.5 where interestingly a gap (red rectangle) sits from Nov - 24.
Elliot Wave (although not a great fan) kind of aligns as well as the 0.786 fib level which began forming at the beginning of 2024.
Storage | Volatility | Price Outlook
U.S. natural gas markets are stabilizing as volatility trends back toward seasonal norms.
📉 Volatility has dropped from 81% in Q4 2024 to 69% in mid-2025
🏪 Storage is currently at 3,075 Bcf,
🔻 4.7% lower YoY
🔺 5.9% higher than the 5-year average
🚢 LNG exports remain strong—up 22% YoY and 74% above the 5-year average
🔌 Domestic demand is seasonally weaker but steady
➡️ Despite being below last year’s levels, storage surplus vs. the 5-year average acts as a soft ceiling on price.
➡️ Historical analogs suggest a fair value range between $2.50–$3.20/MMBtu in the short term.
📊 Current price action around $3.00–$3.40 looks slightly overheated unless a fresh catalyst emerges (heatwave, export spike, etc.).
🧭 Watching for:
Injection trends over the next few weeks
Cooling demand in power sector
Resistance around $3.40
Support near $2.80
#MAGIC/USDT Falling Wedge + Fib Confluence #MAGIC
The price is moving within a descending channel on the 1-hour frame, adhering well to it, and is on its way to breaking strongly upwards and retesting it.
We have support from the lower boundary of the descending channel at 0.1620.
We have a downtrend on the RSI indicator that is about to be broken and retested, supporting the upside.
There is a major support area in green at 0.1662, which represents a strong basis for the upside.
Don't forget a simple thing: ease and capital.
When you reach the first target, save some money and then change your stop-loss order to an entry order.
For inquiries, please leave a comment.
We have a trend to hold above the 100 Moving Average.
Entry price: 0.1780.
First target: 0.1827.
Second target: 0.1905.
Third target: 0.1962.
Don't forget a simple thing: ease and capital.
When you reach your first target, save some money and then change your stop-loss order to an entry order.
For inquiries, please leave a comment.
Thank you.

#MAGIC/USDT#MAGIC
The price is moving within a descending channel on the 1-hour frame, adhering well to it, and is on its way to breaking strongly upwards and retesting it.
We have support from the lower boundary of the descending channel, at 0.1474.
We have a downtrend on the RSI indicator that is about to break and retest, supporting the upside.
There is a major support area in green at 0.1700, which represents a strong basis for the upside.
Don't forget a simple thing: ease and capital.
When you reach the first target, save some money and then change your stop-loss order to an entry order.
For inquiries, please leave a comment.
We have a trend to hold above the 100 Moving Average.
Entry price: 0.1800.
First target: 0.1837.
Second target: 0.1900.
Third target: 0.1958.
Don't forget a simple thing: ease and capital.
When you reach your first target, save some money and then change your stop-loss order to an entry order.
For inquiries, please leave a comment.
Thank you.

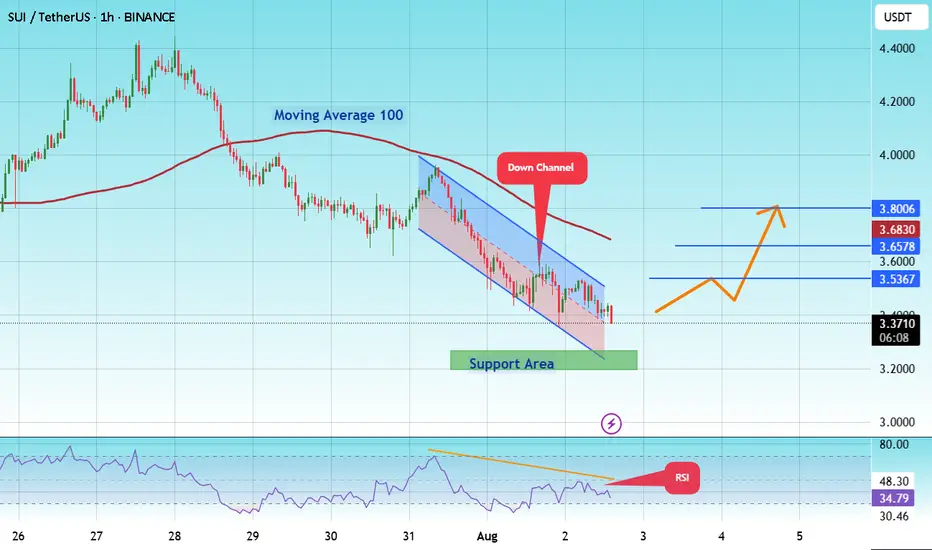
#SUI/USDT Update – Bounce Setup from Demand Zone?#SUI
The price is moving within a descending channel on the 1-hour frame and is expected to break and continue upward.
We have a trend to stabilize above the 100 moving average once again.
We have a downtrend on the RSI indicator that supports the upward break.
We have a support area at the lower boundary of the channel at 3.27, acting as strong support from which the price can rebound.
We have a major support area in green that pushed the price higher at 3.20.
Entry price: 3.38
First target: 3.58
Second target: 3.65
Third target: 3.80
To manage risk, don't forget stop loss and capital management.
When you reach the first target, save some profits and then change the stop order to an entry order.
For inquiries, please comment.
Thank you.
PUMPIMHO once we cross the level above EMA 200 there is launching area to this two zones. Be accurate this thing very active. NFA - DYOR

GBPUSD is in Bearish Reversal Head & ShoulderGBPUSD is showing clear bearish head & shoulder pattern on daily chart it will retrace for some time to get close to the price 1.33788 at that point short sell will be good

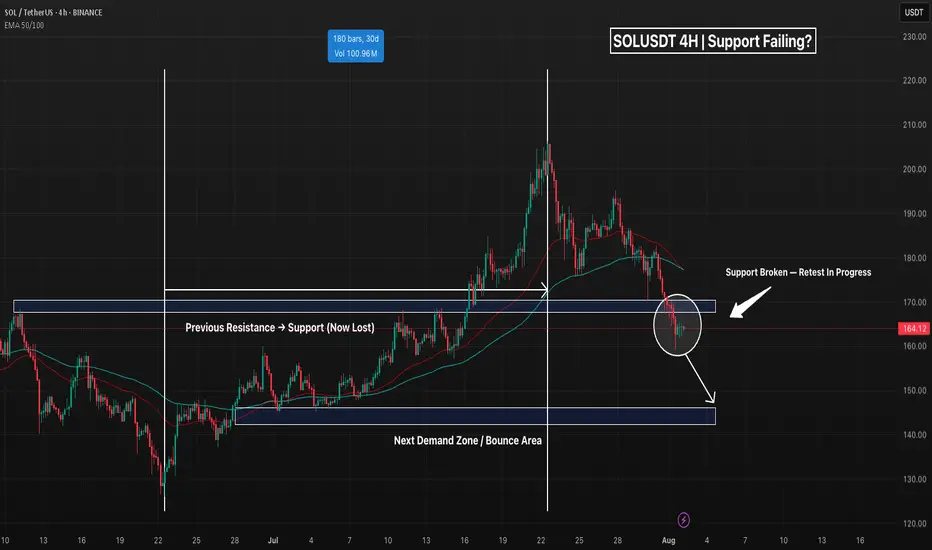
SOL - Support Broke, Is This Just a Retest Before The Pump?Solana just lost a key structural level on the 4H chart — the former range high (~163–166), which had acted as resistance throughout June and flipped to support in mid-July. Price is now sitting just below this zone, forming a weak retest without any real bullish momentum.
This setup often leads to trap scenarios: either a fast reclaim (bullish deviation) or a clean continuation to the next demand. So far, the price is holding below the EMAs and failing to reclaim lost ground — not a bullish look.
📌 Confluence for Further Downside:
Break and close below prior support
EMA 50/100 acting as dynamic resistance
No bullish divergence present (if RSI confirms)
Weak volume on current bounce attempt
If sellers stay in control, eyes are on the next demand zone around 144–146, which supported the last major breakout. Conversely, a clean reclaim above 166 and back inside the range would flip bias neutral-to-bullish.
Bias: Bearish unless 166 is reclaimed
Invalidation: Break above 177–180 (EMA cluster)
Next Key Support: 144–146
Potential Setup: Short on failed retest / Long on demand reaction
Do you see this as a breakdown or a trap? Let me know 👇
Gold Surges on Non-Farm Data; 3330 Key Next WeekGold was strongly boosted by the significantly bullish non-farm payroll data, surging sharply like a rocket 🚀, with gains that completely "wiped out" all the weekly losses. The current gold trend, as if injected with super momentum, has completely broken the previous long-short stalemate. Starting from the 3300 level, it has been breaking through obstacles all the way up to 3350. At present, 3330 is like a critical "battleground" ⚔️ fiercely contested by both long and short sides.
This week, when gold was still "lingering" below 3300, I emphasized repeatedly that a rebound was inevitable – we just needed to stay calm and wait for the opportunity. As it turns out, our judgment was spot on, and we successfully took profits around 3340, reaping good gains 💴. Now, gold prices are oscillating back and forth in the 3340-3350 range. Based on a comprehensive analysis of the current trend, I boldly predict that gold is likely to pull back to around 3330 next week, so everyone can prepare in advance 🤗
⚡️⚡️⚡️ XAUUSD ⚡️⚡️⚡️
🚀 Sell@ 3350
🚀 TP 3330 - 3320 - 3310
🚀 Buy@ 3300 -3310
🚀 TP 3320 - 3330 - 3340
Daily updates bring you precise trading signals 📊 When you hit a snag in trading, these signals stand as your trustworthy compass 🧭 Don’t hesitate to take a look—sincerely hoping they’ll be a huge help to you 🌟 👇

JUVUSDT Forming Bullish MomentumJUVUSDT is showing signs of a strong recovery from its recent consolidation phase, with a clear bullish momentum starting to emerge. The price action has bounced confidently from a well-defined support zone, highlighted in the chart, and buyers have stepped in aggressively. This indicates strong market interest and could be the early stage of a new upward trend. The expected upside potential ranges from 30% to 40%+, supported by increasing volume and favorable sentiment.
The token is now trading just above a key breakout zone, which has historically acted as resistance but is now turning into strong support. This shift in market structure is often a signal of a bullish reversal. Given the recent breakout attempt and minor pullback for retesting, the chart suggests JUVUSDT may be gearing up for a significant push toward the next resistance level. Technical indicators such as RSI and MACD also hint at further bullish continuation if current levels hold.
Investor interest in JUV is steadily growing, with fundamentals and market sentiment aligning to support a short-to-mid-term rally. The project’s presence in the fan token sector, along with improving volume trends on major exchanges like Binance, reflects increasing confidence among traders and crypto investors.
Traders keeping a close eye on potential breakout setups should not overlook JUVUSDT. The current technical setup offers a promising opportunity with a favorable risk-reward ratio, especially if the bullish momentum accelerates from here.
✅ Show your support by hitting the like button and
✅ Leaving a comment below! (What is You opinion about this Coin)
Your feedback and engagement keep me inspired to share more insightful market analysis with you!

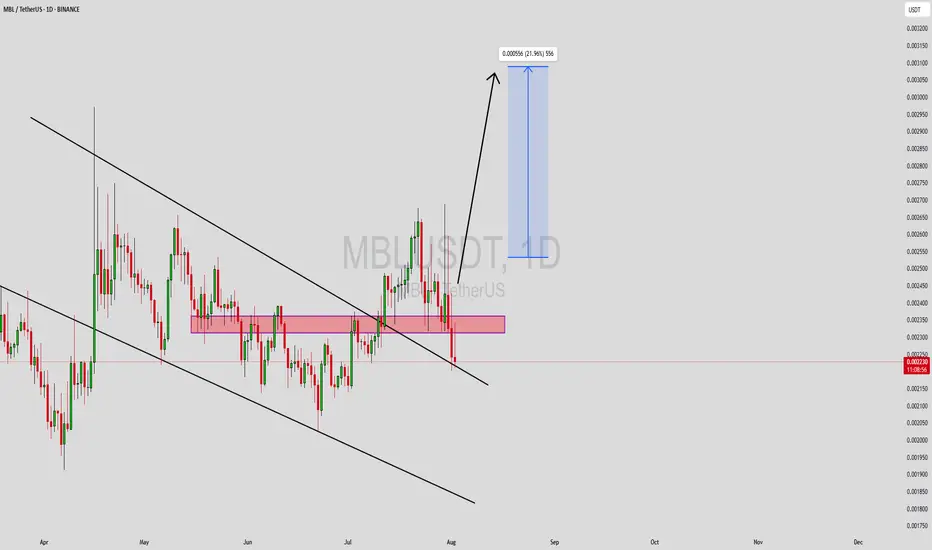
MBLUSDT Forming Bullish ReversalMBLUSDT is currently exhibiting signs of a bullish reversal pattern, indicating a potential trend shift in favor of the bulls. After an extended downtrend, the price appears to have found strong support, which is now serving as a base for upward momentum. This structure is often seen before a breakout rally, especially when paired with a steady increase in trading volume—suggesting accumulation by informed investors.
The recent price action confirms growing investor confidence in the MBL project. With volume picking up and a bullish reversal structure forming on the chart, traders are beginning to position for an anticipated move to the upside. Technical indicators support this sentiment, aligning with a potential gain of 20% to 30%+ in the short term if the current momentum is sustained.
As broader market sentiment continues to recover, MBLUSDT stands out with a clean technical pattern that offers a favorable risk-to-reward ratio. The combination of healthy volume, a well-defined support zone, and early signs of bullish continuation make this setup appealing to both swing traders and mid-term holders watching for breakout confirmation.
MBL’s fundamentals are also garnering interest, adding to the technical strength seen on the chart. If buyers continue stepping in near support levels, the breakout target could be reached faster than expected.
✅ Show your support by hitting the like button and
✅ Leaving a comment below! (What is You opinion about this Coin)
Your feedback and engagement keep me inspired to share more insightful market analysis with you!
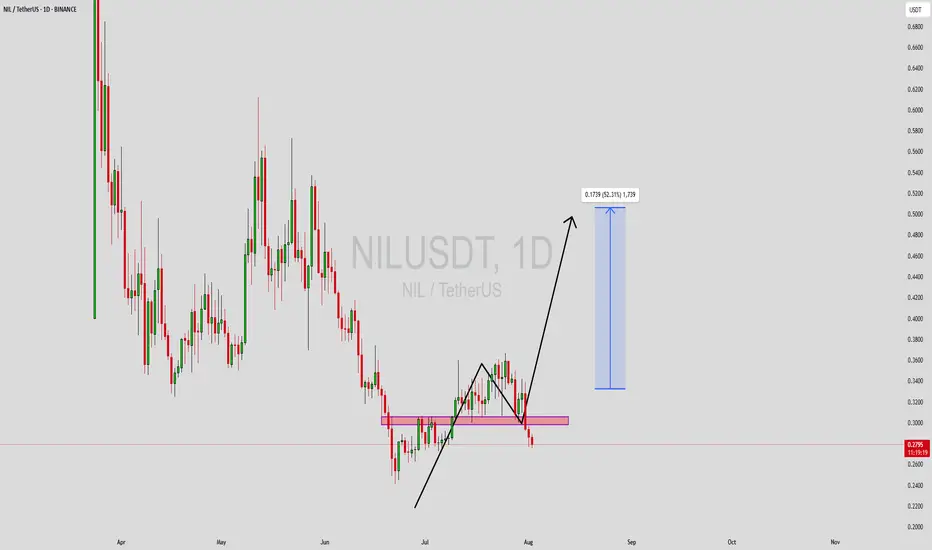
NILUSDT Forming Potential BullishNILUSDT is currently forming an interesting technical setup on the daily chart, hinting at a potential bullish move in the near term. The price structure recently broke out from a consolidation phase and tested the previous support-turned-resistance zone, which is now acting as a key demand area. The market has shown some short-term correction but is likely preparing for a bounce from this level, targeting a potential gain of 40% to 50%.
The projected move is supported by a healthy uptick in volume, suggesting accumulation and growing investor interest. With price action forming a potential higher low near the support zone, this area could become a strong launchpad for the next leg up. The market sentiment for NILUSDT seems to be shifting toward the bullish side, which aligns with the setup shown on the chart.
Technically, if buyers regain control and push the price above the recent local high, we may see rapid movement toward the target zone marked around a 52% gain from current levels. This makes NILUSDT a favorable candidate for short to mid-term traders looking to capitalize on breakout continuation setups.
Overall, NILUSDT appears to be at a crucial technical junction. The current zone could offer a good risk-to-reward entry opportunity for trend-following traders watching for bullish confirmations.
✅ Show your support by hitting the like button and
✅ Leaving a comment below! (What is You opinion about this Coin)
Your feedback and engagement keep me inspired to share more insightful market analysis with you!
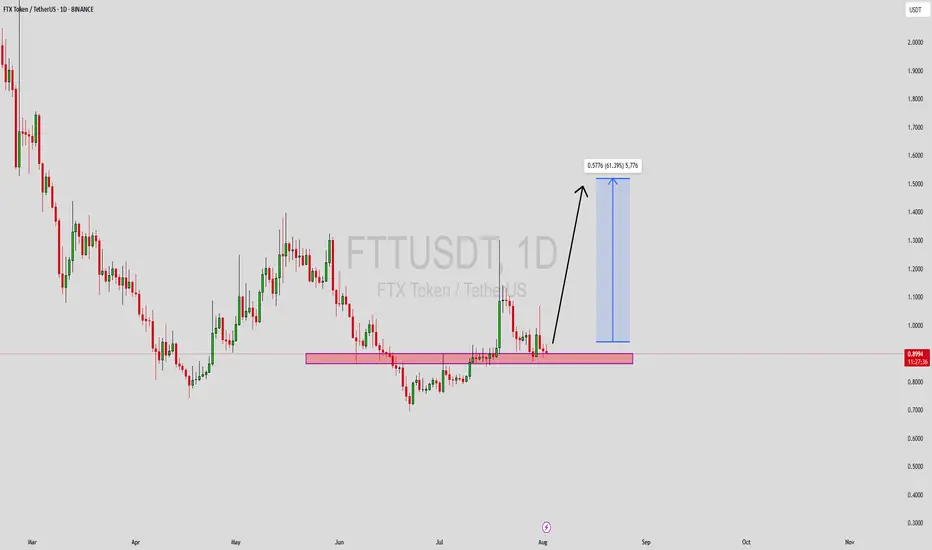
FTTUSDT Forming Bullish MomentumFTTUSDT is showing renewed strength with a clean breakout setup, supported by good volume and strong technical structure. The current chart reveals a clear horizontal support zone that has been tested multiple times and held firmly, indicating buyers are stepping in with confidence. After the recent consolidation, the price appears ready to move higher, potentially offering a 40% to 50% upside in the near term. This setup attracts attention from technical traders looking for confirmation through volume spikes and bullish candlestick formations.
What makes this chart setup even more compelling is the emerging bullish momentum following the reclaim of a key support area. The market has seen a steady accumulation phase, and the subsequent price action shows strength above the highlighted zone, suggesting a possible retest and continuation to the upside. With investor sentiment improving around FTX Token (FTT) and increasing market activity, the possibility of a significant rally becomes more likely, especially if price closes firmly above recent resistance levels.
Investors are taking interest in this project again despite past uncertainties, as the price action begins to signal recovery potential. The projected target from this setup points toward a measured move that aligns well with a 40%+ gain, assuming the broader market remains favorable. It's a promising opportunity for mid-term traders watching for bullish continuations backed by strong volume and sentiment.
If this breakout sustains, FTTUSDT could regain traction as a high-risk, high-reward play. Watching how the price behaves around the current support and near-term resistance will be critical for short-term traders aiming to capitalize on this potential upside.
✅ Show your support by hitting the like button and
✅ Leaving a comment below! (What is You opinion about this Coin)
Your feedback and engagement keep me inspired to share more insightful market analysis with you!
AUDUSD: Bearish Continuation from broken supportThe current setup is a clean example of a trend continuation play. Price recently broke decisively below a structure zone, this break and retest now flips the narrative, what once was a buy zone is now an opportunity for short entries.
Following the aggressive move down, price now began pulling back into that broken zone. The move appears corrective rather than impulsive, characterized by a slower, more rounded structure typical of pullback leg. This is classic behavior in continuation setups: fast drop, slow retrace, and then potential for the next leg lower.
The projected move targets a retest of the swing low at 0.63800. That level is significant, it's a level where prior demand reacted strongly and now it serves as the next probable magnet for price.
What makes this continuation trade high probability is the sharpness of the prior bearish impulse as it signals intent. The market seems to be in a controlled bearish sequence, where sellers dominate momentum and retracements offer fresh entries for trend followers.
The structure and zone alignment all point in the same direction continuation lower, not reversal.
Let me know in the comments what you think
Disclosure: I am part of Trade Nation's Influencer program and receive a monthly fee for using their TradingView charts in my analysis.

MDTUSDT Forming Bullish WaveMDTUSDT is currently forming a bullish wave pattern, indicating a strong potential for continued upward momentum. This wave structure reflects healthy market cycles, with higher highs and higher lows suggesting that bulls are steadily gaining control. As this wave pattern matures, the current market setup hints at a possible breakout, which could push prices significantly higher in the near term.
The volume backing MDTUSDT is robust, which provides a solid confirmation for the ongoing trend. Good volume during the accumulation and breakout phases is essential for sustaining a bullish wave. If the pair maintains its current buying pressure, traders could expect a strong rally, with a projected gain between 90% to 100% based on historical wave completions and resistance breakouts.
Investors and traders have started showing increasing interest in MDT, further validating its bullish potential. This growing attention not only boosts market confidence but also contributes to stronger liquidity, which is critical for smooth and sustained upward movement. Technical traders watching for confirmation of the next wave will likely key in on breakout zones and RSI/volume confluences.
In summary, MDTUSDT is showing signs of entering a powerful bullish continuation phase, supported by strong volume and increasing market interest. As the wave structure plays out, this pair could offer an excellent opportunity for swing traders aiming for mid-to-high double-digit returns.
✅ Show your support by hitting the like button and
✅ Leaving a comment below! (What is You opinion about this Coin)
Your feedback and engagement keep me inspired to share more insightful market analysis with you!

OP Long Position Hi traders,
Turning our attention to OceanPal Inc. (OP), we can observe an Inverted Head and Shoulders pattern forming over the past few weeks, signaling a potential bullish reversal.
OceanPal Inc. is a maritime transportation company, specializing in the transportation of dry bulk cargoes worldwide. The company operates a modern fleet
and has a strong presence in the global shipping industry. Despite recent market fluctuations, OceanPal's operational efficiency and strategic positioning suggest robust fundamentals.
The Inverted Head and Shoulders pattern is characterized by three troughs, with the middle trough being the lowest, and the two outer troughs being higher and approximately equal in depth. This pattern often indicates a reversal from a downtrend to an uptrend.
As the stock approaches the neckline of this pattern, a breakout above this level could confirm the bullish reversal. Traders should consider entering a long position
upon confirmation of a break above the neckline, anticipating further upward movement in the stock.
Take Profit: 3.82
Final Target: 4.31

QKCUSDT Forming Bullish PennantQKCUSDT is exhibiting a bullish pennant pattern, a highly regarded continuation formation that signals the potential for another significant upward move following its previous bullish momentum. This pattern typically reflects a brief consolidation period where price action narrows before a breakout occurs in the direction of the prior trend. The tightening range seen in QKC is a positive sign that buyers are holding ground and preparing for the next wave upward.
The trading volume on QKCUSDT has remained consistently healthy, which is a critical component in validating bullish patterns. A breakout above the pennant resistance with a surge in volume could act as the catalyst for a rapid price acceleration. The projected gain of 30% to 40% is aligned with typical outcomes from this pattern, particularly in bullish crypto market conditions.
Market sentiment around QKC is beginning to heat up, with more retail and technical traders identifying its potential. The increasing interest from investors signals rising confidence in the project, supported by improved liquidity and stronger community backing. This adds fundamental strength to the technical setup, further supporting the bullish outlook.
With favorable market structure, good volume, and growing investor attention, QKCUSDT appears to be on the verge of a breakout. Traders watching this setup should keep a close eye on key resistance levels and volume spikes, as these will likely dictate the timing and strength of the next move.
✅ Show your support by hitting the like button and
✅ Leaving a comment below! (What is You opinion about this Coin)
Your feedback and engagement keep me inspired to share more insightful market analysis with you!

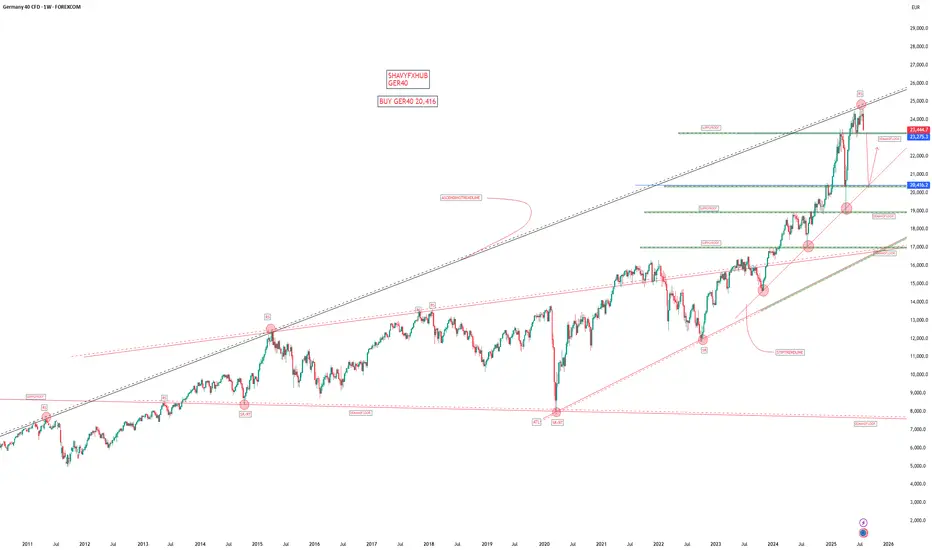
GER4O1. Head of the European Central Bank (ECB)
As of August 2025, Christine Lagarde is the President (head) of the European Central Bank (ECB). She is responsible for leading eurozone monetary policy, representing the ECB at global forums, and setting the tone for financial and economic policy across Europe.
2. Fundamental Drivers of the GER40 (DAX 40)
The GER40, also known as the DAX 40, is Germany's blue-chip stock market index. Its performance is driven by the following key fundamentals in 2025:
Corporate Earnings & Sector Leaders: Major companies like SAP, Siemens, Allianz, and Linde have been driving index gains, contributing a significant portion of the upward momentum due to their market capitalization.
ECB Monetary Policy: Multiple rate cuts by the ECB in 2025 supported German and eurozone equities, lowering yields and easing financing for businesses. Expectations of further rate cuts or stability are closely monitored by the market.
Inflation Dynamics: Falling inflation across the eurozone in 2025 enabled the ECB to move from a restrictive to a more accommodative stance. Latest ECB projections see inflation averaging 2% in 2025 and slightly below target in 2026, allowing monetary loosening to persist.
Energy Prices: Declining natural gas and oil prices provided relief to Germany’s energy-intensive industries, aiding profitability and supporting DAX-listed industrials.
Government Policy & Fiscal Stimulus: Increased defense and infrastructure spending by the new German government under Chancellor Friedrich Merz has boosted selective sectors, including defense (e.g., Rheinmetall).
Global and Domestic Economic Conditions: While the eurozone and German economies have shown resilience with modest GDP growth (ECB forecast: 0.9% growth for 2025), there are headwinds from trade tensions, consumer demand, and sectoral shifts (notably auto and chemicals).
Trade Policy/Geopolitics: Ongoing global trade tensions, new tariffs, and geopolitical uncertainty remain sources of risk and volatility for the index. ECB President Lagarde has repeatedly warned that “trade tariffs are a negative demand shock” and could weigh on German growth prospects.
3. Current Outlook for GER40 (August 2025)
The index gained nearly 22% so far in 2025, surpassing 24,000 and even pushing toward record highs around 24,650. AI-based and institutional forecasters project continued bullish momentum, with most calling for stability or gradual increases but noting the potential for a market correction after strong gains.
Rate cuts, lower energy prices, and corporate strength are the main drivers for the recent rally, while persistent trade risks and sectoral weaknesses remain key downside risks.
Despite economic fragility, especially in manufacturing and energy costs, the DAX/GER40 remains resilient thanks to monetary policy support and selective corporate strength.
4. Recent ECB Actions & Commentary
At the July 2025 meeting, Lagarde and the ECB Governing Council kept rates steady after several cuts earlier in the year, citing moderate growth and disinflation as justification for their stance. The ECB remains “cautiously upbeat,” expecting a 2% average inflation rate and slow but positive economic growth.
The ECB noted that further escalation of trade tensions or unexpected inflation swings could prompt new policy responses.
Summary:
The GER40 is currently driven by accommodative ECB policy under Christine Lagarde, robust earnings from key blue-chip companies, lower energy prices, and government fiscal stimulus. Risks include trade uncertainty, sector-specific downturns, and any reversal in global economic momentum. The ECB’s current president, Christine Lagarde, continues to play a central role in shaping the environment for German and eurozone equities.
WATCH MY DEMAND FLOOR