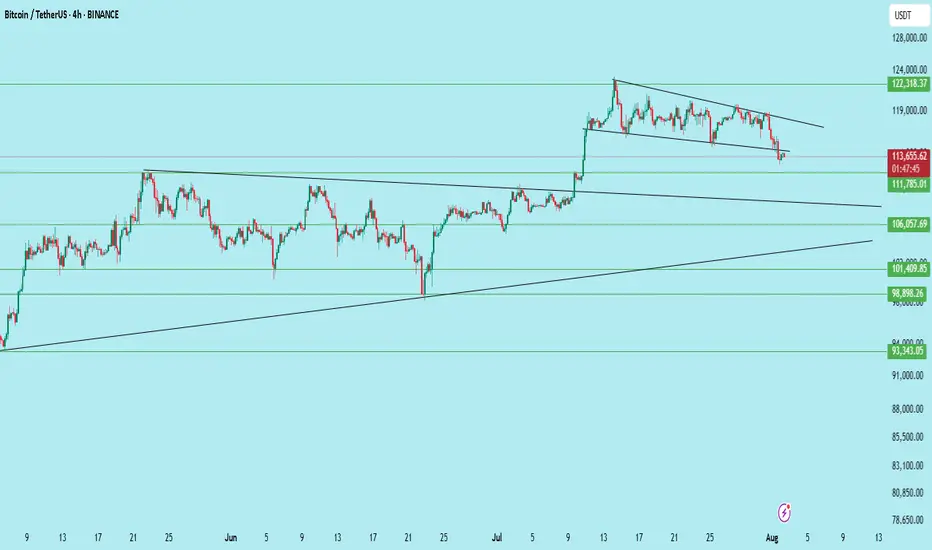
$BTC /USDT – Breakdown from Channel, Bears Gaining ControlBitcoin has broken down from its descending channel on the 4H chart after repeated rejection from the upper trendline. Price is now hovering near key support at $111,785.
Key Technicals:
Rejection from the descending trendline resistance
Breakdown of the mini-channel structure
Current price: $113,637
Support levels:
$111,785 (Immediate)
$106,057
$101,409
$98,398
Bearish continuation is likely if $111,785 breaks with volume
If the $111.7k zone fails to hold, BTC could see further downside toward $106k and even $98k in the coming sessions.
Invalidation: Bullish only on reclaim of $117K+ with strength.
DYOR | Not Financial Advice
Harmonic Patterns
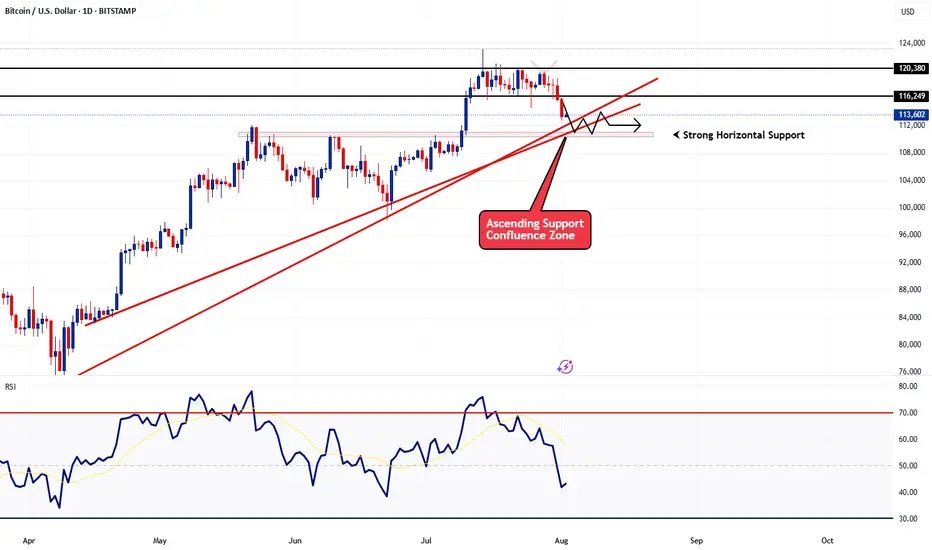
BTCUSD - Follow Up AnalysisTaking a look at the daily chart, price action did come down as previously expected in my last article.
Now we're heading into an area of strong support and I expect to see some sideways action until something significant happens next.
How I'm trading this price action?
I believe price action may continue to bounce around from the current price of 113,600 down to 110,000 for at least the next few days. With that said I'm implementing my range trading strategy. The range trading strategy also known as the Bitcoin Scalper scalps on the 1 and 5min timeframe creating sort of like a grid style approach but it's based on candlestick momentum. Since it trades off momentum, it's able to detect breakouts and know when to switch from the ranging strategy to the breakout strategy.
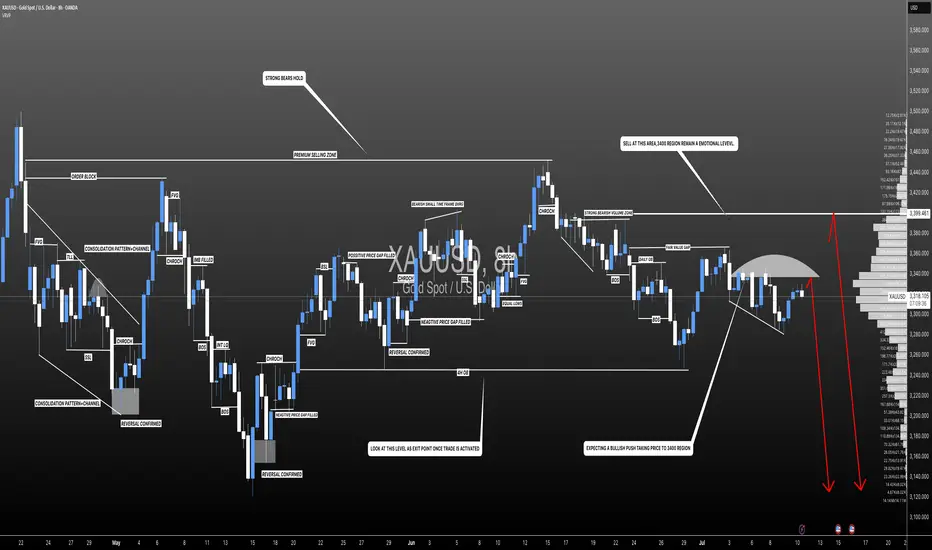
Update on the previous analysis.Our analysis hasn’t changed much since yesterday — we still believe the price will reach the $3,330 zone unless buying volume increases significantly and this area turns out to be a fakeout.
XAUUSD:Swing Sell Is Highly Likely! Get ReadyWe expect a smooth drop in gold prices, with prices potentially dropping around the 3250 area. Use Accurate Risk Management.
Please like and comment!
Team Setupsfx_
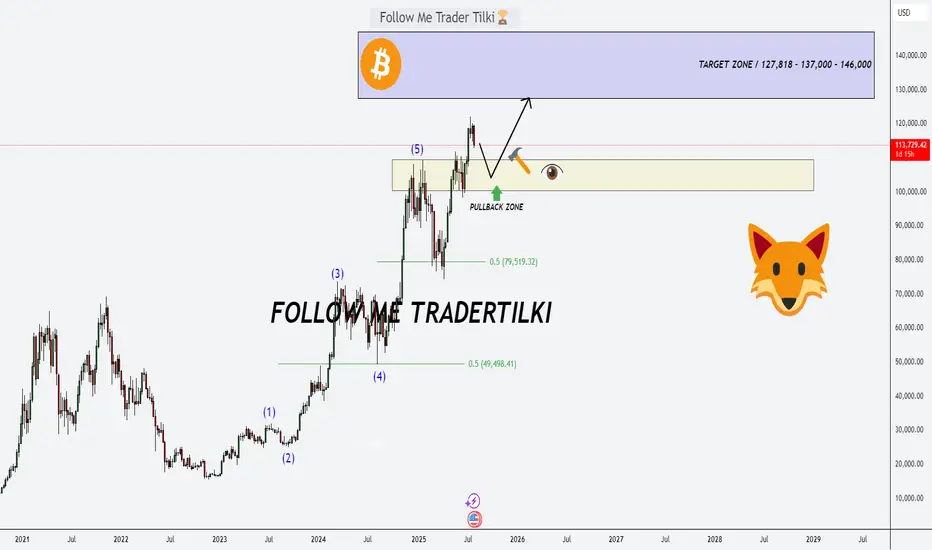
Bitcoin’s Game Has Changed: Fresh Support Zone, Targets Sky-HighHey Dear Friends,
Until recently, Bitcoin had been stuck in a range between 112,331 and 105,344 for quite some time. But that range has now been clearly broken. So, what does this mean? This zone, which used to act as resistance, is now expected to flip and act as support.
According to my weekly trading model, the long-term target levels I’m tracking for Bitcoin are: 127,818 – 137,000 – 146,000.
Since this is a weekly setup, it might take a while for these targets to play out. Even if we see pullbacks to the 112K, 105K, or even 100K levels, I expect to see strong buying pressure from that zone.
I’ll keep sharing regular updates as this setup develops.
To everyone who’s been supporting and appreciating my work—thank you, truly. Your encouragement means the world to me and keeps me motivated to keep showing up. Much love to all of you—I’m grateful we’re in this journey together.
The End of BTC correction? BTC analysis 2/8/2025In my point of view, BTC has completed its correction and is now ready for a strong upward move, potentially targeting the $137,000–$139,000 range, based on the following factors:
1. Confirmation of the Butterfly Harmonic Pattern
The recent reversal occurred within the expected range of the Butterfly harmonic pattern. Typically, the XD leg in a Butterfly harmonic extends to 1.27, but in practice, this can stretch up to 1.414, which is commonly used as a flexible stop-loss zone. After testing the 1.27–1.414 range, a clear 5-wave impulse followed—testing a key trendline and making an attempt to break above the recent high. This sequence, followed by a corrective move, suggests that the broader correction may be complete.
2. Complex WXYXZ Correction Structure
In my previous analysis, I underestimated the duration and depth of the correction. The wave (4) (blue), which is part of the wave (iii), has taken considerable time—likely to allow wave (5) to extend sufficiently to break above the $130,000 level. This would support the assumption that wave (5) (purple) is the extended wave. The overall corrective structure appears highly complex, and can be counted as a W–X–Y–X–Z pattern, supported by the presence of multiple internal corrections within the wave components.
3. 0.618 Fibonacci Retracement of Wave (3)
Wave (4) has now reached the 0.618 Fibonacci retracement level of wave (3), which is significant. Historically, BTC’s corrections rarely retrace beyond the 0.87 level. This deep retracement suggests wave (4) is likely complete—unless price were to fall below that threshold, which would invalidate this assumption.

NASDAQ | BEARISHNASDAQ has retraced after hitting its top.A parabolic downward shift and an obvious bearish trend tend to print a LH.It may form an ABCD pattern and a sell stop order may be placed at the breakout of LL.

Longterm Uptrend still in a Process!Look at 3 contact below.
Currently price avout to put 3rd touch to lower zone of trend and it marks to $148-$151.
After that upside move will start to gain momentum in my opinion.
Macro view is still bullish roughly above $150.
Downtrend not over yet !First upside attact till $171.
Then continue about to $150.
Up for 2 days, down for 2-4 days last time before the next mid term uptrend.

AAVE Daily Chart – Key Buy Zone & Two ScenariosAAVE is currently moving within a well-defined ascending channel on the daily timeframe. The last major bullish leg began from the $120 support and surged nearly +180% to a local high near $330.
Now, after a 25% pullback, price is consolidating around the midline of the channel near $250. More importantly, there’s a strong bullish order block sitting between $220–230, making this a low-risk buy zone with a stop below the order block.
🔸 Scenario 1 (bullish preferred):
Price dips into the $220 OB zone, completes a possible ABC correction, and launches a new bullish leg targeting the channel top above $500.
🔸 Scenario 2 (bearish alternate):
If the $220 order block fails, deeper correction could follow toward the channel bottom near $135.
⏳ This is a critical area to watch for reaction – Smart Money will likely show its hand soon.
🔗 Analysis by CryptoPilot

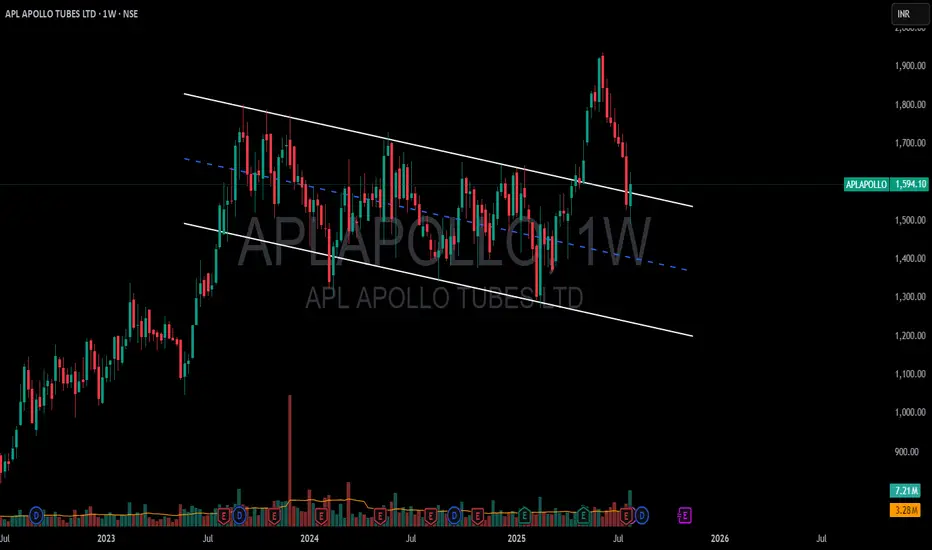
APL APOLLO TUBES Ltd. 1W📈 APL Apollo Tubes Ltd. – Bullish Channel Breakout
🔍 Pattern Insight:
Pattern: Bullish Channel (Falling or Rising?) Breakout
(Most likely a falling channel, which is bullish when broken upward)
Current Price: ~₹1594
Breakout Status: ✅ Breakout done
Current Action: 🔁 Retest phase underway
All-Time High (ATH): ₹1,685 (approx as per recent charts)
📊 Technical Setup:
Aspect Details
🔓 Breakout Type Bullish channel (indicates trend reversal or continuation)
🔁 Retest Currently testing breakout zone (bullish if holds ~₹1580–1600)
🔥 Confirmation High volumes + bullish candle near ₹1600
📈 Next Resistance ₹1640 → ₹1685 (ATH)
🧨 Break Above ATH Blue sky breakout; target can go into uncharted territory
🎯 Target Zones After Momentum:
Phase Target
✅ Breakout Sustains ₹1640 (minor supply)
🔼 ATH Challenge ₹1685 (strong resistance)
🚀 Post ATH ₹1750 → ₹1800 (based on Fibonacci or channel projection)
🛡️ Risk Management (Invalidation Levels):
Retest below ₹1575–1560 with strong red candle and volume = ⚠️ weak setup
Better to keep a stop-loss below ₹1550 if swing trading
📅 Strategy Suggestion:
🧪 If you're planning an entry:
✅ Entry Zone: ₹1590–1600 (post confirmation of support)
🛑 Stop-loss: ₹1548 (safely below breakout zone)
🎯 Targets:
1st: ₹1640
2nd: ₹1685
3rd (if ATH breaks): ₹1750+
📌 Summary:
APL Apollo has shown a bullish channel breakout ✅
Retest in progress → if buyers defend ~₹1580–1600 zone with volume, uptrend may resume
Potential to break ATH of ₹1685 if momentum continues
Watch volume and Nifty Metal Index for broader confirmation
Disclaimer: The information provided is for educational and informational purposes only and should not be considered as financial advice. Investing in the stock market involves risk, and past performance is not indicative of future results. Please consult with a certified financial advisor or conduct your own research before making any investment decisions. We are not responsible for any losses incurred as a result of using this information. Stock market investments are subject to market risks; read all related documents carefully.
VETUSDT is BullishPrice was in a downtrend, however the bullish divergence with a double bottom reversal pattern hints the control of bulls. If previous lower high is broken with good volume then we can expect a bullish reversal as per Dow theory. Targets are mentioned on the chart.

Overhyed Punishment This is what happens when everyone starts to fomo.
Lucky things, I sold some of my Altcoin with profit when BTC went into overbought band as in my chat.
BTC is bearish as long as below 117.6 to 118k :) . Good luck

ITC 1D🔺 Triangle Pattern (likely Symmetrical/Ascending Triangle)
Current Price Zone: ₹416
Pattern Type: Likely Ascending Triangle (if higher lows are forming against a horizontal resistance)
Resistance Level: Around ₹416–420
Breakout Confirmation: Needs a strong bullish candle above resistance with significant volume.
📊 What to Watch:
Volume:
A genuine breakout should happen with above-average volume. Watch the 50-period or 20-period average volumes on daily or 1H chart.
Breakout Candle:
Should close above ₹420 ideally. A breakout without closing above resistance is risky.
Retest Possibility:
Sometimes, price may break out and retest the breakout level before continuing the uptrend. Don’t panic if it slightly dips and holds support near ₹416.
🎯 Target Levels After Breakout:
You can calculate the triangle breakout target like this:
Target = Height of triangle + Breakout point
Let’s assume the base of triangle is from ₹375 to ₹416 = ₹41 range
Breakout Target = ₹416 + ₹41 = ₹457
📌 Extended Target (Momentum-based): ₹475–₹500 zone
📌 If volumes + broader market support: ₹500+ is possible, especially in swing or positional setups.
📉 Invalidation (Risk Management):
If after breakout, price falls below ₹410–408 with volume, it could be a false breakout.
Keep a stop-loss below previous swing lows or support trendline.
🧠 Summary:
✅ Triangle breakout with volume = bullish confirmation
🎯 Targets: ₹457 → ₹475 → ₹500
❗ Risk zone: below ₹410
🔁 Retest is common before upmove continues
Disclaimer: The information provided is for educational and informational purposes only and should not be considered as financial advice. Investing in the stock market involves risk, and past performance is not indicative of future results. Please consult with a certified financial advisor or conduct your own research before making any investment decisions. We are not responsible for any losses incurred as a result of using this information. Stock market investments are subject to market risks; read all related documents carefully.

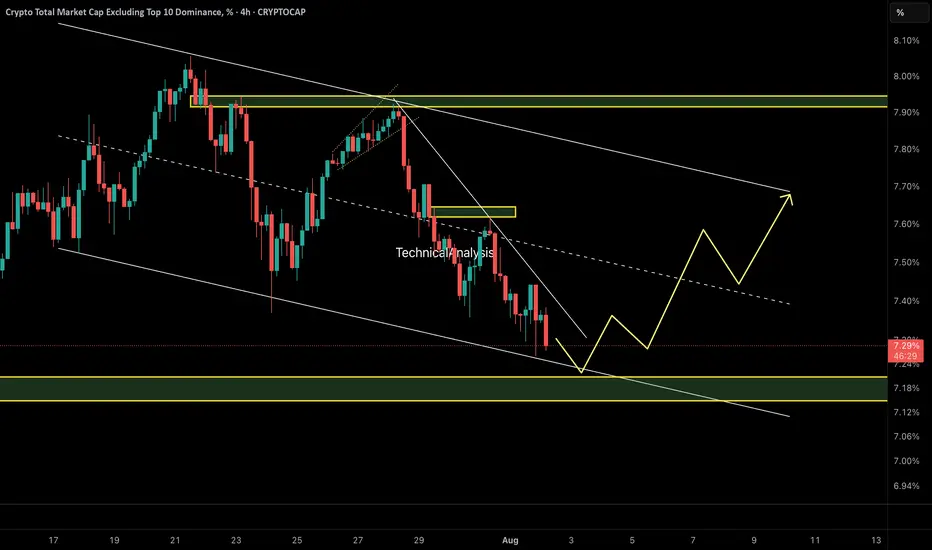
OTHERS.D – Perfect Reaction to Previous AnalysisAs predicted in the last update, OTHERS.D broke structure and dropped sharply toward the 7.20% demand zone — exactly as expected.
Now, we’re waiting for a potential bullish reaction from this key area. If demand holds, a move toward the upper channel boundary (~7.70%) could follow.
🧭 Technical Outlook:
• Price tapped into a key demand zone at 7.20%, which aligns with the lower boundary of a descending channel.
• A bullish reaction is forming, suggesting short-term strength in altcoins.
• A move toward the channel top near 7.70% is now on the table if demand holds.
⚠️ Important Note:
This move is likely to remain a corrective rally unless we see a proper breakout above 7.70% with volume and structure shift. Be selective with altcoin longs.
🔍 Watch for:
• Reaction at 7.50% midline
• Price behavior at 7.70% resistance
• Structure shift or failure pattern near channel top
⚠️ Caution: This remains a corrective rally unless price breaks 7.70% with structure shift.
🔗 Analysis by CryptoPilot
Long-Term Technical Outlook: Critical Decision Point Approaching
The chart illustrates a long-term technical structure where the price has been following an ascending channel after a prolonged bearish trend. However, recent price action indicates a breakdown below the green ascending trendline, raising concerns about a potential shift in market sentiment.
Currently, the $117 level is acting as a pivotal support zone. A sustained breakdown below this level — and more critically, below the red lower trendline — would validate the bearish scenario. This could trigger a deeper correction phase, with downside targets aligned along the red projection path. Such a move may lead to significantly lower price levels in the medium to long term.
🔽 Bearish Scenario:
If the price fails to hold above $117 and breaks below the red trendline, this would confirm the start of a bearish leg. Based on historical structure and projected trajectories, this could result in a descent toward the $93 level initially, with the possibility of extending further downward depending on market conditions.
🔼 Bullish Scenario:
On the other hand, if the price manages to reclaim the green trendline and more importantly, stabilize above the $204 resistance zone, it would signal renewed bullish strength. Such a move would open the path toward higher highs, potentially re-entering the previous upward channel and continuing the macro uptrend.
🧭 The price structure is now approaching a decisive zone, where either a confirmation of bearish continuation or a bullish recovery will likely unfold. Both scenarios have been visually outlined — green lines indicating bullish continuation, and red lines representing bearish momentum.
📌 Note: This analysis is for educational purposes only and should not be interpreted as financial advice.

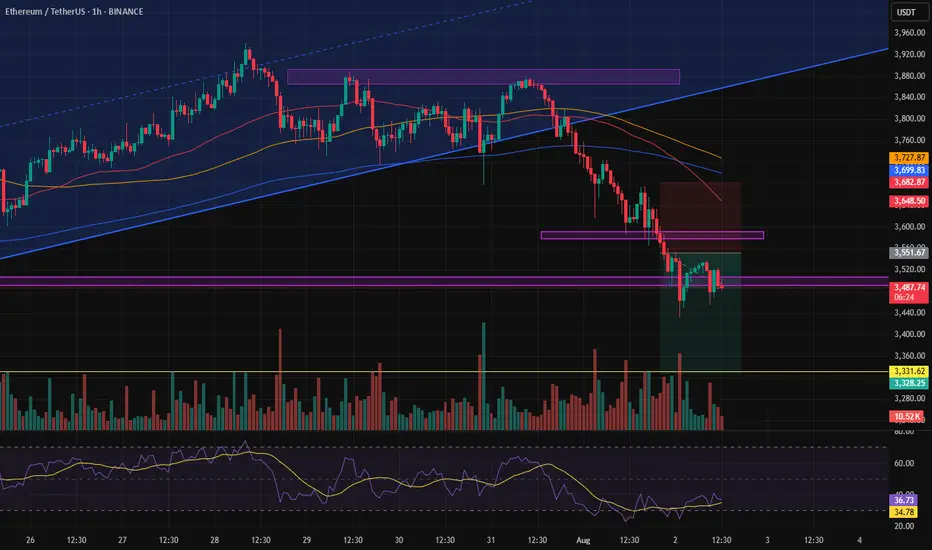
The Loudmouth Pattern: It Yells, We Trade!
On the 30-minute chart, ETH is forming a classic Broadening Formation – or as some traders like to call it, “The Big Mouth Pattern” 😄. It’s noisy, unpredictable at first glance, but when it speaks, you’d better listen.
Right now, price is moving through the bullish leg of this setup, and if momentum holds, we’re eyeing the $4,000 psychological level, followed by the $4,120 – $4,170 supply zone.
🔹 Bullish Scenario (our expected outlook):
🎯 Target 1: $4,000
🟩 Main Resistance: $4,120 – $4,170
❌ Invalidation: Confirmed close below $2,946
If price breaks and holds below that red support zone, this setup gets thrown out the window.
📊 Risk Management:
Scale in on pullbacks – if structure remains valid
No chasing without confirmation
Keep risk under 1% of total capital
📈 The market’s big mouth is open – and until it closes below $2,946, we’re listening for bullish signals. 🤑

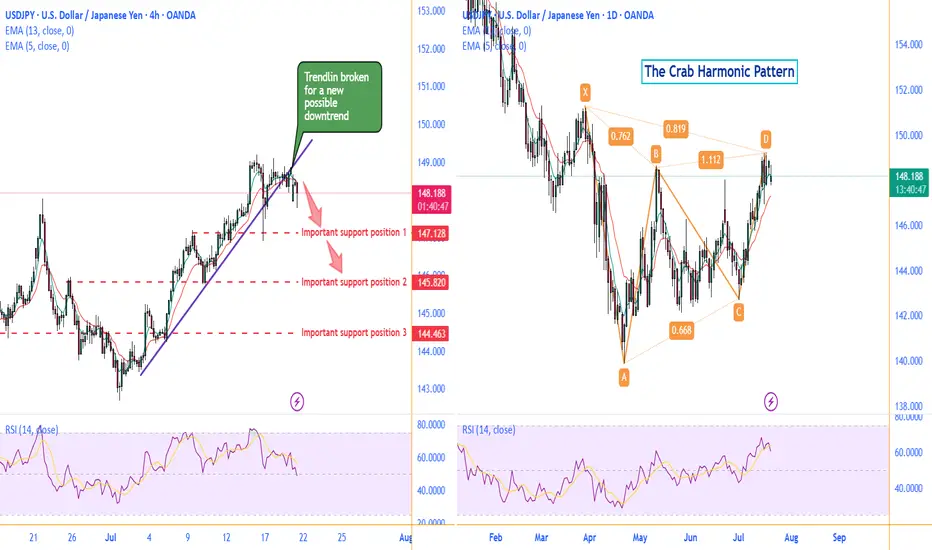
0721 Impact of Japanese Senate Elections on Yen Exchange Rate Hello traders,
1. I spent the entire weekend following the Japanese Senate elections, as they will determine the fluctuations of the world's largest financing currency—the yen exchange rate.
★ The results are out, and we are currently in scenario two— the ruling coalition suffered a crushing defeat + Shigeru Ishiba refuses to resign. However, senior figures within the Liberal Democratic Party, such as Taro Aso, have publicly stated that they intend to demand Prime Minister Ishiba's resignation for accountability, increasing the pressure on Ishiba to step down. This means we might see "scenario three"—the USD/JPY exchange rate could potentially break through the 151-155 range.
★ Is this the worst-case scenario? Of course not. The worst-case scenario would be if the "far-right party" that campaigned on the slogan "Japan First" achieved a landslide victory in this election. The most notable winner is a marginal far-right party known as the "Reform Party."
The Reform Party originated from a YouTube channel during the pandemic, which spread conspiracy theories about vaccines and "global elite conspiracies." NHK estimates that the Reform Party will win up to 22 seats, whereas three years ago, they had only 1 seat in the Senate and currently have only 3 seats in the House of Representatives.
✔ Let's take a look at this big winner's political proposals—stricter immigration restrictions + opposition to globalism + opposition to radical gender policies + reassessment of decarbonization and vaccine policies + massive tax cuts + increased social welfare spending. This means Japan may implement more "radical tax cuts" combined with aggressive economic stimulus through quantitative easing, leading to a more severe depreciation of the yen, increasing the likelihood of the USD/JPY exchange rate rising to the 160 range.
★ What are the risks of a sharp depreciation of the yen?
For Asia, the depreciation of the yen typically drags down other Asian currencies collectively, especially under U.S. tariff pressures, where Asian currencies are already under devaluation pressure. A strong depreciation of the yen would mean Japan is taking other Asian countries along with it off a cliff. We need to pay attention to the "passive" depreciation of the renminbi.
Asia will feel the pain, but Europe and the U.S. will also suffer. Theoretically, if the USD/JPY exchange rate surges (indicating a sharp depreciation of the yen), it is very advantageous for arbitrage trading with leverage (because the yen becomes cheaper). However, when the yen experiences a severe depreciation, the situation changes.
Let me give you a classic example: After Shinzo Abe returned to power at the end of 2012, he launched the "three arrows" economic policy: unlimited quantitative easing monetary policy + fiscal stimulus + structural reform = artificially lowering the yen exchange rate to stimulate exports (the clear goal was to increase the USD/JPY exchange rate) = rapid depreciation of the yen (from 80 in 2012 to 125 in 2015).
So what happened then? — A large number of Japanese institutions sold off U.S. bonds, European bonds, and REITs to cash out. The reason is simple:
✔ Japanese financial institutions (such as GPIF, insurance companies, and banks) hold a large amount of dollar/euro assets. When the yen depreciates, the yen-denominated market value of these foreign currency assets skyrockets. Selling off overseas assets is equivalent to cashing out foreign exchange gains in advance.
✔ The proportion of foreign currency assets is too high → must rebalance. Due to the yen depreciation, a large institution that originally allocated 20% of its total assets to foreign currency assets might see that proportion swell to 30% or 40%. This triggers asset allocation restrictions within pension and insurance funds (ALM principles), necessitating the sale of overseas assets and reallocation to yen-denominated assets.
✔ The yen depreciation phase is usually accompanied by an expansion of the U.S.-Japan interest rate differential. If Japanese institutions hedge their dollar assets, the hedging costs become very high (the costs of hedging through FX swaps and forwards rise), so they must also sell off some assets to reduce exposure. Therefore, in 2013, there was a collective sell-off of U.S. and European bonds.
Technically:
Daily chart, there is a possible Crab Harmonic Pattern.
The Crab Harmonic Pattern
From the chart, we can see:
The upward move from A to B is labeled as 0.762, which falls within the Fibonacci ratio range of 0.618-0.786 for the A-B leg of the Crab pattern.
The downward move from B to C is labeled as 0.668, which also falls within the Fibonacci ratio range of 0.382-0.886 for the B-C leg of the Crab pattern.
The upward move from C to D is labeled as 1.112, which corresponds to the Fibonacci ratio range of 1.13-1.272 for the C-D leg of the Crab pattern.
Based on these Fibonacci ratio relationships, we can identify this price action pattern as a typical Crab harmonic pattern. This type of pattern often suggests that the price may be about to reverse.
On the left 4H chart, the broken trendline is suggesting a new possible downtrend to begin .
Make a good use of those support positions, sellers of UJ could find a great trade deal.
Follow me to get more update on UJ.
GOOD LUCK!
LESS IS MORE!
Nifty : Technical levels metAs shared last week the nifty support 24510 , 24850 levels were worked as support exactly.
Now we may see sideways market and range bounded moves.
Sharing fresh levels:
Support : 24460
Resistance: 24660, 24850

Cardano sellll shorts All markets have TB in August.
Cardano sellll short
Tp1:0.50
Tp2:0.44
Tp3:0.29
Tp4:0.16😄😄😄😄😄

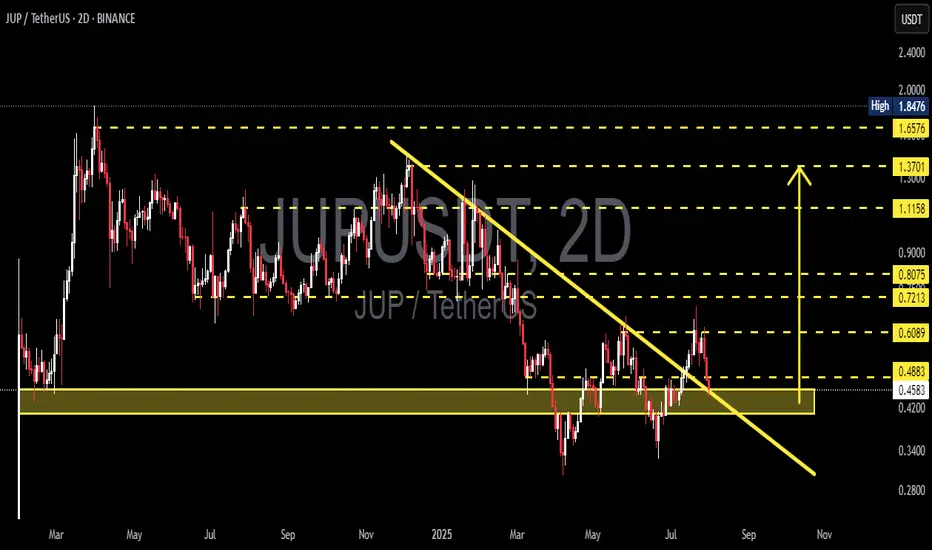
JUP/USDT Retests Key Support! Bounce Incoming or Breakdown Ahead📉 Complete Technical Analysis:
The JUP/USDT pair is currently showing a critical price action after breaking out from a medium-term descending trendline (yellow diagonal line). However, the price is now retesting a major demand zone around $0.4200–$0.4574.
📌 Pattern Identified:
Descending Trendline Breakout: Price successfully broke above a long-standing bearish trendline.
Retest of Breakout Zone: The current move is a classic retest, often seen before a trend reversal continuation.
Strong Demand Zone: The yellow zone ($0.4200–$0.4574) has historically served as a strong accumulation and bounce area.
---
📈 Bullish Scenario:
If the price holds and bounces from the $0.4200–$0.4574 zone, bullish momentum could resume with upside targets:
Short-term target: $0.6089
Next resistances: $0.7213 – $0.8075
A confirmed higher low above support would strengthen the bullish structure.
---
📉 Bearish Scenario:
If the price breaks down below $0.4200, bearish pressure could return, leading to further downside.
Potential decline toward deeper support levels around $0.35–$0.30.
Breakdown with increasing volume would confirm seller dominance.
---
🎯 Key Levels to Watch:
Support Zone: $0.4200 – $0.4574 (Critical Retest Area)
Immediate Resistance: $0.4883, $0.6089
Major Resistance Levels: $0.7213, $0.8075, $1.1158, up to $1.6576
---
🧠 Conclusion:
JUP/USDT is currently at a crucial decision point. The reaction at this support zone will define whether the breakout holds or fails. Traders should watch this level closely for confirmation of the next major move.
#JUPUSDT #CryptoAnalysis #AltcoinUpdate #TechnicalAnalysis #CryptoBreakout #SupportAndResistance #TradingView #Cryptocurrency #ChartPattern #BullishSetup #BearishCase
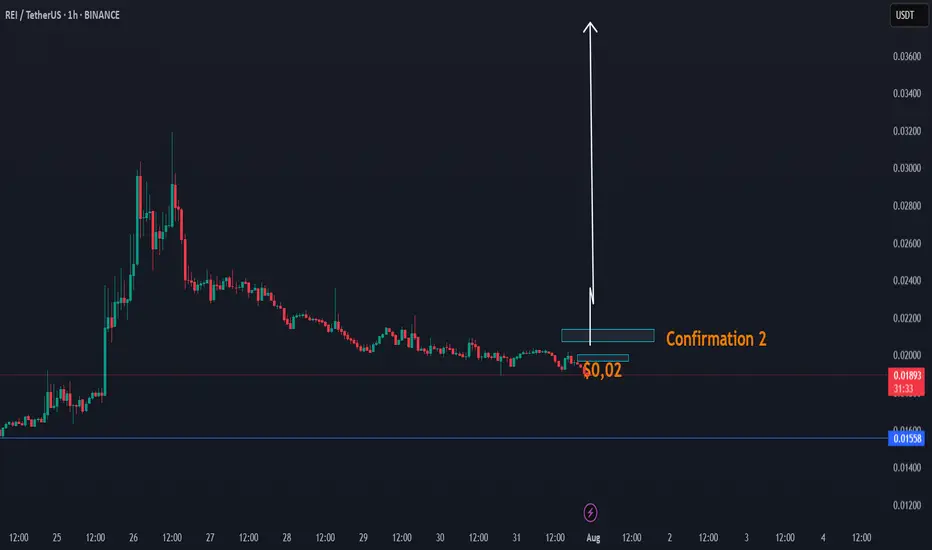
DAY UPDATE REI/USDT THE INCREASE CANDLE OF UP $0,03 - $0,05REI is an interesting coin since the update of Q4
We have seen that this coin was able to increase to $0,031 and until here $0,018 zone, a return to where we are now. There is a high chance that this coin can recover next 24H if this coin is able to confirm the confirmation $0,02 - $0,021
This coin, as before, was targeted at $ 0.02 and had low volume. We expect that if it comes back to $ 0.02, it will be confirmation of the volume, which can take the trend with a candle to up $0,03
REI CONFIRMATIONS ZONE
Higher time frame
When you look normally at this coin, then this coin is in a trend line of breakdown. This can change with the next confirmations. The question is, are we going to see again $0,02 the next 24h? If yes high chance of a break.
We also have a cycle update 2025, check it here, expecting $0,90
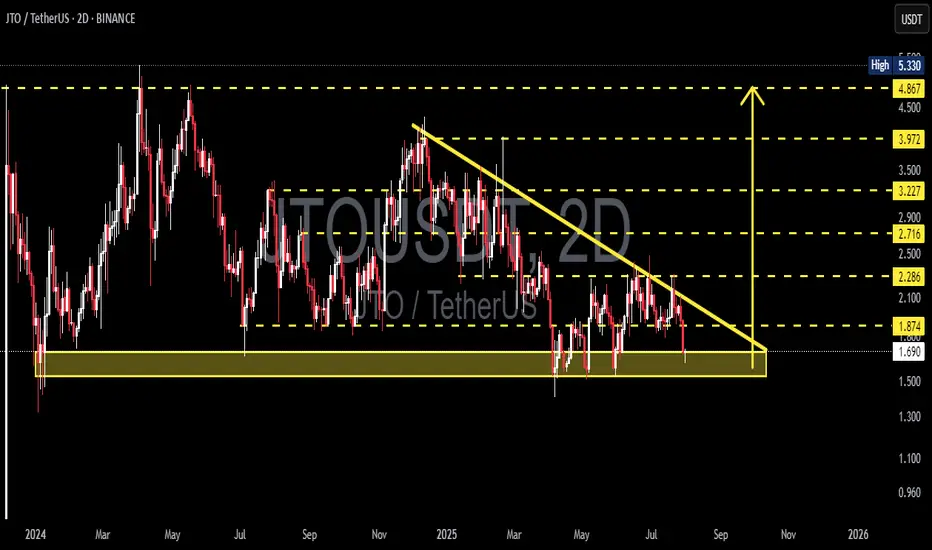
JTO/USDT at the Edge of Pressure – Breakout or Breakdown Ahead?🧠 Detailed Technical Analysis (2D Timeframe):
JTO/USDT is currently consolidating at a critical support zone within a well-defined Descending Triangle pattern that has been forming for over 6 months.
Key observations:
Price has been making lower highs, forming a downward-sloping resistance trendline.
Meanwhile, strong buying interest has held up the support zone between $1.69 and $1.87, suggesting accumulation.
This creates a classic Descending Triangle, often leading to a sharp breakout or breakdown.
---
📌 Key Levels:
Level Description
$1.69–$1.87 Major Demand Zone / Key Support
Descending Trendline Dynamic Resistance (from Lower Highs)
$2.29 First Resistance (Breakout Trigger)
$2.71 Key Mid-Term Resistance
$3.22 – $3.97 Major Upside Targets
$1.50 & $1.30 Breakdown Targets
---
📈 Bullish Scenario (Breakout):
If the price holds the support and successfully breaks the descending trendline, we could see a strong bullish reversal:
Confirmation breakout may lead to a rally toward $2.29 → $2.71 → $3.22 → up to $3.97.
Breakout strength increases if accompanied by volume surge.
Bullish Catalysts:
Positive project fundamentals.
Volume squeeze near triangle apex.
RSI/MACD divergence (if present).
---
📉 Bearish Scenario (Breakdown):
If price closes below the $1.69 zone with conviction:
Descending triangle confirms as a bearish continuation.
Target downside to $1.50 and potentially $1.30.
Could signal distribution phase by larger players.
Bearish Confirmation: Strong 2D candle close below $1.69 with high volume.
---
🧩 Pattern Breakdown – Descending Triangle:
The pattern represents price compression between lower highs and a horizontal support.
Statistically, 70% of descending triangles resolve to the downside.
However, in oversold conditions or with bullish catalysts, it may lead to a powerful short squeeze breakout.
---
🧭 Summary & Strategy Insight:
JTO/USDT is nearing a decision point. At the edge of the triangle’s apex, volatility is likely to spike — with a strong move in either direction.
💡Possible Strategy:
Conservative entry: Wait for breakout confirmation above the trendline with volume.
Aggressive entry: Speculative buy near $1.70 with tight stop loss.
Avoid heavy positions until the breakout or breakdown confirms.
---
🧲 Suggested Post Title:
> "JTO/USDT at a Crossroads – Descending Triangle Set for Explosive Move?"
A breakout is imminent. Will you be ready?
#JTOUSDT #CryptoBreakout #DescendingTriangle #AltcoinSetup #TechnicalAnalysis #CryptoStrategy #ChartPatterns