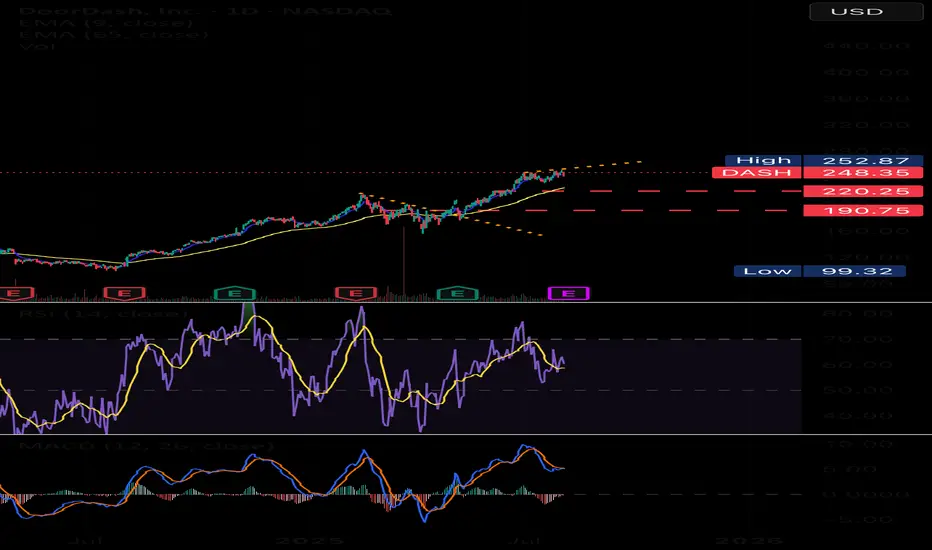
$DASH NASDAQ:DASH buyers look hesitant to buy right now after the weak job report and the Fed signaling no rate cuts anytime soon. This adds pressure on consumer pockets, limiting discretionary spending. If this trend continues, we might see DoorDash consumers slow down their activity, which could impact the company’s revenue growth.
With macro headwinds and reduced consumer demand, NASDAQ:DASH price action could remain under pressure in the short term. A break below key support levels may trigger further downside unless the market sentiment shifts with improved economic data.
Harmonic Patterns
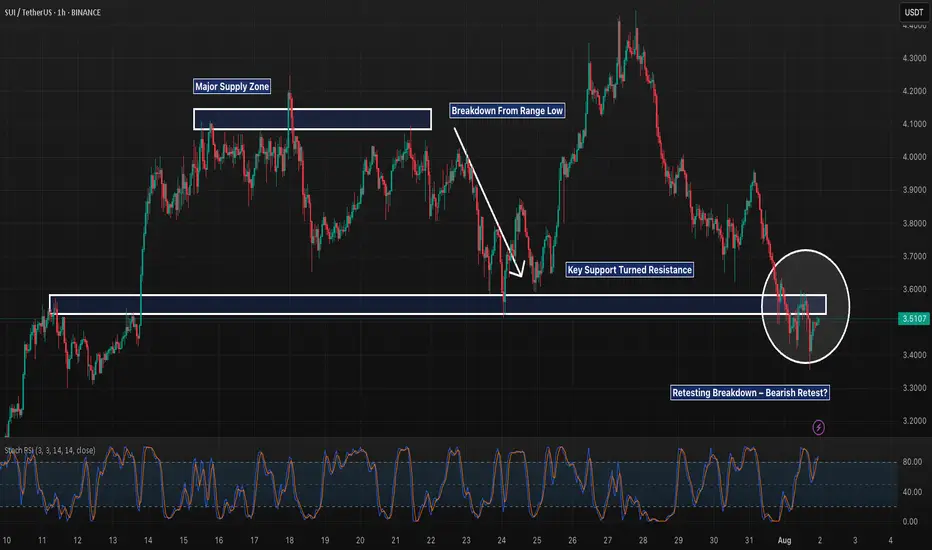
SUI 1H – Breakdown & Retest of Key Support, But Will It Reject?SUI 1H – Breakdown & Retest of Key Support, But Will It Reject or Reclaim?
Description:
SUI just completed a textbook range breakdown after weeks of sideways chop between ~$3.60–$4.10. The prior support floor has now flipped into resistance, and the recent bounce appears to be retesting that structure. If this retest gets rejected, continuation toward lower support zones (potentially $3.30 and below) becomes likely.
However, reclaiming and holding above $3.60 could trap late shorts and fuel a squeeze. Structure still favors bears for now, but it’s decision time.
📌 Breakdown structure
📌 Bearish retest
📌 Eyes on confirmation or invalidation
This is the battle zone — stay sharp.
RNDR/USDT at a Critical Turning Point: Golden Pocket as the Key?✨ Overview:
Render Token (RNDR) is currently testing a crucial support zone — the Golden Pocket Fibonacci Retracement between 0.5 (3.616) and 0.618 (3.385). This zone not only represents a significant retracement level but has historically acted as a strong demand area, often serving as a springboard for major price reversals.
---
🧠 Detailed Technical Analysis:
🔸 Support Zone & Golden Pocket
Price has retraced back to the 0.5 – 0.618 Fibonacci zone, a high-probability reversal area.
This zone has acted as a demand base multiple times since February 2025.
How the price reacts here will likely define the next major trend direction.
🔸 Market Structure
The overall structure shows a mid-term downtrend, marked by lower highs and lower lows.
However, the current price action shows slowing bearish momentum, indicating potential hidden accumulation.
A potential double bottom pattern could be forming, hinting at a bullish reversal if confirmed.
---
📈 Bullish Scenario:
1. Strong Rebound from the Golden Pocket
Watch for bullish candlestick patterns (e.g., pin bar, bullish engulfing) near $3.38–$3.61.
Initial resistance levels: $4.16 – $4.72
If broken, mid-term targets could extend to $5.47 – $6.68
2. Double Bottom Confirmation
A confirmed double bottom with a neckline breakout around $4.16 would greatly strengthen bullish momentum.
3. Increased Buying Volume
A spike in volume during the rebound would validate bullish sentiment and potential trend reversal.
---
📉 Bearish Scenario:
1. Breakdown Below the Golden Pocket
If the price breaks below $3.385 with strong volume, we could see a move down toward $2.77, the next significant support.
2. Weak Bounce / Lower High
A failed breakout above $4.16 may indicate a bearish continuation after a temporary relief rally.
---
📌 Summary:
RNDR is currently at a technically sensitive zone. The Golden Pocket between $3.38 and $3.61 is the key area to watch. A strong bullish reaction could signal the start of a trend reversal, while a breakdown could trigger further downside continuation. Traders are advised to wait for clear confirmation via price action before committing to any strong positions.
---
🔖 Key Levels to Watch:
Level Description
3.38 – 3.61 Golden Pocket (Potential Buy Zone)
4.16 Minor Resistance
4.72 Bullish Breakout Trigger
5.47 – 6.68 Mid-Term Reversal Targets
2.77 Strong Support if Breakdown Occurs
---
🧩 Chart Patterns Observed:
Potential Double Bottom – early bullish reversal signal.
Golden Pocket Reaction Setup
Descending Structure – still intact but weakening.
---
🔍 Trade Ideas:
🔄 Wait-and-see approach: Wait for clear bullish confirmation on daily candles.
🎯 Aggressive Long Entry: Around 3.40–3.60 with a tight stop-loss.
⚠️ Short Opportunity: If a strong breakdown below 3.38 occurs with volume confirmation.
#RNDR #RenderToken #RNDRUSDT #CryptoAnalysis #GoldenPocket #FibonacciRetracement #DoubleBottom #PriceAction #SupportResistance #AltcoinSetup #CryptoSignals #TechnicalAnalysis

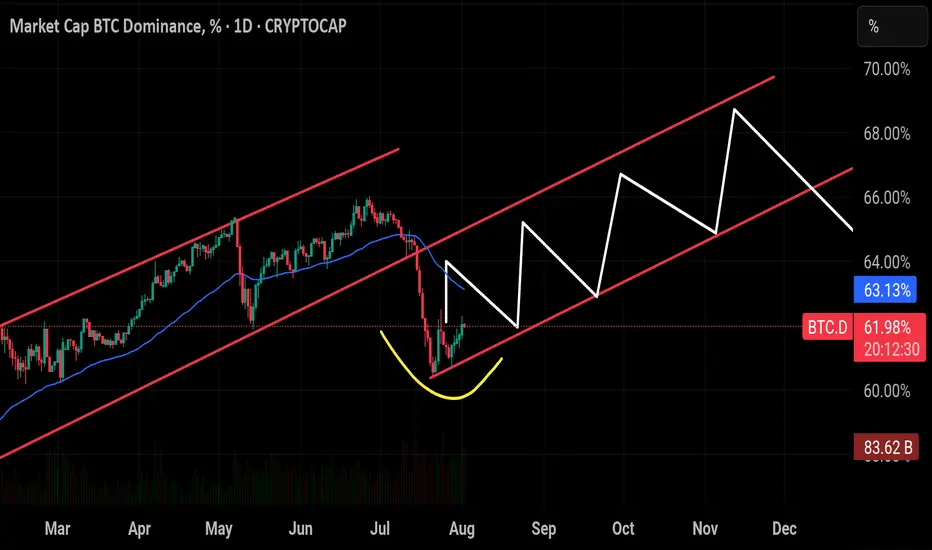
$BTC Dominance seems to be replaying its historical pattern —CRYPTOCAP:BTC Dominance seems to be replaying its historical pattern — after peaking around 66%, it’s now pulling back toward the critical 60% support zone. If the breaks below this level have triggered sharp drops toward 54%, often marking the start of strong altcoin seasons. Unless BTC.D closes back above 65%–66%, history suggests we could see another wave of altcoin outperformance in the weeks ahead. And looking at the chart structure, a breakout in BTC’s price action could align with this cycle, potentially driving Bitcoin toward a new all-time high soon.
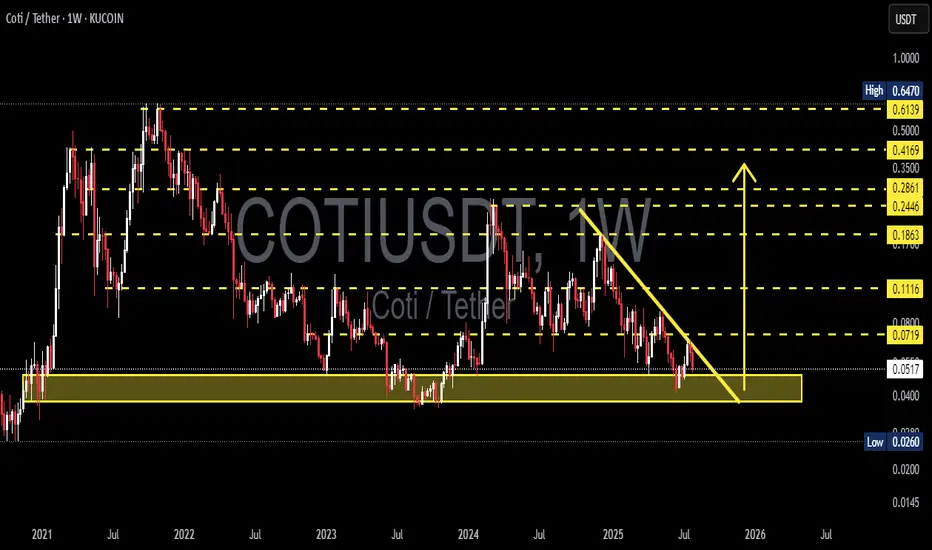
COTIUSDT Weekly Analysis Potential Reversal?📍 Current Price Position – On Top of Historical Support!
The COTI/USDT pair is currently testing a crucial support zone between $0.0400 – $0.0517, which has been a key demand zone since early 2021. This isn't just any support — it's a macro psychological area that has repeatedly triggered strong reversals in the past.
We are at a make-or-break level, where the next move could define the mid-term trend.
---
🧩 Price Structure and Pattern
📐 The chart shows a descending triangle pattern with:
Consistently lower highs (marked by the downward yellow trendline),
Flat horizontal base around the major support zone.
This pattern can result in:
A powerful breakout if the trendline is broken, or
A sharp breakdown if the horizontal support fails.
---
📈 Bullish Scenario: Reversal Momentum Building?
If price:
Breaks above the descending trendline (~$0.0719), and
Closes a weekly candle above that resistance zone,
➡️ We could see a breakout move with targets at:
Resistance Level Target
Initial Target $0.1116
Mid-Term Target $0.1863
Strong Zone $0.2446 – $0.2861
Long-Term Bullish $0.35 – $0.4169
📌 A confirmed higher high and higher low structure above $0.11 would strengthen the bullish case.
---
📉 Bearish Scenario: Breakdown from Support
If:
Price fails to hold the $0.0517 – $0.0400 support area,
and prints a weekly close below this zone,
➡️ The next bearish targets could be:
Support Level Target
First Support $0.0260
Psychological Level $0.0200
Extreme Panic Zone $0.0150 – $0.0100
⚠️ This would indicate a capitulation phase, likely to trigger panic selling and deeper lows.
---
🧠 Strategy Notes for Traders
✅ For Position Traders:
The $0.040 – $0.0517 area is a prime watch zone for reversal setups with tight stop-loss below $0.040.
Excellent Risk:Reward potential if reversal confirms.
✅ For Swing Traders:
Breakout above the trendline offers a solid entry signal.
Targets up to $0.1863 look achievable with strong volume.
✅ For Conservative Traders:
Wait for breakout + retest confirmation before entering.
Avoid FOMO — let the weekly candle close guide your decision.
---
⚡️ Final Takeaway
> COTI/USDT is at a tipping point!
This long-standing support is the last line of defense for the bulls. A breakout can trigger a macro trend reversal, while a breakdown will extend the downtrend and invite heavier selling pressure.
Watch for the weekly close, trendline reaction, and volume behavior — the next major move is likely just around the corner.
#COTI #COTIUSDT #CryptoAnalysis #AltcoinWatch #DescendingTriangle #BreakoutTrading #SupportAndResistance #PriceAction #ChartPattern #WeeklyAnalysis
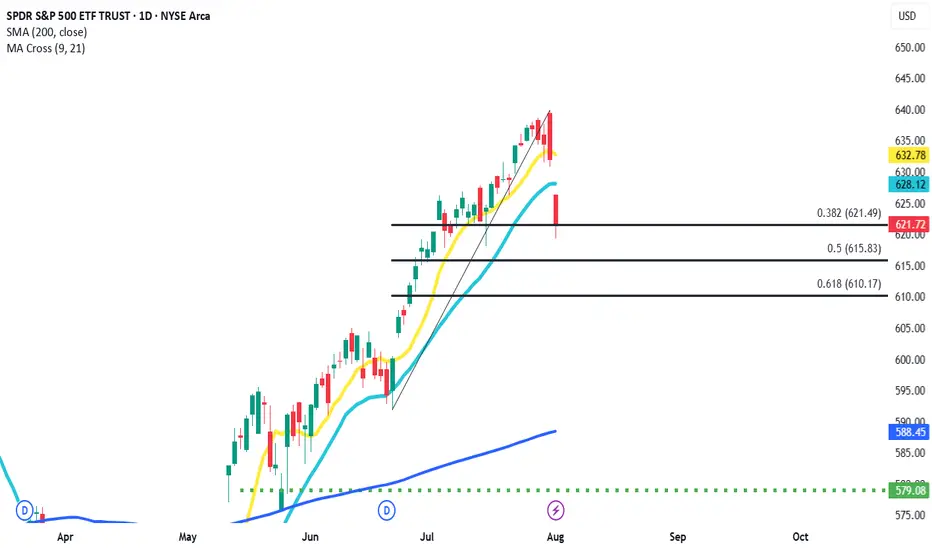
FIBO touch and goPretty violent last couple of days in July, but I honestly think it might be over for now. Price action couldn't break past .38 fibo retracement. If I'm right we could see continuation of uptrend in coming weeks.
Let's buy BTCUSD on correction!I found interesting opportunity in BTCUSD right now.
It has been moving in consolidation channel after recorded its all time high.
Based on Elliot Wave count, the price right now is making it's wave 4.
The next possible target is 120-125k.
CHEEEERRRSSS..!!!

EURAUD BULLISH MOVE CONTINUESOur analysis is based on a multi-timeframe top-down approach and fundamental analysis.
Based on our assessment, the price is expected to return to the monthly level.
DISCLAIMER: This analysis may change at any time without notice and is solely intended to assist traders in making independent investment decisions. Please note that this is a prediction, and I have no obligation to act on it, nor should you.
Please support our analysis with a boost or comment!

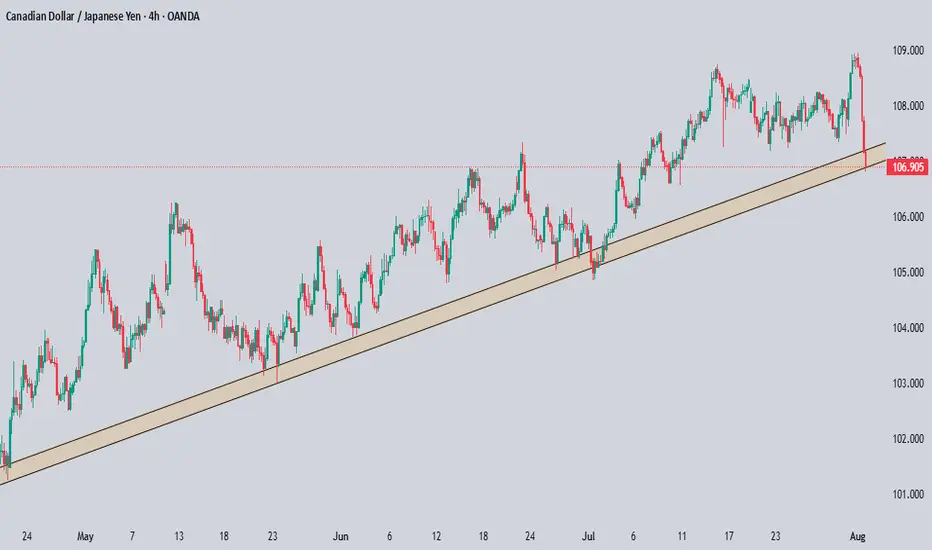
CADJPY Technical & Order Flow AnalysisOur analysis is based on a multi-timeframe top-down approach and fundamental analysis.
Based on our assessment, the price is expected to return to the monthly level.
DISCLAIMER: This analysis may change at any time without notice and is solely intended to assist traders in making independent investment decisions. Please note that this is a prediction, and I have no obligation to act on it, nor should you.
Please support our analysis with a boost or comment!
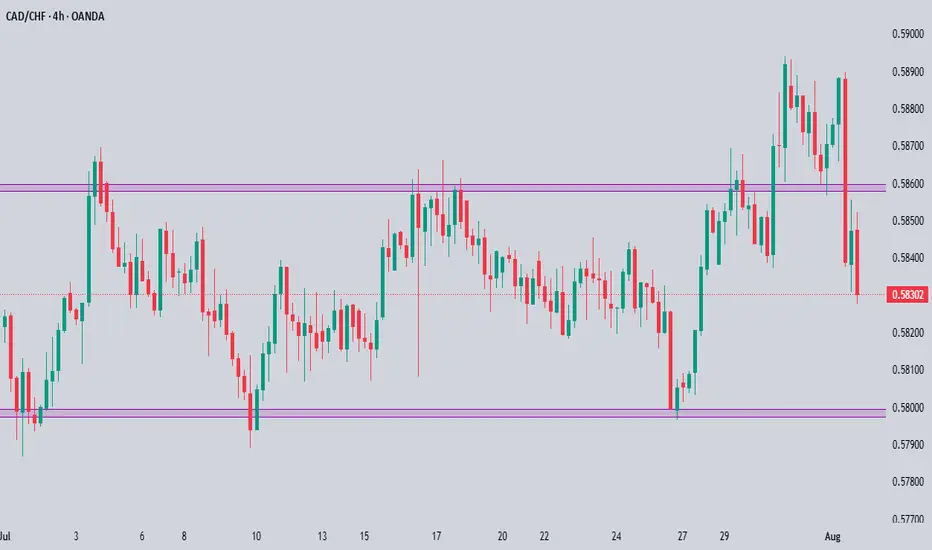
CADCHF Technical & Order Flow AnalysisOur analysis is based on a multi-timeframe top-down approach and fundamental analysis.
Based on our assessment, the price is expected to return to the monthly level.
DISCLAIMER: This analysis may change at any time without notice and is solely intended to assist traders in making independent investment decisions. Please note that this is a prediction, and I have no obligation to act on it, nor should you.
Please support our analysis with a boost or comment!
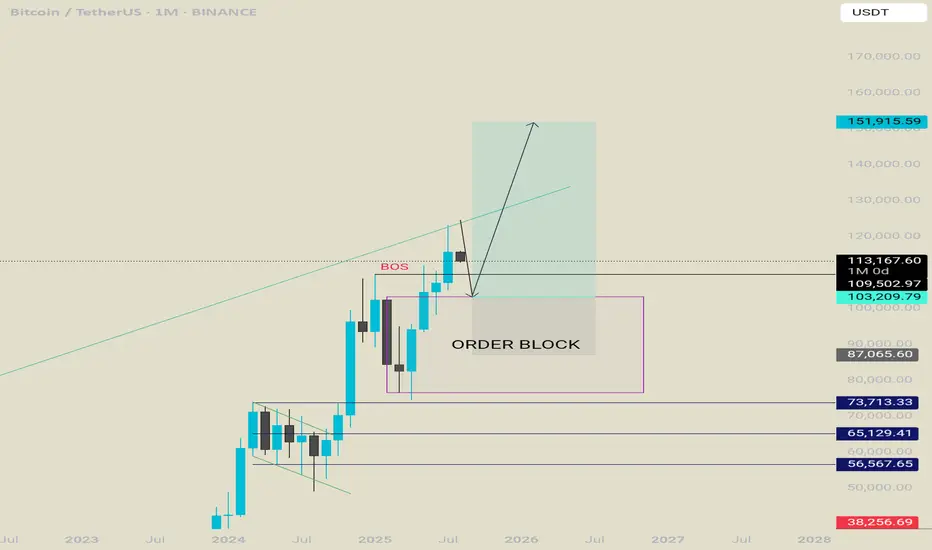
Bitcoin projection for the rest of the year. Bullish.We are in a retracement phase , i think btc will retrace deep enough to convince people that bull run is over . Once that happens it will flip to the upside and leave everyone shocked.
A retrace towards 108k-104k is possible.
Once they get tapped btc will start a new run towards a new all time high where everything will get to an end and a new besr market will start. Until then lets enjoy the rest of the year.
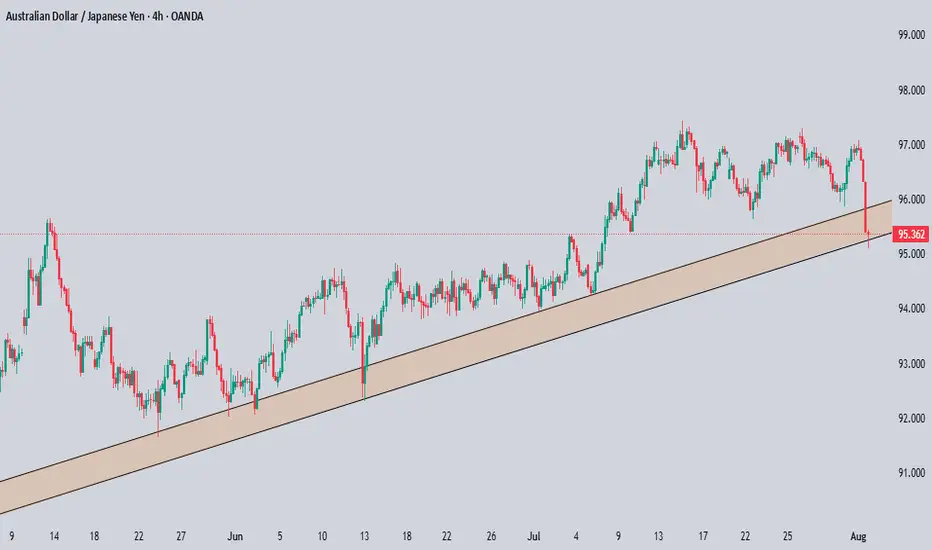
AUDJPY Technical & Order Flow AnalysisOur analysis is based on a multi-timeframe top-down approach and fundamental analysis.
Based on our assessment, the price is expected to return to the monthly level.
DISCLAIMER: This analysis may change at any time without notice and is solely intended to assist traders in making independent investment decisions. Please note that this is a prediction, and I have no obligation to act on it, nor should you.
Please support our analysis with a boost or comment!
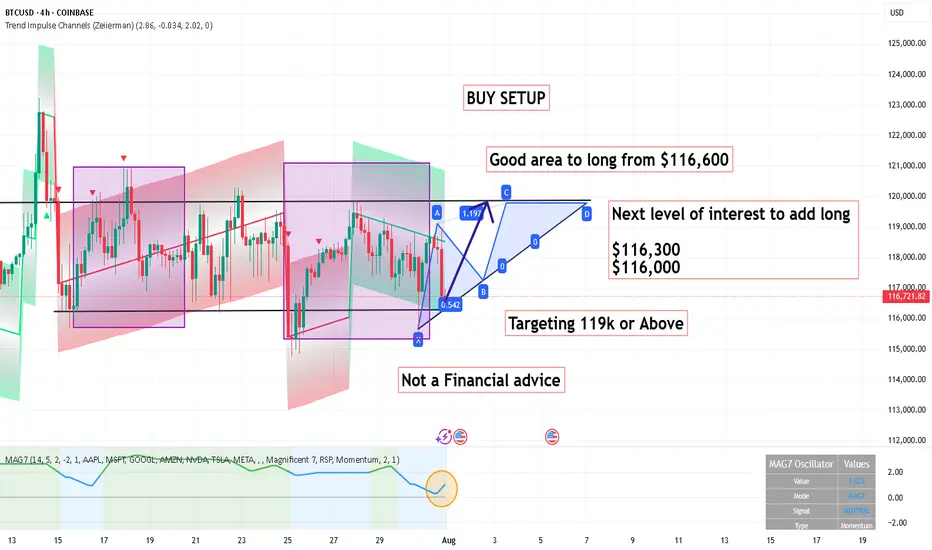
BUY SETUP ,Good area to long from $116,600BUY SETUP
Good area to long from $116,600
Next level of interest to add long
$116,300
$116,000
Targeting 119k or Above
Its not a Financial advice
ETH BUY SETUP ,Bought From $3830ETH BUY SETUP
Currently $3830
Bought From $3830
(Trading plan If ETH go down ,
to $3700 will add more longs)
Expecting target $3890 OR ABOVE
Stoploss at $3470
In the event of an early exit,
this analysis will be updated.

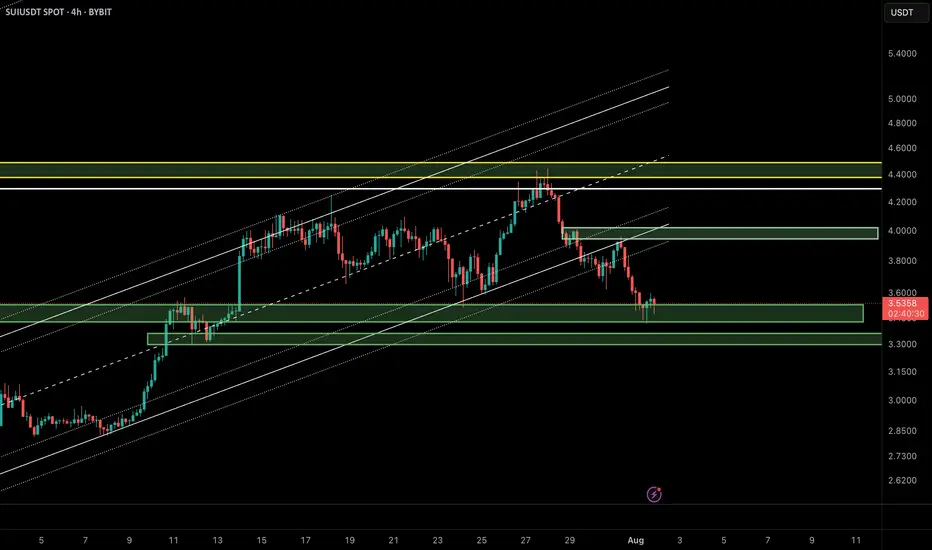
SUI/USDT Update – Bounce Setup from Demand Zone?In the previous analysis, we highlighted a short opportunity near $4.20, which played out perfectly. Now, SUI has reached a key demand zone around $3.40–$3.55, overlapping with the lower boundary of the ascending channel and a previously defined bullish order block.
🔹 Market Structure:
After breaking the bullish structure, price is now revisiting a major liquidity zone between $3.40 and $3.55.
🔹 Price Behavior:
Wicks to the downside suggest buy-side absorption and potential for short-term reversal.
🔹 Possible Scenario:
If the $3.40 zone holds, we could see a corrective move up to the supply zone around $3.90–$4.00.
📌 Key Levels:
• Support: $3.40–$3.55
• Resistance: $3.90–$4.00
❗️If the $3.40 support fails, bullish momentum will likely be invalidated in the short term.
🧠 Pro Tip (SMC-based):
When a demand zone aligns with liquidity sweep and channel support, it often becomes a high-probability area for institutional re-entries. Wait for a clear confirmation like BOS or bullish engulfing candle before entering.
⸻
🔗 Like, share, and follow for more Smart Money & Elliott Wave-based insights!
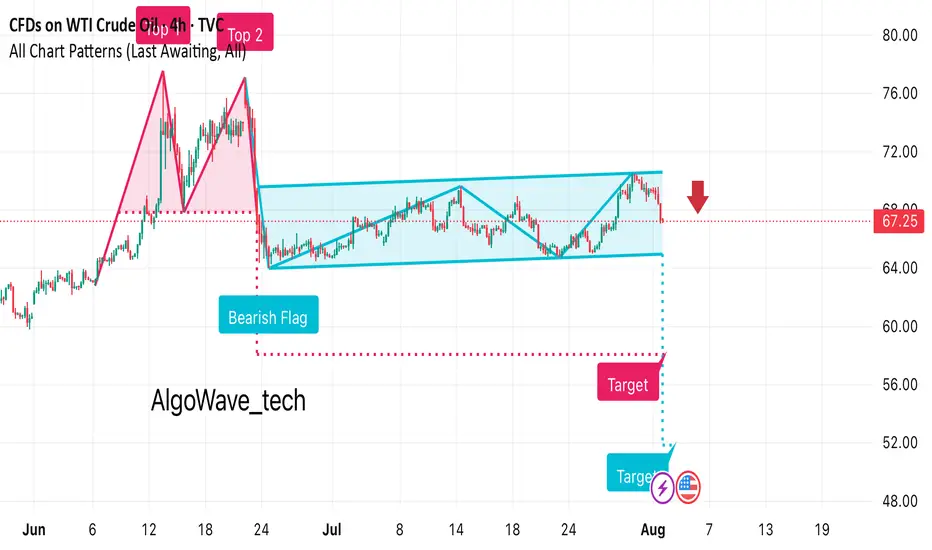
It looks like this chart for WTI Crude Oil is showing a bearish • Previous Move: There’s a strong downward leg before the flag formation, indicating bearish momentum.
• Flag Pattern: Price consolidates in an upward-sloping channel after the drop.
• Breakout: The chart suggests a bearish breakout below the channel, marked with a red arrow at around $67.25.
• Target Projection: The measured move target appears to be around the $53–54 range, based on the flagpole height.
Ethereum: Smart Money Reversal After Stop Hunt?In the previous update, we warned that Ethereum might drop lower before any meaningful bounce — especially if it failed to hold the midline of the ascending channel. That scenario played out exactly as anticipated.
🟡 Price action summary:
ETH broke below the midline of the weak ascending channel, hunted the liquidity below recent lows, and tapped into the key bullish order block near $3,490 – $3,520. Price is now reacting to this zone with early signs of a reversal.
📌 Key observation:
Midlines of weak or low-momentum channels often act as liquidity traps in smart money models. Buying at these levels can be extremely risky — especially during corrective or distribution phases.
⸻
📚 Educational Note:
Never enter long positions solely at the midline of a weak ascending channel, especially when there’s a high probability of liquidity sweep below. Smart entries usually occur at order blocks formed after stop hunts.
⸻
🎯 Next steps:
Wait for confirmation (such as internal BOS or FVG closure) before entering longs. The structure suggests a potential move back toward the upper boundary of the channel if this OB holds.
⸻
🔗 Save this analysis and share it with fellow traders.
💬 Thoughts? Drop your view in the comments.

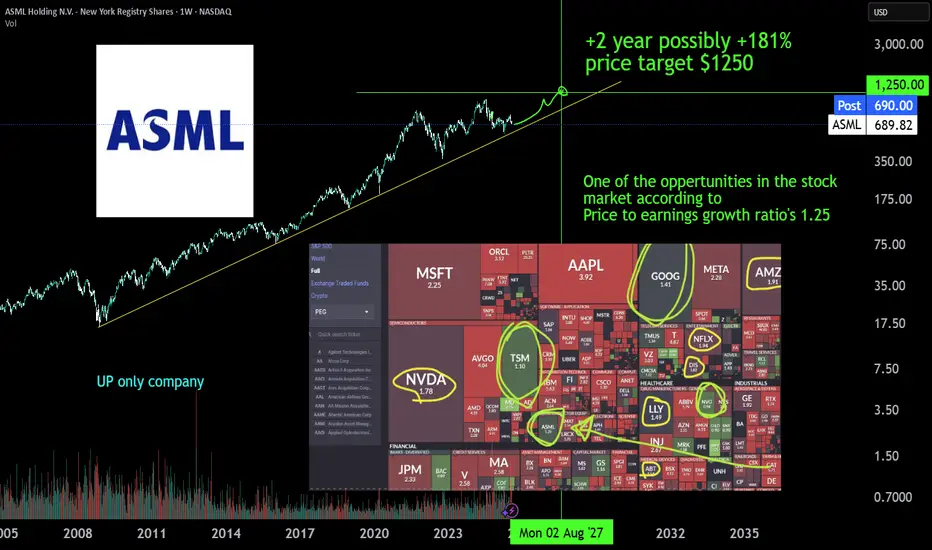
ASML monopolist, AI expanding +181% | 2Y oppertunity ASML is the monopoly Extreme ultra violet machinery company. There is no one close to it's technology or there is no one investing enough to R&D a thing like it. The whole AI datacenter and cloud chip growth depends on EUV machinery of ASML developed in 2013 (>10y of PhD level R&D deveopment). The first new High-NA EUV systems have been deployed at Intel in July 2025 for research purposes and will scale just like the EUV already does to keep pace with moore's law. TSMC has stated it will not yet depoly the machines but has to expand with to 10 year older tech EUV machines just to get the AI chip demand going. AI chip demand at NVIDIA is growing harder than expected comfirmed by latest earnigns of alphabet, microsoft, meta and amazon.
Also don't sleep on BESI a packing machinery wonder due to hydrid bonding technology, which makes 3D chip staking possible.
#GoHighTechNetherlands
Daily Orderflow on ES and NQ. 01.08.2025, NFP FridayCME_MINI:NQ1! CME_MINI:ES1!
Orderflow explanation. Sessional delivery and New York Price action

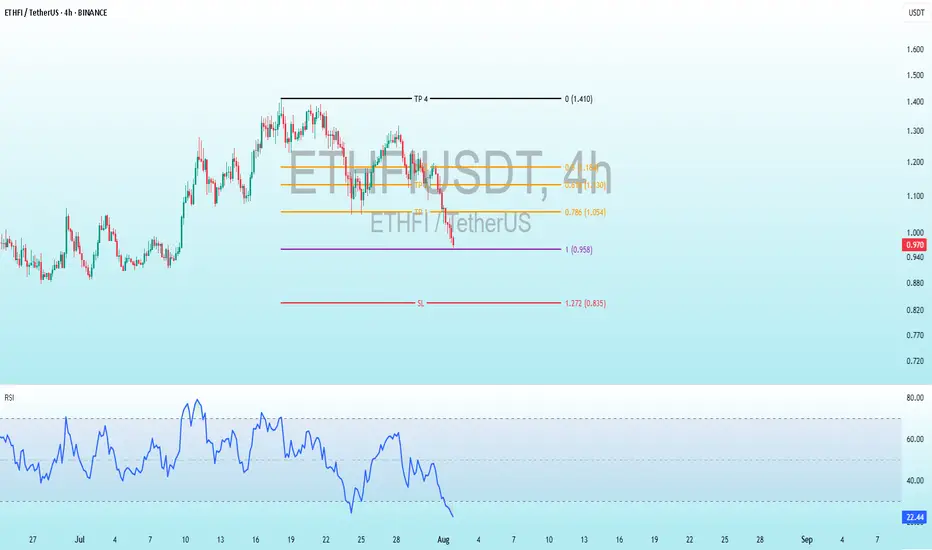
ETHFI Bullish DivergenceBINANCE:ETHFIUSDT
Trade Setup:
Target 1: 1.054 (0.786 Fibonnaci Golden Zone).
Target 2: 1.130 (0.618 Fibonnaci Golden Zone).
Target 3: 1.184 (0.786 Fibonnaci Golden Zone).
Target 4: 1.410 (0 Fibonnaci).
Stop Loss: 0.835 (1.272 Fibonnaci).
RSI Analysis: The RSI is showing a bullish divergence, suggesting potential bullish momentum. The current RSI is around 22.36, approaching oversold territory, so caution is advised.
Reversal from Channel Bottom or a Real Breakdown? Identifying th
🎯 BTCUSDT - Analysis
🔹 Analysis Date: 1 August 2025
📉BTCUSDT:
Price is currently moving inside an ascending channel and has touched the bottom of the channel again, offering a potential buy opportunity.
However, for those seeking a low-risk entry, the zone around 118,000 could be ideal—if price returns to the channel and confirms support.
Although it seems the channel’s lower boundary might break, this could be a fake break to mislead traders before a rebound.
The support at 110,000 is a crucial short-term level; if it fails, a deeper correction toward 98,090 or even 94,000 is likely.
Our targets remain at the upper boundary of the channel.
⚠️ Risk Management Tip: Wait for confirmation near 118,000 if unsure, and always size positions based on overall volatility.

OEX /SPX Bullish wave 5 pattern crossroads The chart posted is the sp 100 I am posting it as we are now at the crossroad for bull or bear count .We have rallied to .786 as I will show and have a wave a x 1.27 = c at the .786 High But if we break above 5922 in the Cash SP 500 There is NOTHING to stop it from reaching a target of 3005 in the OEX where wave A up or wave 1 x 1.618 = wave C Top or wave 3 in the SP 500 WAVE A or WAVE 1 up 5481 - 4835 = 646 x 1.618 =1045 plus wave B low or wave 2 5102low= 5102plus 1045 =6147.22 The exact high . This is the reason I took the loss and moved LONG .Best of trades WAVETIMER

**#XAUUSD H5 Higher Timeframe Analysis**
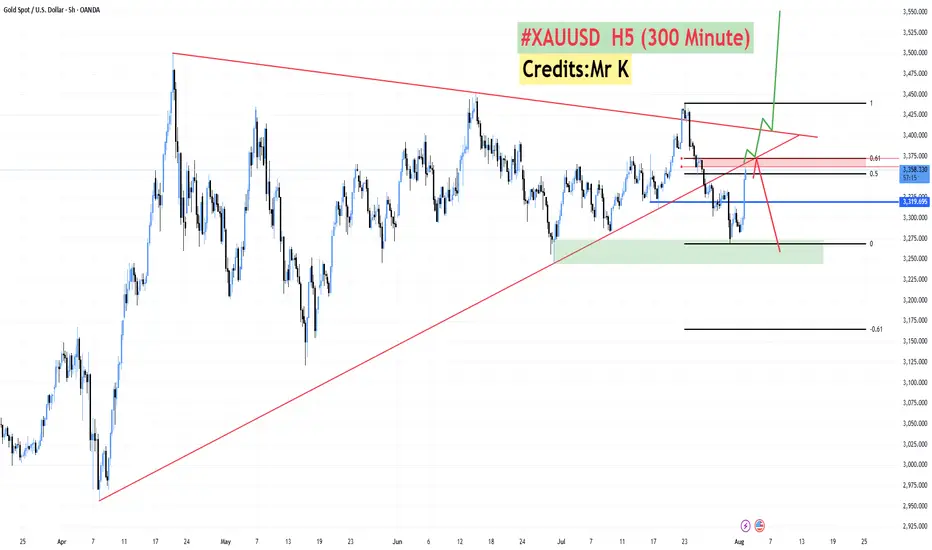
📊 **#XAUUSD H5 Higher Timeframe Analysis**
What we witnessed today was a **tremendous recovery in Gold 🟡** after **3–4 consecutive bearish sessions 📉**.
📅 **Today’s candle** has **completely flipped the weekly structure**, turning a fully **bearish weekly candle into a bullish one 📈** — thanks to the **NFP data** that came in **favor of Gold and against the Dollar 💵❌**.
🔍 However, price is now approaching a **critical confluence zone**:
* 🧭 A **long-running trendline** (since April)
* 🔴 An **H4 Bearish Order Block**
* 📐 The **Fibonacci Golden Zone (0.50–0.618)** at **3362–3372**
📌 **From this level, we have two possible scenarios:**
1️⃣ **Sharp Rejection 🔻:**
Price may **reverse sharply** from the 3362–3372 zone and **resume the bearish trend**.
2️⃣ **Breakout & Trap Theory 🔺:**
If price **sustains above this zone**, it may signal that the recent **3–4 day drop was a fake breakdown**, designed to **trap sellers** and grab liquidity for a **further upside move**.
✅ **Confirmation will come if we get an H4–H6 bullish candle close above the trendline** and back inside the **buying zone of 3375–3390**.
🔓 **A breakout above the triangle pattern** will likely lead to a **strong bullish continuation 📈🚀**.