Ethereum Bull TrapThe Ethereum bull trap: Is it a breakout or fakeout? Iinstitutional and retail trends show something strange is cooking
www.cointrust.com
Harmonic Patterns

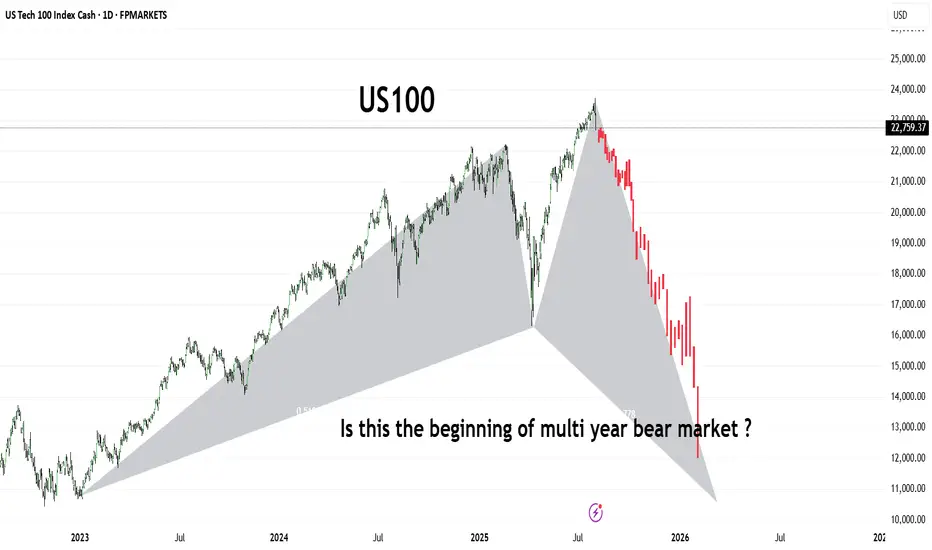
US100The US100 (Nasdaq 100) has shown a dramatic shift in trend, forming what appears to be a large-scale bearish harmonic pattern or potential M-top structure. After reaching its peak in mid-2025, the index has entered a sharp downward trajectory, shedding significant value in a short span.
This chart raises a critical question for long-term investors and traders:
Are we witnessing the early phase of a prolonged bear market that could stretch into 2026 and beyond?
🔻 Key Observations:
Bearish structure developing with aggressive selling pressure.
Potential breakdown from long-term support trendlines.
Momentum suggests institutional risk-off behavior.
Stay alert for macroeconomic cues, interest rate policy, and earnings season signals. A break below 13,000 could confirm a deeper bear cycle
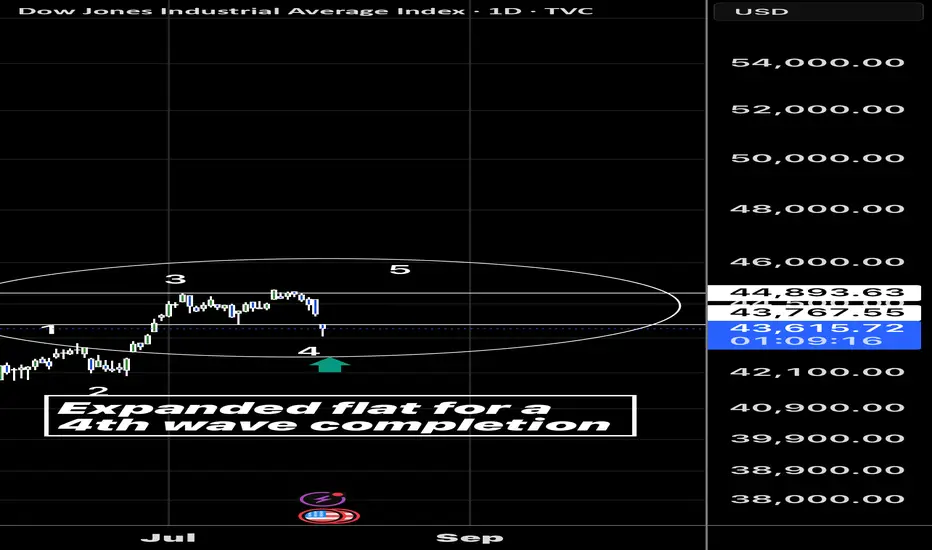
Expanded flat on the Dow for 4th wave completion? If it is we can see some new highs… a close back above 43760 today would set it up
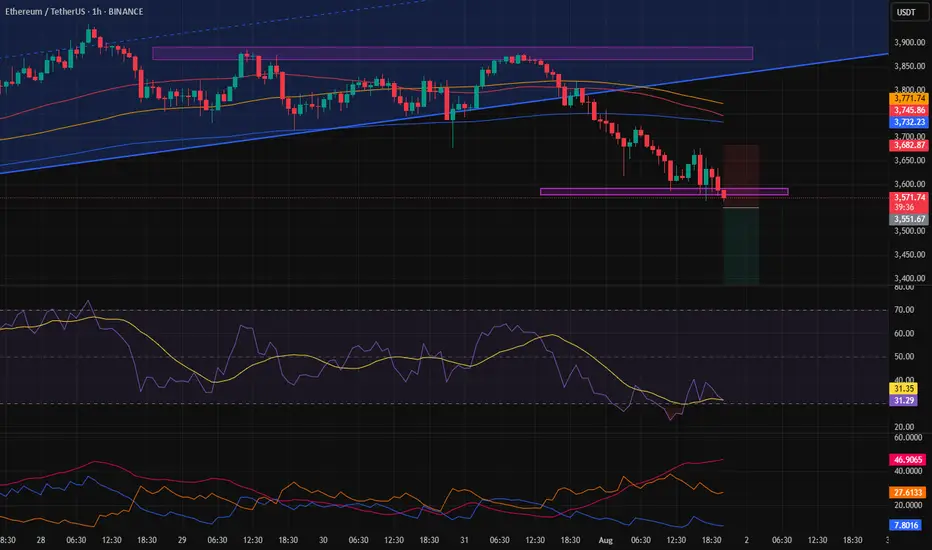
Ethereum - The moment of truth!🔬Ethereum ( CRYPTO:ETHUSD ) trades at a key breakout level:
🔎Analysis summary:
Ethereum - after consolidating for the past four years - is once again retesting the previous all time high. And before we will witness another bearish rejection, Ethereum has the chance to finally break out of the long term triangle pattern. It's time for us to start praying.
📝Levels to watch:
$4.000
SwingTraderPhil
SwingTrading.Simplified. | Investing.Simplified. | #LONGTERMVISION

Xrp - This is the bullrun breakout!🔑Xrp ( CRYPTO:XRPUSD ) breaks the triangle now:
🔎Analysis summary:
After the recent bullish break and retest, Xrp managed to already rally another +100%. This is a clear indication that bulls are still totally in control of cryptos and especially Xrp. It all just comes down to the all time breakout, which will then lead to a final parabolic rally.
📝Levels to watch:
$3.0
SwingTraderPhil
SwingTrading.Simplified. | Investing.Simplified. | #LONGTERMVISION

Pattern targetIn the previous analysis, we spotted a head and shoulders pattern and mentioned that if it gets activated, it will hit the pattern target — and that’s exactly what happened.
A clean and beautiful setup.
GOLD OUTLOOKMy view on Gold ..
More likely to retrace to the bearish PRZ from where i'll be looking for Sell setup on the lower time frames

Possibility of Ethereum moving toward the \$3,330 price range.Considering the breakout of the 4-hour channel and confirmation of the downtrend, reaching the \$3,330 level is not out of the question.
This target was derived using a pattern-based projection from the channel breakout.
I’ve personally taken this position, but I’m not recommending it — just sharing for informational purposes.
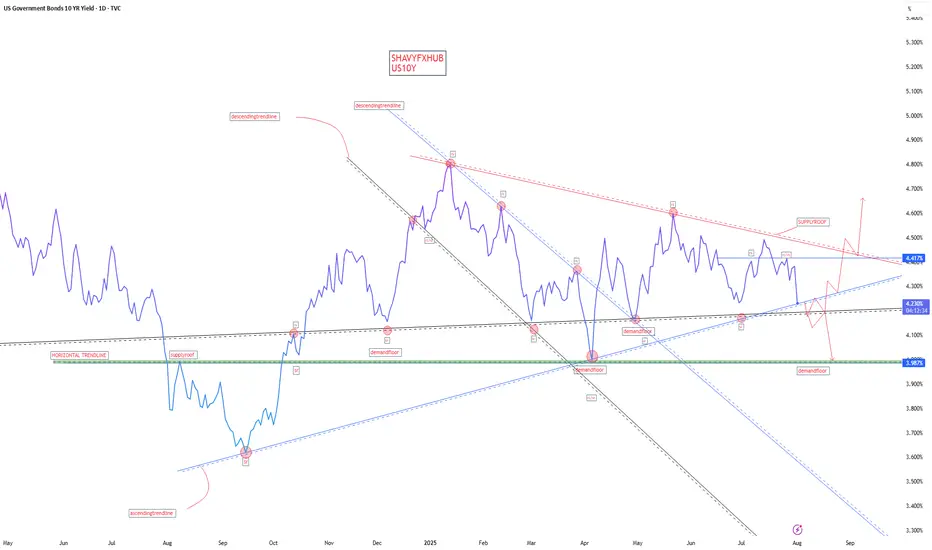
US10Y1. Labor Market Data
Average Hourly Earnings m/m:
Actual: 0.3%
Forecast: 0.3%
Previous: 0.2%
Interpretation: In-line with forecast and slightly above the prior period, indicating stable wage growth. This suggests inflationary pressures from labor costs remain steady, not accelerating unexpectedly.
Non-Farm Employment Change:
Actual: 73,000
Forecast: 106,000
Previous: 14,000
Interpretation: A clear downside surprise; job gains are well below expectations, and while up from a low previous period, this points to softening labor demand—an early sign of slack in the job market.
Unemployment Rate:
Actual: 4.2%
Forecast: 4.2%
Previous: 4.1%
Interpretation: Matches the forecast but marks a slight uptick, reinforcing mild labor market weakness.
Fed View: The Fed will interpret softer than expected job growth and a higher unemployment rate as evidence of easing labor market pressures—a dovish signal that could support future policy easing if the trend continues.
2. Manufacturing and Industry
Final Manufacturing PMI (S&P Global):
Actual: 49.8
Forecast: 49.7
Previous: 49.5
Interpretation: Slightly above forecast but still below the 50 threshold, indicating contraction persists but is less severe.
ISM Manufacturing PMI:
Actual: 48.0
Forecast: 49.5
Previous: 49.0
Interpretation: Below both forecast and prior; contraction in the manufacturing sector is deepening.
ISM Manufacturing Prices:
Actual: 64.8
Forecast: 69.9
Previous: 69.7
Interpretation: Lower than both forecast and previous, signaling input price pressures are easing—positive for the Fed’s inflation outlook.
Fed View: Ongoing contraction in manufacturing and lower input prices support the argument that inflation risks are cooling from the supply side, allowing for a more dovish stance.
3. Consumer and Construction
Revised UoM Consumer Sentiment:
Actual: 61.7
Forecast: 62.0
Previous: 61.8
Interpretation: Slightly below forecast, little change—consumer confidence remains relatively subdued.
Construction Spending m/m:
Actual: -0.4%
Forecast: 0.0%
Previous: -0.4%
Interpretation: Same as previous, misses forecast—ongoing weakness in construction and real estate investment.
Fed View: Weak consumer sentiment and persistent soft construction data reinforce slower demand-side dynamics, an argument in favor of pausing or even cutting rates.
4. Inflation Expectations
Revised UoM Inflation Expectations:
Actual: 4.5%
Forecast: Not directly listed (prior 4.4%)
Interpretation: Ticks up slightly, indicating that consumers expect inflation to remain higher. This could temper the Fed’s willingness to cut rates too soon—if expectations become unanchored, the Fed may have to stay hawkish.
Overall Fed Interpretation
Labor market: Softer than forecast, unemployment up—dovish for rates.
Manufacturing/industry: Slight improvement in PMI, but ISM shows contraction; input prices are easing—dovish.
Consumer/construction: Little improvement, still weak—dovish.
Inflation expectations: Up slightly—potential hawkish caution.
Net result: The data is mostly dovish—except for the higher inflation expectation which remains a concern. The Fed will likely see this data as supporting a “watchful pause” and adopt a more flexible stance: no immediate rate cut, but the case for easing is growing unless inflation expectations keep drifting higher. Sustained weak jobs or further easing in prices would increase the chances of a rate cut in coming months. Elevated inflation expectations will keep the Fed cautious about acting too quickly.
#DOLLAR #US10Y #STOCKS #BONDS #YIELD
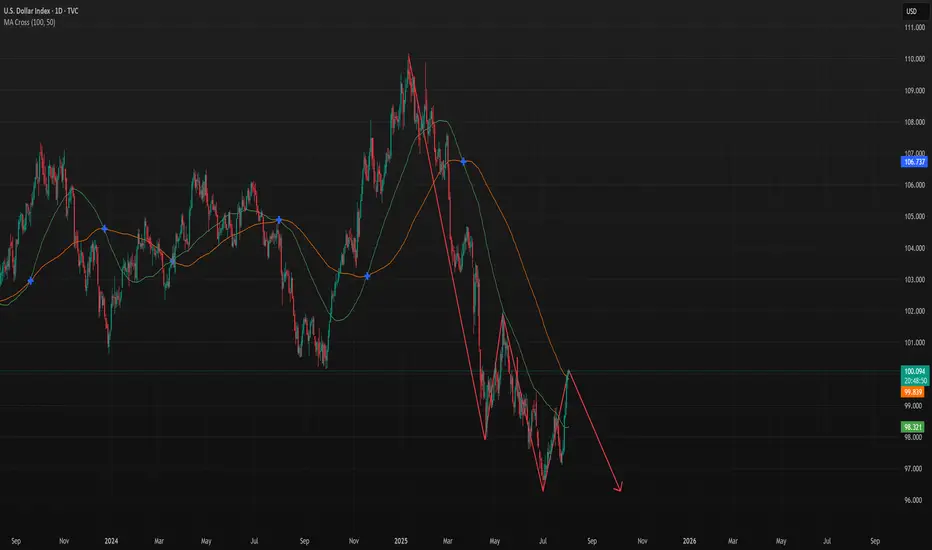
DXY - Possible Down Swing to continue furtherTVC:DXY
CMCMARKETS:USDCAD
OANDA:NZDUSD
CMCMARKETS:EURUSD
We may have a further down swing pattern forming let's continue to see if it passes the resistance area.
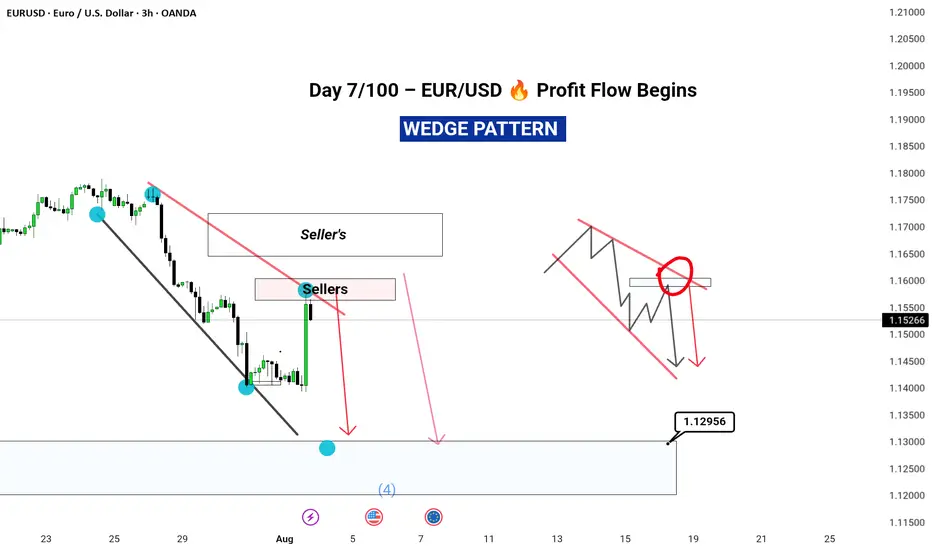
“Exactly What I Saw” promises value and transparency.
In today's analysis, I’ve identified a clear completion of Wave D, securing a 3% ROI across just two trades – all before the move unfolded.
🔍 What’s inside this breakdown?
• Multi-timeframe analysis: Weekly ➝ Daily ➝ 4H ➝ 1H
• Elliott Wave structure with confluence zones
• Trade psychology at key turning points
• Exact entry & exit insights explained
• Risk management for consistent returns
---
⚡ Highlights:
Precise reversal spotted before it was obvious
No indicator clutter – just clean, confident price action
Part of my 100-day breakdown series: real, raw, and repeatable setups
---
👣 Day 7 of 100 is just the beginning.
Tap Follow to stay ahead of the market – one wave at a time.
#EURUSD #ForexAnalysis #ElliottWave #Forex #TradingViewUK #SwingTrading #PriceAction #RiskReward #FXMindset #ForexTradersIndia #ForexEducation
AUDUSD Technical & Order Flow AnalysisOur analysis is based on a multi-timeframe top-down approach and fundamental analysis.
Based on our assessment, the price is expected to return to the monthly level.
DISCLAIMER: This analysis may change at any time without notice and is solely intended to assist traders in making independent investment decisions. Please note that this is a prediction, and I have no obligation to act on it, nor should you.
Please support our analysis with a boost or comment!

TON Bearish DivergenceBINANCE:TONUSDT
Trade Setup:
Target 1: 3.523 (0.786 Fibonnaci Golden Zone).
Target 2: 3.389 (0.618 Fibonnaci Golden Zone).
Target 3: 3.295 (0.786 Fibonnaci Golden Zone).
Target 4: 2.897 (0 Fibonnaci).
Stop Loss: 3.910 (1.272 Fibonnaci).
RSI Analysis: The RSI is showing a bullish divergence, suggesting potential bullish momentum. The current RSI is around 75.44, approaching overbuy territory, so caution is advised.

xauusd sellsell xauusd
XAUUSD
idea order block active with high volume here
and it back to test it
OANDA:XAUUSD

HBARSimiliar scenario to BYBIT:BTCUSDT.P just have to wait for the daily close.
I marked out a potential entry are with the red line, which is a 4H order block which COULD be tapped
Again I will update you on my entry ASAP
Do not forget to follow and like, it helps me alot.
Stay blessed

BTC CLS RANGEWaiting for the daily candle to close inside of the range as seen on the graph with the horizontal line.
Then I will be immediatly looking for an entry, either a FVG or a OB or an IFVG. (I will update the entry points asap)
Then I will target 50% of the range as seen on the graph market 0 .5 on the fibonacci retracement where I will take 75% of the position.
Then I will set my SL at my entry price and target the opposing range or LQ which is at 119500-120000K

Trend decision after the newsAfter the news, the price nearly reached the bottom of the higher time frame channel and paused. We need to see whether the price can break into the channel or not. Personally, I don’t think that will happen. I believe a range will form within the marked zone, and then the price will drop further.
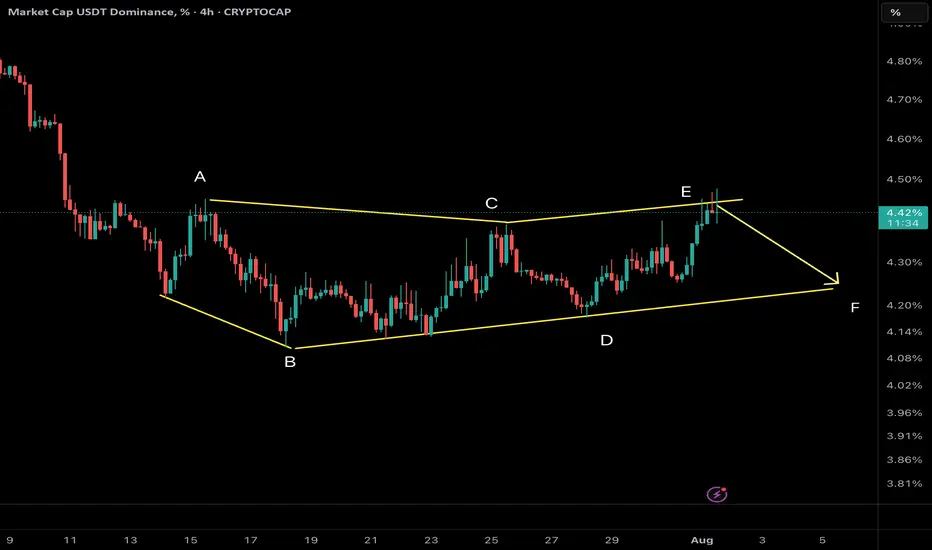
USDT Dominance – Potential Wave F Reversal?
We are tracking a NeoWave Diametric formation (7-leg corrective structure: A–B–C–D–E–F–G) on the USDT Dominance chart. Recently, price reached the projected resistance zone of wave E, and early signs of reversal are emerging.
⸻
🧠 Structural Analysis:
• The structure has developed with alternating legs in price and time, consistent with the symmetrical diametric rules.
• Wave E has likely completed, reacting from prior supply and resistance.
• A pullback from here can mark the beginning of Wave F, which in diametrics tends to retrace significantly toward the internal balance of the structure.
⸻
🔍 What to Watch:
• Confirmation of bearish intent via a break of internal supports or lower-timeframe BOS.
• Possible retracement targets: 4.2% → 3.95%, depending on momentum.
• A decisive break below 4.00% would reinforce the wave F scenario.
⸻
⚠️ Implications for the Crypto Market:
A drop in USDT Dominance typically indicates rotation into risk assets (alts/BTC/ETH). However, context matters — if the drop happens during a general market sell-off, it may reflect risk-off unwinding into fiat, not risk-on rotation.
⸻
🔄 Strategy Note:
• Avoid premature shorts or longs; wait for structure to confirm.
• Watch for smart money traps (e.g., false breakouts or liquidity grabs) around the recent highs.
⸻
📌 This is a high-risk zone for entering long USDT.D — be cautious with stablecoin bias.
📊 Analysis by CryptoPilot – Precision through structure.
Gold Approaches Key Reversal Zone After Liquidity Sweep.Gold has recently broken out of a parallel channel during the New York session, followed by a strong upward move triggered by the NFP (Non-Farm Payroll) news event. Currently, the market is trading near a key trendline resistance zone. In this area, the price has also swept the liquidity residing above recent highs, indicating that potential buy-side liquidity has been taken out.
This level now becomes critical for observation. If the market forms a Market Structure Shift (MSS) or provides any valid bearish confirmation — such as a strong rejection candle, bearish engulfing, or a break of lower timeframe support — then there is a high probability that a downward move may follow from this zone.
As always, conduct your own research (DYOR) and wait for price action to confirm the bias before executing any trades. Acting on confirmation rather than assumptions protects both capital and strategy.

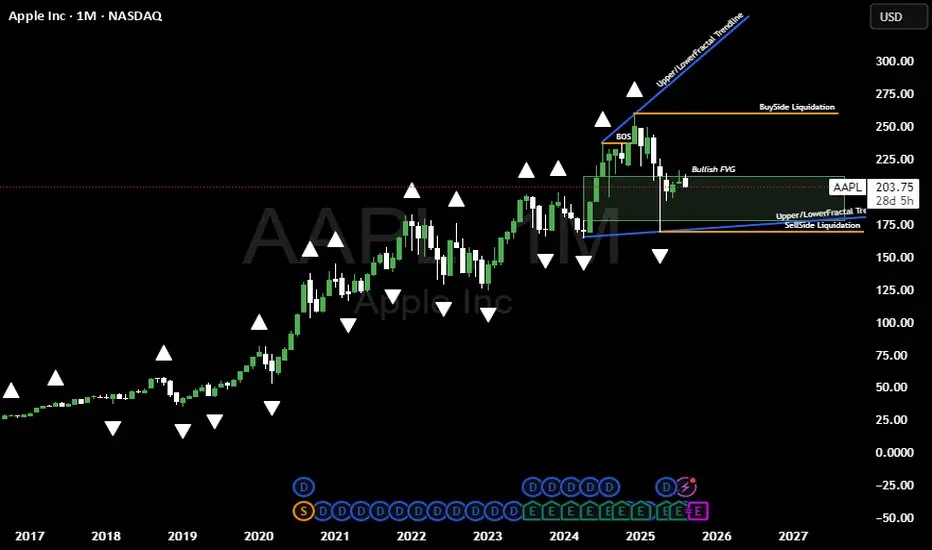
Bullish Idea on APPLNASDAQ:AAPL / Lovley day its been a while, am planing to share my views on the markets atleast once a week from now going forward. Basically on this bias idea above here @LutthMage we are leaning more on long term holding, WITH AN ADVANTAGE OF TAKING SHORT TERM TRADES BASED ON OUR LONG TERM INVESTMENT IDEA WE ARE SURE YOU WILL UNDERSTAND AS TIME GOES BY.
NOW LET THE GAMES BEGIN```
On the chart above we a basically bullish due to 4 reasons
1. The trend is our friend its currently bullish, because AAPL is BREAKING STRUCTURE NO VISIBLE Change of character as of yet
2. We got a widening channel currenly bouncing of the lower level line of the channel.
3. Price is playing around a Bullish FVG
4. APPLE JUST CREATED SELL SIDE LIQUIDITY.
We will keep you posted on the short term trades we execute based on this bullish bias on APPL, ofcourse only if they do appear for now we sit and do the hardest thing to do wich is NOTHING.
AS TIME GOES BY YOU WILL CHARACTERIZE A WASH RINSE AND REPEAT PROCESS FROM US @LutthMage NASDAQ:AAPL
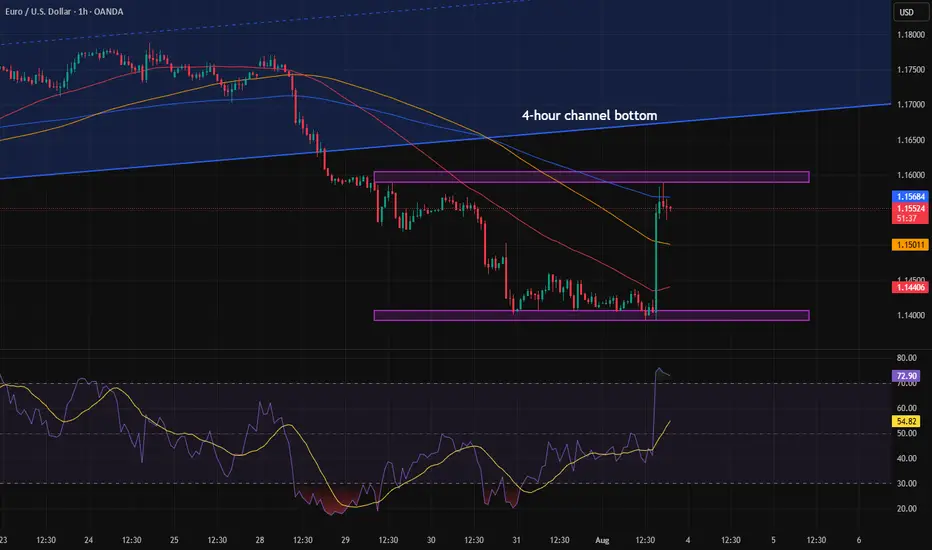
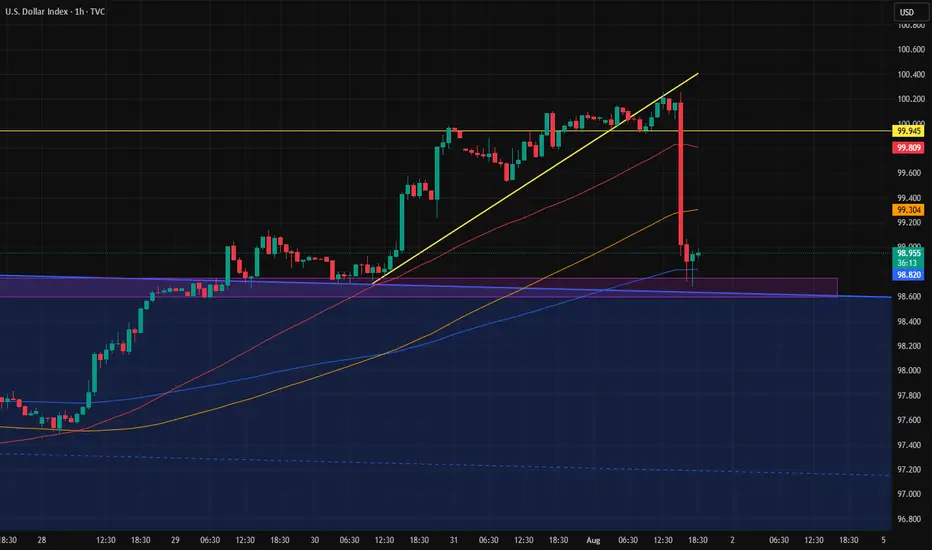
The strength of the PMI reportWe all saw how a large and strong candle formed right after the news, hitting the top of the previous channel.
So now that channel top zone has proven to be valid.
Now we have to see whether this candle leads to another drop in the dollar, or if the dollar recovers and slowly starts moving back toward 100.
Gold Price Target: 3380-3400+, Set a Trailing StopGold Price Target: 3380-3400+, Set a Trailing Stop
As shown in Figure 4h:
Gold finally rallied this weekend.
Despite recent heavy losses for long positions, the past two days have been encouraging.
We ultimately managed to successfully buy the dip in the 3280-3300 range and recover all our losses.
Gold prices continue to rise, and everyone is asking if it's time to sell.
Now is the critical time to exit.
We must acknowledge one fact:
Gold currently presents a huge opportunity.
Of course, the risks are also increasing.
At times like these, I always emphasize that the best approach is to set a 10-point trailing stop.
Even if gold prices soar, we can move with them.
This non-farm payroll data was a huge disappointment.
It was a truly positive surprise for gold.
The market expected 110,000 new jobs, but the result was a disappointing 73,000, a decrease of half from the previous month.
The market went into a tizzy after the outperformance. But even more shocking news is yet to come: Non-farm payrolls for May and June were revised downward by a combined 258,000.
This means the June gain was revised downward from 140,000 to 14,000.
The May gain was abruptly revised downward from 140,000 to 19,000.
The strong data of the past two months was completely false.
Market followers have become the "clowns" of the Fed and Trump.
Now you understand why everyone praised Powell's hawkish speech two days ago.
Because Powell said: "Only if there is a severe decline in employment will we consider cutting interest rates."
Just this Wednesday, some good non-farm payroll data was released.
This undoubtedly gave the market a false impression.
Everyone believed that a rate cut was impossible, and the probability of a September cut had dropped to 40%.
However, today's poor non-farm payroll data, combined with revisions to May and June data, revealed the truth.
The job market has been dismal over the past quarter.
The market reacted quickly, and gold prices soared on this sentiment.
My advice is to buy gold at a low price and hold on.
For investors who have successfully bought in the 3280-3300 level in recent days, I recommend setting a 10-15 pip trailing stop-loss.
Gold prices are likely to continue their upward trend next Monday.
Our next target is above 3380-3400 points.

Microvision Inc (MVIS).Stock on triggering Explosive Level.
🦈 Shark Harmonic shap Target price above 14$ .
Any breaking up Resistance level 1.21$ , Buying signal triggering, Explosive level = 1.95$
Highly recommended for Buying now 👌
