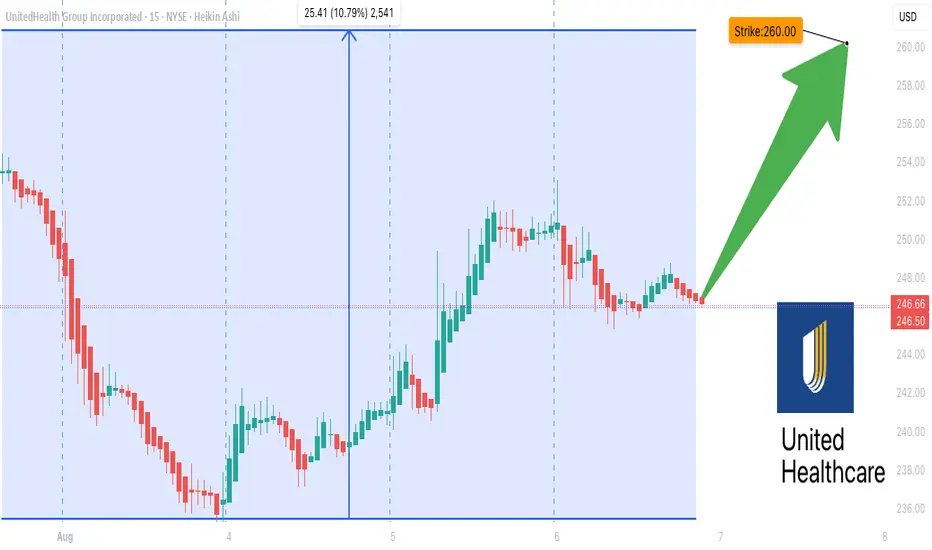
Big Money Is Betting on UNH — Are You In Yet?## 🚀 UNH Weekly Trade Idea: Bullish Momentum Brewing at \$260! 📈💥
UnitedHealth Group (\ NYSE:UNH ) is flashing bullish signals across the board:
📊 **Call/Put Ratio: 3.12** → Heavy institutional bullish flow
📈 **Daily & Weekly RSI: Rising**
💰 **Volume Increasing** → Accumulation Mode?
⚠️ **Gamma Risk HIGH** → Perfect storm for explosive moves!
---
### 🔥 Trade Setup:
🟢 **Buy 260 Call** (Exp: 08/08)
💵 Entry: \$0.69
🎯 Profit Target: \$1.03 – \$1.38
🛑 Stop Loss: \$0.34
📈 Confidence: 65%
All models aligned on this: **Bullish Bounce Likely**
Range of strikes (\$255–\$260) show heavy interest = 🚨 breakout setup
💡 **Risk Management:** High gamma = fast moves. Lock profits or cut quick. Stay nimble!
---
### 📌 Suggested Hashtags/Tags:
```
#UNH #OptionsTrading #CallOptions #BullishSetup #RSI #GammaRisk #WeeklyTrade #StockSignals #MomentumPlay #HealthcareStocks
Harmonic Patterns
Bitcoin is heading to the moon!if the wyckoff methodology is applied then this is a re-accumulation phase with a first target in the 150k area followed by a main target in the 260k to 280K zone.
The wyckoff phases identified on the chart are as follows
Phase A:
BC (Buying Climax)
AR (Automatic Reaction)
ST (Secondary Test)
Phase B:
Characterized by volatility and testing within the range.
Phase C:
SC (Selling Climax)
Spring – a final shakeout below support to mislead traders before upward movement.
Phase D:
Clear higher highs and higher lows; sign of strength (SOS) and last point of support (LPS) observed.
Phase E :
Price has broken above the re-accumulation range and rested the trading range which is now acting as support.
As the assets price exits the trading range id expect a strong move to around the 150K area followed by a secondary move to the 260-280k target.

BEARS Coming Up.On a 1D TF, we have a good BAT Pattern from Harmonics strategy, and as well a very clear AB=CD Pattern, from the EW point of view we are having a good FLAT correction.
At the moment we think the market is done with the pullback and we're setting up for a free fall
This is our insight as it stands.
This isn't an investment advice, and employ your strategies and principles when deciding to join our views.

XAU/USD 06.08.25XAU/USD: Fresh Bullish Impulse Targeting $3,440 — Entry Point Confirmed
Market Overview:
After a corrective pullback to the EMA 144 and key support near $3,350, gold has confirmed a new bullish leg from point B. The recent rejection from the lows suggests a continuation toward the $3,440 target within the ABCD harmonic structure.
Technical Signals & Formations:
— 1H EMA(144) acted as dynamic support
— Strong bounce from $3,350 support zone
— Price is moving within an ascending channel
— ABCD pattern projects target around $3,440
— Breakout above $3,374 will validate further upside
Key Levels:
Support: $3,350, $3,374
Resistance: $3,440 (D1)
Scenario:
Primary: Bullish continuation to $3,440
Alternative: Short-term range between $3,360–$3,374 followed by upside breakout

BABA Daily Trade SetupsIn this update we review the recent price action in Alibaba and identify the next high-probability trading opportunity and price objectives to target. To review today's video analysis clcik here!

Gold next move (Read Description). Hello, Traders.
As you see gold has changed its direction after the NFP News. It was in down trend after the NFP News its flying to the my moon.
Gold is just flying and making breakouts of resistance areas. In my view gold wants to fly and it wants to hit buy side liquidity and then we can see the waterfall.
Gold can continue the trend and if price pullbacks it can touch the area 3365 - 3353 and then can fly.
Don’t trade against the trend, analyse the market before opening the trades.

Could the price bounce from here?EUR/CAD has bounced off the pivot which is a pullback support, and could rise to the 1st resistanc,e which is a multi-swing high.
Pivot: 1.58922
1st Support: 1.57671
1st Resistance: 1.61066
Risk Warning:
Trading Forex and CFDs carries a high level of risk to your capital and you should only trade with money you can afford to lose. Trading Forex and CFDs may not be suitable for all investors, so please ensure that you fully understand the risks involved and seek independent advice if necessary.
Disclaimer:
The above opinions given constitute general market commentary, and do not constitute the opinion or advice of IC Markets or any form of personal or investment advice.
Any opinions, news, research, analyses, prices, other information, or links to third-party sites contained on this website are provided on an "as-is" basis, are intended only to be informative, is not an advice nor a recommendation, nor research, or a record of our trading prices, or an offer of, or solicitation for a transaction in any financial instrument and thus should not be treated as such. The information provided does not involve any specific investment objectives, financial situation and needs of any specific person who may receive it. Please be aware, that past performance is not a reliable indicator of future performance and/or results. Past Performance or Forward-looking scenarios based upon the reasonable beliefs of the third-party provider are not a guarantee of future performance. Actual results may differ materially from those anticipated in forward-looking or past performance statements. IC Markets makes no representation or warranty and assumes no liability as to the accuracy or completeness of the information provided, nor any loss arising from any investment based on a recommendation, forecast or any information supplied by any third-party.

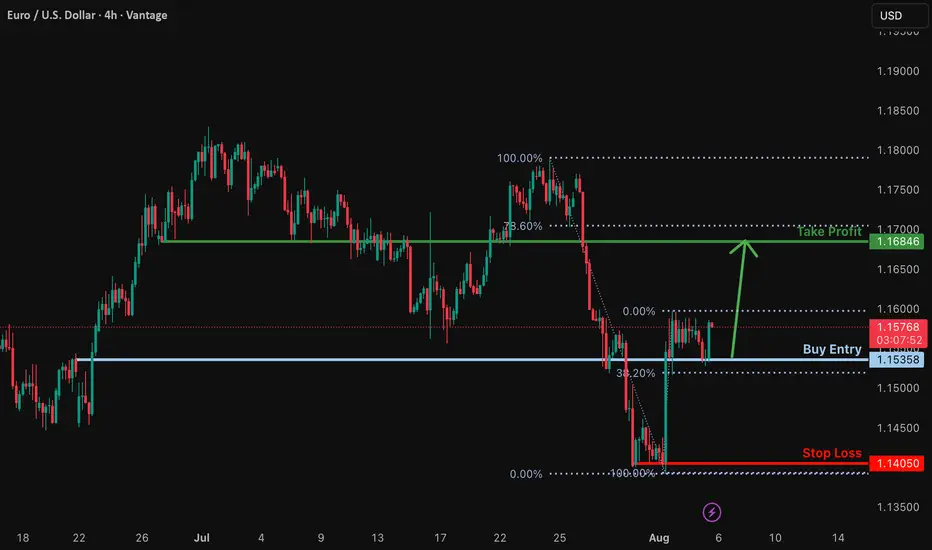
Bullish rise?EUR/USD has bounced off the support level, which is a pullback support that is slightly above the 38.2% Fibonacci retracement, and could rise from this level to our take profit.
Entry: 1.1535
Why we like it:
There is a pullback support that is slightly above the 38.2% Fibonacci retracement.
Stop loss: 1.1405
Why we like it:
There is a swing low support.
Take profit: 1.1684
Why we like it:
There is a pullback resistance that is slightly below the 78.6% Fibonacci retracement.
Enjoying your TradingView experience? Review us!
Please be advised that the information presented on TradingView is provided to Vantage (‘Vantage Global Limited’, ‘we’) by a third-party provider (‘Everest Fortune Group’). Please be reminded that you are solely responsible for the trading decisions on your account. There is a very high degree of risk involved in trading. Any information and/or content is intended entirely for research, educational and informational purposes only and does not constitute investment or consultation advice or investment strategy. The information is not tailored to the investment needs of any specific person and therefore does not involve a consideration of any of the investment objectives, financial situation or needs of any viewer that may receive it. Kindly also note that past performance is not a reliable indicator of future results. Actual results may differ materially from those anticipated in forward-looking or past performance statements. We assume no liability as to the accuracy or completeness of any of the information and/or content provided herein and the Company cannot be held responsible for any omission, mistake nor for any loss or damage including without limitation to any loss of profit which may arise from reliance on any information supplied by Everest Fortune Group.
XAUUSD BUY IDEA • Clear POI Identified:
Price is approaching a well-defined Point of Interest (POI) around 3,347–3,355. This zone aligns with prior demand and a potential entry point for institutions.
• Short-Term Weakness → Potential Reversal:
The market structure shows a retracement phase after a strong bullish impulse. The retrace is likely targeting discount levels within the POI.
• 50 EMA Confluence:
The 50 EMA (gray line) is rising and converging toward the POI, adding confluence for bullish continuation.
• Anticipated Reaction:
Expectation is for price to tap the POI, form an intraday reversal pattern, then continue upward toward higher liquidity zones.
⸻
🧠 Smart Money Perspective:
• Accumulation → Expansion:
Price may currently be accumulating orders before the next expansion leg.
• Low-Risk Entry Zone:
The POI offers a potential low-risk buy zone with stop-loss below the 3,347 region.

Potential bearish drop?S&P500 is rising towards the pivot, which is a pullback resistance that aligns with the 61.8% Fibonacci retracement and could drop to the 1st support.
Pivot: 6,362.20
1st Support: 6,214.78
1st Resistance: 6,436.72
Risk Warning:
Trading Forex and CFDs carries a high level of risk to your capital and you should only trade with money you can afford to lose. Trading Forex and CFDs may not be suitable for all investors, so please ensure that you fully understand the risks involved and seek independent advice if necessary.
Disclaimer:
The above opinions given constitute general market commentary, and do not constitute the opinion or advice of IC Markets or any form of personal or investment advice.
Any opinions, news, research, analyses, prices, other information, or links to third-party sites contained on this website are provided on an "as-is" basis, are intended only to be informative, is not an advice nor a recommendation, nor research, or a record of our trading prices, or an offer of, or solicitation for a transaction in any financial instrument and thus should not be treated as such. The information provided does not involve any specific investment objectives, financial situation and needs of any specific person who may receive it. Please be aware, that past performance is not a reliable indicator of future performance and/or results. Past Performance or Forward-looking scenarios based upon the reasonable beliefs of the third-party provider are not a guarantee of future performance. Actual results may differ materially from those anticipated in forward-looking or past performance statements. IC Markets makes no representation or warranty and assumes no liability as to the accuracy or completeness of the information provided, nor any loss arising from any investment based on a recommendation, forecast or any information supplied by any third-party.

Sell gbpusd Still remain bearish continuation
Trend buy already broken , lower low also broken
Respecting down trend structure

Major U.S. News Ahead—Will EURUSD Pivot?Good morning, my friends 👋
Here’s my EURUSD market analysis 📉
Currently, the pair is in a downtrend. I expect this downward move to end around 1.14899 or 1.14536, where a potential buying opportunity may emerge. I personally plan to enter a buy position once price reaches those zones 💼
Also, keep an eye on major U.S. economic reports being released today—they could trigger increased volatility 🔔
Every like you send is a huge source of motivation for me to keep sharing high-quality analysis 🙏 Thanks to everyone supporting the channel 💙

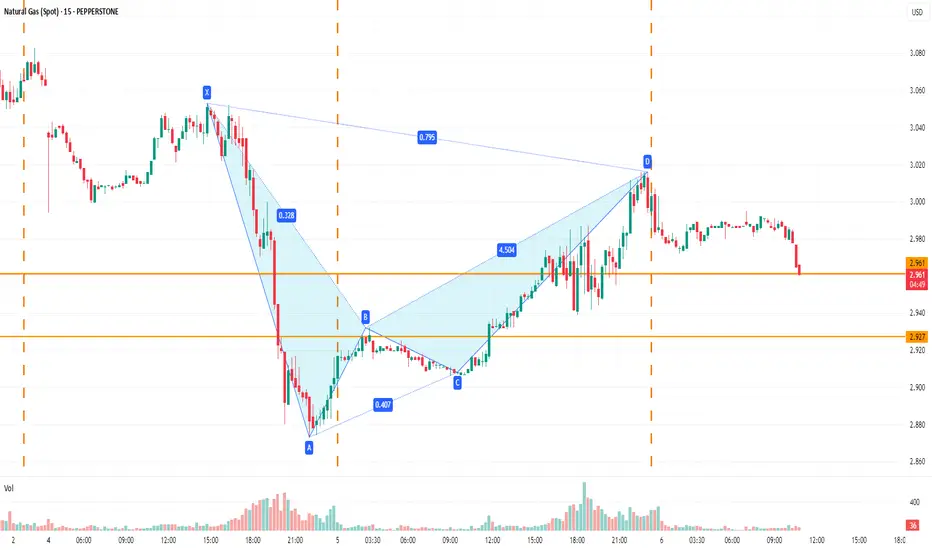
Natural GasBearish bat pattern formed though first target achieved not able to post on time when detected but still there is room and also wave B may be folding and moving for wave C new low possible but time wise still one up may come but that possibly be selling opportunity.
Which altcoin hits the $50 club first? $INJ or $DOT? Which altcoin hits the $50 club first? CRYPTOCAP:INJ or CRYPTOCAP:DOT ? 🚀
3W HTF Technical Breakdown:
1⃣ CRYPTOCAP:INJ (@injective )
✔ Reclaimed structure above $13.31
✔ Targeting $31 → $52.98
✔ Clean 385% R:R setup
⚠ Invalidation below $8.79
2⃣ CRYPTOCAP:DOT (@Polkadot )
✔ Bounced from multi-year TL + demand zone
✔ Hold above $3: Targets $16.67 → $24.37 → $55
✔ Monster 1,660% setup loading
Both charts are screaming high-conviction breakout.
The $50 race is on…
NFA & DYOR

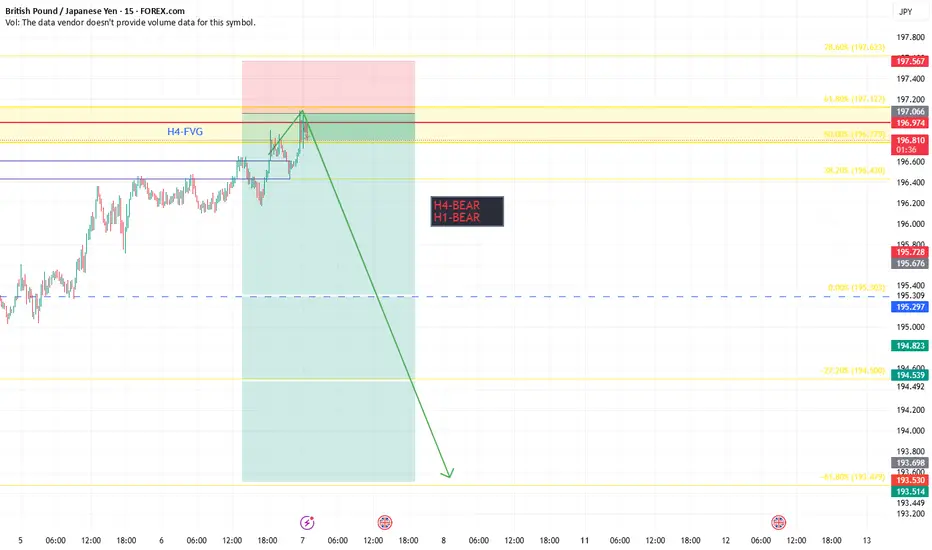
GBP JPY SELL SETUPSee the chart for GBP JPY. came at the zone and expecting a sell continuation ..see the targets (tp-1 & tp2) trade this as swing.. do comment Ur feedback if u like my charting and analysis.
if you are interested to join my personal mentorship group which is i planning to expand ..then please join . i will assist you with more trade setups and real trade information.
message me to @thanz_123
GALAUSDTPhase 1: Breakout from FVG
• Break above the major FVG zone at $0.028–0.030 is crucial.
• A successful breakout and retest could trigger momentum.
• This marks the beginning of a structural shift.
⸻
Phase 2: Structural Resistance
• Key levels to test:
• $0.0345 – historical local top.
• $0.038 – key supply zone.
• Market may consolidate or form a bullish flag before the next move.
⸻
Phase 3: Mid-run Rally
• Break above $0.038 opens the way toward:
• $0.042 – $0.045 resistance block.
• Expect light pullbacks along the way.
⸻
Phase 4: Acceleration Phase
• Once above $0.045, momentum strengthens.
• Eyes on:
• $0.052
• Followed by $0.058 – $0.060 – a strong psychological and structural zone.
⸻
Phase 5: Push to $0.08
• If price closes confidently above $0.060:
• We could see a run to $0.067 – $0.070
• Then : $0.078 – $0.080
Follow me 😉

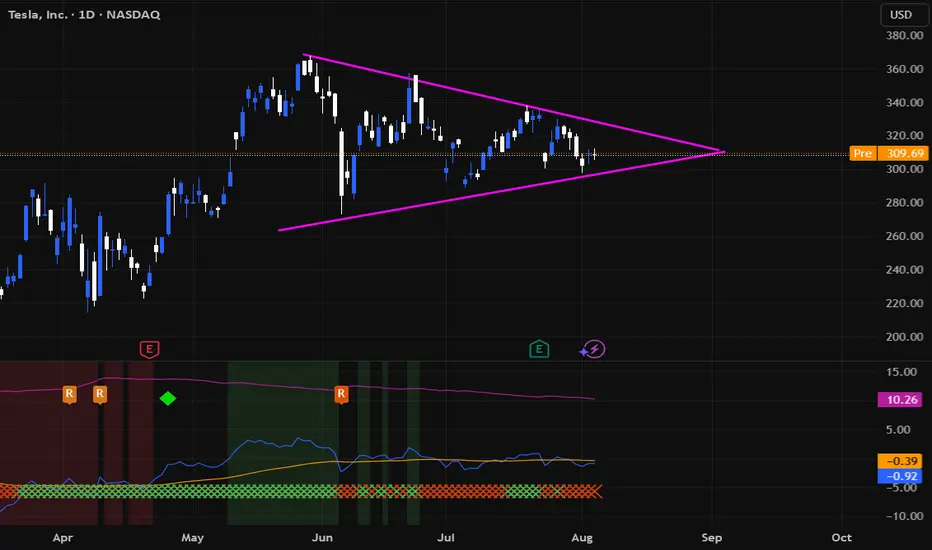
Leave your comment about TESLATesla is in a flag pattern on the daily time frame and I think there is fire under the ashes! Breaking the upper side of the triangle is good news for its holders.
XAUUSD INTRADAY ANALYSIS – AUGUST 6, 2025Gold OANDA:XAUUSD is currently consolidating around the 3,371 zone after breaking above a descending trendline formed from late July highs. A strong bullish impulse on August 2nd with significant volume suggests renewed buying pressure. Price is now retesting the breakout area — a critical moment to determine if the bullish continuation is sustainable.
- Technical Breakdown:
1. Price Structure & Trendline:
The former resistance at Peak 1 (3,376) is now acting as new support.
A new ascending channel has formed following the breakout.
Price structure is showing higher highs and higher lows, indicating short-term bullish momentum.
2. Fibonacci & EMA:
The Fibonacci retracement of the recent bullish wave (Aug 1–5) aligns the 0.382 and 0.5 zones with strong support around 3,365 – 3,352.
Price is hovering near the EMA20, and a close above this level will further confirm upside potential.
3. RSI Indicator:
RSI is stabilizing around 50–55, reflecting neutral momentum with room for bullish continuation.
- Key Price Levels:
3,352 – 3,365: Major Support (Fib + EMA + previous lows)
3,376 – 3,380: Immediate Support (breakout retest area)
3,390: Minor Resistance
3,438: Bullish Target (Peak 2)
- Suggested Trading Strategy:
Primary Bias: BUY if price holds above 3,365
Entry Zone: Around 3,369–3,372 (retest + trendline confluence)
Stop Loss: Below 3,352
Take Profit: 3,438 (previous peak)
Risk/Reward: ~1:9 (very favorable setup)
- Look for bullish confirmation (e.g., bullish engulfing or pin bar around 3,365–3,370) for a high-probability entry.
- Alternate Scenario:
If price breaks below 3,352 with strong volume, the bullish thesis may be invalidated. In that case, consider short-term short positions targeting 3,320 area.
This chart setup presents a promising trend-continuation opportunity, with technical confluences supporting further upside. As always, wait for clear price action signals before entry and manage risk accordingly.

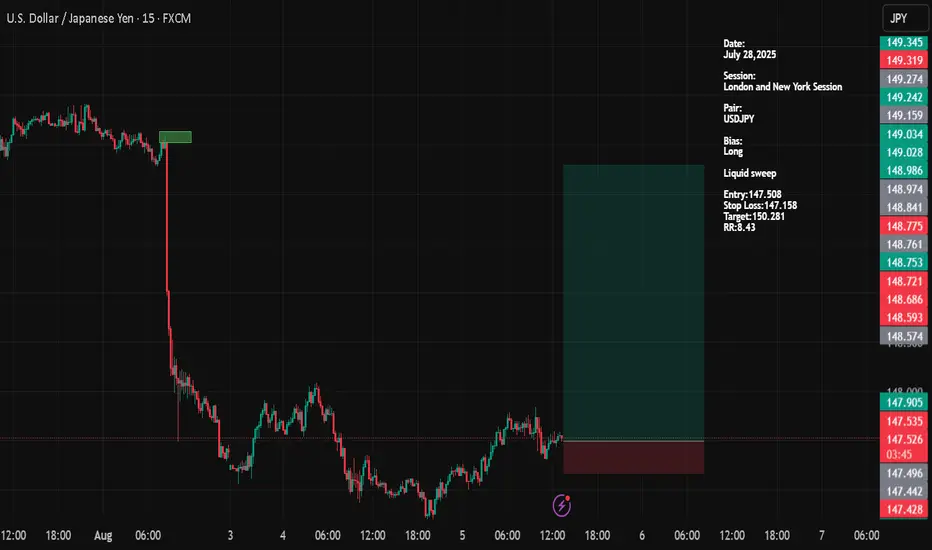
USDJPYDate:
August 05,2025
Session:
New York Session
Pair:
USDJPY
Bias:
Long
Liquid sweep
Entry:147.508
Stop Loss:147.158
Target:150.281
RR:8.43
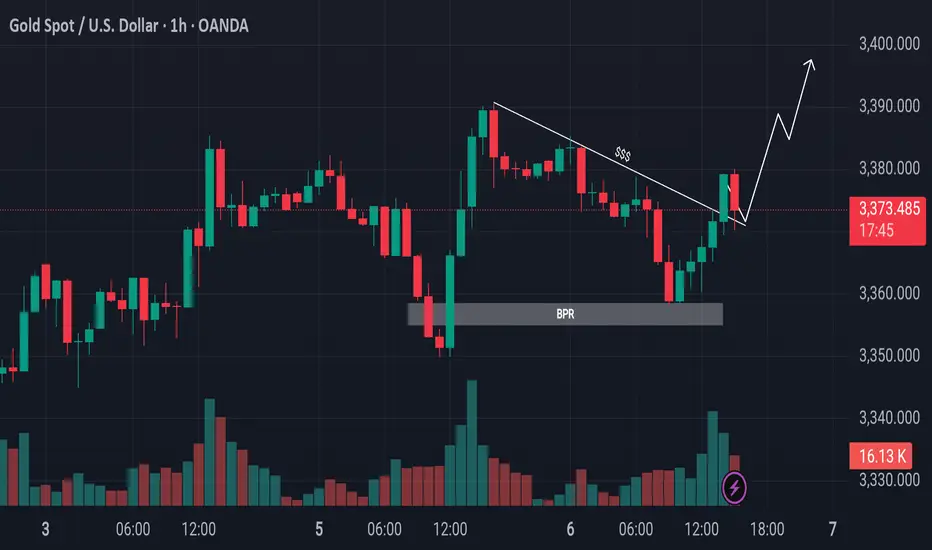
Gold Retraces to OTE and Breaks ResistanceEyes on Swing Highs!Gold Market Update
The gold market declined from its previous bullish leg and retraced below the 50% level, reaching into the Optimal Trade Entry (OTE) zone. It also tapped into a Bullish Price Rejection (BPR) area. Following that, price broke above the trendline resistance. Currently, it is advisable to wait for a potential retest of the breakout level. If confirmed, the market could continue its upward movement toward the previous swing highs.
Do Your Own Research (DYOR)
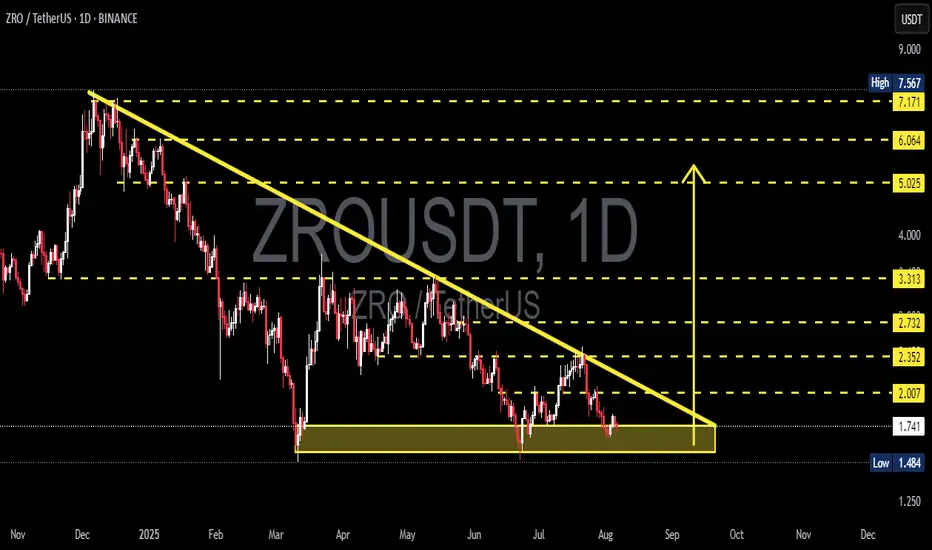
ZRO/USDT Coiled for a Major Move – Breakout or Breakdown?📌 Overview:
The ZRO/USDT pair is currently at a highly critical point. Price action has been consolidating within a large Descending Triangle for several months, and is now coiling near the apex — a classic signal of an incoming major move.
The strong support zone around 1.73 – 1.74 USDT has been tested multiple times and continues to hold, while the long-standing descending trendline from the all-time high acts as key dynamic resistance.
---
📊 Pattern & Market Structure Analysis:
🟡 Pattern: Descending Triangle
Flat horizontal support at ~1.73 USDT has acted as a demand zone.
Consistent lower highs suggest continued selling pressure and market indecision.
While typically a bearish continuation pattern, this setup can also lead to a bullish reversal breakout if resistance is breached with volume.
🧱 Key Support:
The highlighted yellow box shows clear accumulation, where buyers continue to defend the zone.
A breakdown below this support could trigger sharp downside movement and panic selling.
📉 Descending Resistance:
The downward sloping trendline is the critical breakout level.
A strong daily candle close above it would invalidate the bearish structure.
---
🚀 Bullish Scenario (Breakout):
If the price successfully breaks above the descending trendline with volume:
Short-term targets: 2.007 → 2.352 USDT
Mid-term targets: 2.732 → 3.313 USDT
Long-term bullish targets: 5.025 – 6.064 USDT and beyond
Additional confirmations: Volume spike, bullish RSI breakout, daily close above resistance.
---
🔻 Bearish Scenario (Breakdown):
If price fails to hold 1.73 USDT and breaks down:
Initial downside target: 1.484 USDT (historical support)
If that fails, ZRO may enter new low zones below 1.40
Breakdown with high volume would validate a strong bearish trend continuation.
---
🧠 Possible Strategies:
Breakout traders: Entry on daily candle close above descending trendline with volume.
Retest buyers: Wait for breakout, then enter on a successful retest of the trendline as new support.
Short sellers: Look for breakdown below 1.73 zone for short opportunities to 1.48 or lower.
Always use tight stop-loss based on volatility and support/resistance zones.
---
📈 Conclusion:
ZRO is at a make-or-break point. The market is coiling tightly within a Descending Triangle, and a massive move is likely just around the corner. Whether that move is up or down will depend on how price reacts to the descending trendline and the horizontal support.
Traders should stay alert and watch for either a confirmed breakout above the trendline, or a confirmed breakdown below the 1.73 USDT support level. The reaction here will set the tone for ZRO’s next big trend.
#ZRO #ZROUSDT #CryptoBreakout #TechnicalAnalysis #DescendingTriangle #AltcoinSetup #SupportAndResistance #CryptoChart #BreakoutWatch

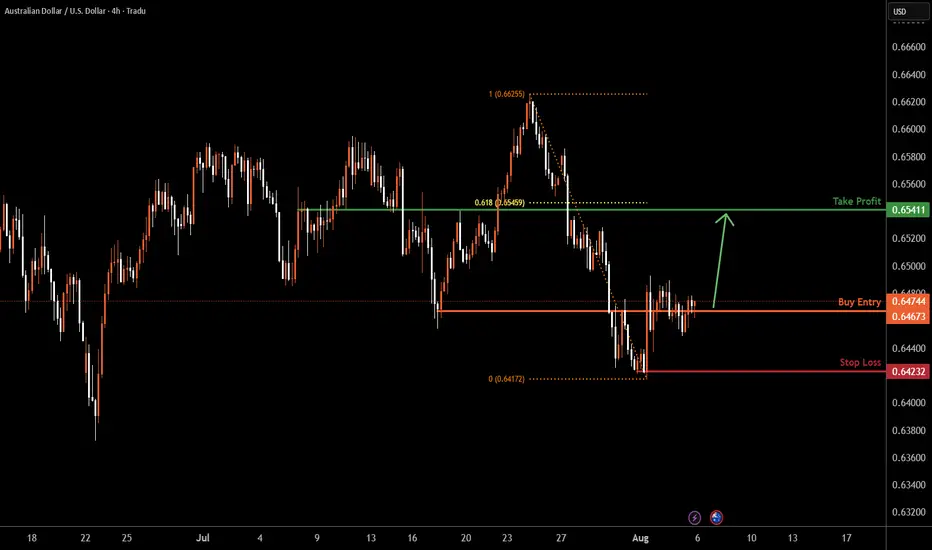
AUDUSD H4 | Could the Aussie reverse from hereAUD/USD is reacting off the buy entry which is a an overlap support and could rise from this level to the upside.
Buy entry is at 0.6472, which is an overlap support.
Stop loss is at 0.6423, which is a swing low support.
Take profit is at 0.6541, which is a pullback resistance that lines up with the 61.8% Fibonacci retracement.
High Risk Investment Warning
Trading Forex/CFDs on margin carries a high level of risk and may not be suitable for all investors. Leverage can work against you.
Stratos Markets Limited (tradu.com ):
CFDs are complex instruments and come with a high risk of losing money rapidly due to leverage. 65% of retail investor accounts lose money when trading CFDs with this provider. You should consider whether you understand how CFDs work and whether you can afford to take the high risk of losing your money.
Stratos Europe Ltd (tradu.com ):
CFDs are complex instruments and come with a high risk of losing money rapidly due to leverage. 66% of retail investor accounts lose money when trading CFDs with this provider. You should consider whether you understand how CFDs work and whether you can afford to take the high risk of losing your money.
Stratos Global LLC (tradu.com ):
Losses can exceed deposits.
Please be advised that the information presented on TradingView is provided to Tradu (‘Company’, ‘we’) by a third-party provider (‘TFA Global Pte Ltd’). Please be reminded that you are solely responsible for the trading decisions on your account. There is a very high degree of risk involved in trading. Any information and/or content is intended entirely for research, educational and informational purposes only and does not constitute investment or consultation advice or investment strategy. The information is not tailored to the investment needs of any specific person and therefore does not involve a consideration of any of the investment objectives, financial situation or needs of any viewer that may receive it. Kindly also note that past performance is not a reliable indicator of future results. Actual results may differ materially from those anticipated in forward-looking or past performance statements. We assume no liability as to the accuracy or completeness of any of the information and/or content provided herein and the Company cannot be held responsible for any omission, mistake nor for any loss or damage including without limitation to any loss of profit which may arise from reliance on any information supplied by TFA Global Pte Ltd.
The speaker(s) is neither an employee, agent nor representative of Tradu and is therefore acting independently. The opinions given are their own, constitute general market commentary, and do not constitute the opinion or advice of Tradu or any form of personal or investment advice. Tradu neither endorses nor guarantees offerings of third-party speakers, nor is Tradu responsible for the content, veracity or opinions of third-party speakers, presenters or participants.