TONUSDT Forming Falling WedgeTONUSDT is forming a classic falling wedge pattern, which is widely recognized in technical analysis as a bullish reversal signal. After a period of consistent downward price compression, the narrowing structure on the chart signals that selling pressure may be weakening. This setup often precedes a significant bullish breakout, especially when accompanied by growing interest and steady volume—as is currently being seen in TON’s market behavior.
The fundamentals behind TON (The Open Network) are also strengthening, with increasing adoption across the Web3 ecosystem and a growing number of partnerships tied to Telegram's user base. The synergy between Telegram and the TON blockchain has created an environment where real-world utility is beginning to align with on-chain momentum. This alignment often catalyzes strong upward price moves, making TONUSDT one of the more promising altcoin setups in the current market landscape.
The expected gain of 140% to 150% from current levels is not just speculative—it aligns well with the technical breakout projection based on the wedge’s height and the last key swing high. If TON can maintain support above the lower boundary of the wedge while volume continues to increase, the likelihood of a breakout followed by a strong upward rally becomes much higher. Historical breakout moves from similar wedge patterns often show explosive growth in relatively short timeframes.
TONUSDT is a high-potential chart right now and should be closely monitored by traders and investors looking for large-cap altcoin opportunities with bullish technical setups. This could be the start of a major trend shift for TON, especially as broader crypto sentiment begins to tilt bullish again.
✅ Show your support by hitting the like button and
✅ Leaving a comment below! (What is You opinion about this Coin)
Your feedback and engagement keep me inspired to share more insightful market analysis with you!
Harmonic Patterns

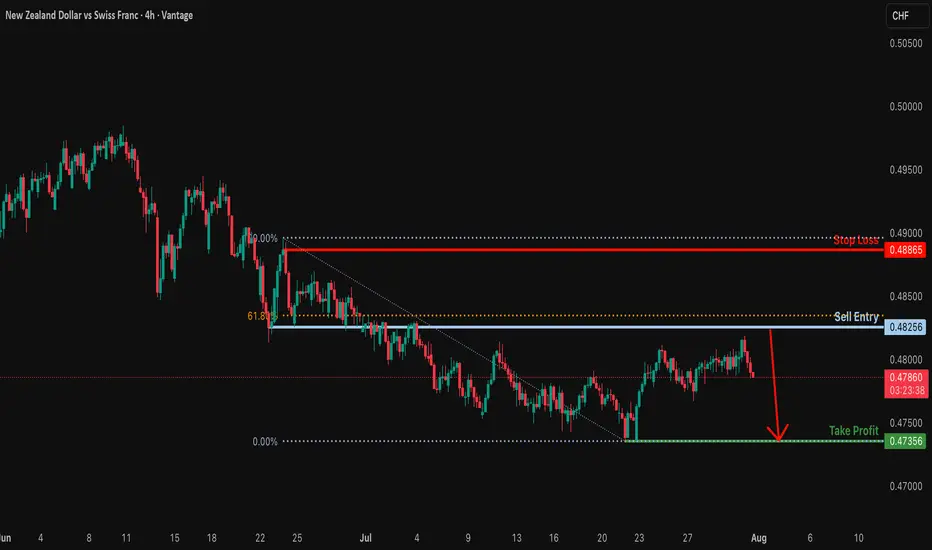
Bearish drop?The NZD/CHF is rising towards the resistance level, which is a pullback resistance that is slightly below the 61.8% Fibonacci retracement. It could drop from this level to our take-profit.
Entry: 0.48256
Why we like it:
There is a pullback resistance that is slightly below the 61.8% Fibonacci retracement.
Stop loss: 0.48865
Why we like it:
There is a pullback resistance.
Take profit: 0.47356
Why we like it:
There is a swing low support.
Enjoying your TradingView experience? Review us!
Please be advised that the information presented on TradingView is provided to Vantage (‘Vantage Global Limited’, ‘we’) by a third-party provider (‘Everest Fortune Group’). Please be reminded that you are solely responsible for the trading decisions on your account. There is a very high degree of risk involved in trading. Any information and/or content is intended entirely for research, educational and informational purposes only and does not constitute investment or consultation advice or investment strategy. The information is not tailored to the investment needs of any specific person and therefore does not involve a consideration of any of the investment objectives, financial situation or needs of any viewer that may receive it. Kindly also note that past performance is not a reliable indicator of future results. Actual results may differ materially from those anticipated in forward-looking or past performance statements. We assume no liability as to the accuracy or completeness of any of the information and/or content provided herein and the Company cannot be held responsible for any omission, mistake nor for any loss or damage including without limitation to any loss of profit which may arise from reliance on any information supplied by Everest Fortune Group.
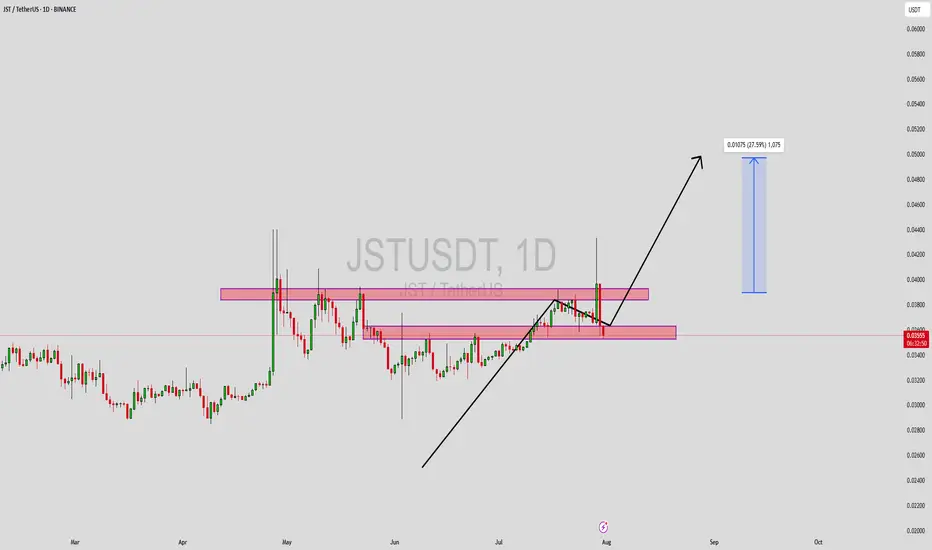
JSTUSDT Forming Bullish MomentumJSTUSDT has recently gained attention among traders as it moves closer to a key breakout level. The chart shows a series of higher lows, indicating underlying bullish momentum despite short-term rejections near resistance zones. The price action reflects a coiling structure with tightening price ranges, hinting at an imminent breakout. Volume has remained consistent, which is often an early sign of accumulation and growing investor interest.
As JSTUSDT continues to test its resistance zone, a successful breakout could lead to a sharp upside move. The projected gain of 20% to 25%+ aligns with the measured move from recent consolidation zones. This movement is supported by market interest in JST, which is a core part of the TRON ecosystem, providing decentralized finance capabilities like stablecoin lending and borrowing. The project’s integration and use within the TRON network continue to attract both retail and institutional investors.
Technically, the price is respecting key support and resistance levels, with clear zones marked out on the chart. The support zone has held strong on multiple tests, making it a potential launchpad for the next leg up. With volume backing the setup, and favorable sentiment across broader market conditions, JST is well-positioned for a breakout rally.
Short-term traders and mid-term investors should keep JSTUSDT on their watchlist, especially as momentum builds near the upper resistance area. If the breakout confirms with a daily close above resistance backed by volume, it may trigger rapid price movement.
✅ Show your support by hitting the like button and
✅ Leaving a comment below! (What is You opinion about this Coin)
Your feedback and engagement keep me inspired to share more insightful market analysis with you!
#GBPUSD ALMAZOV PROJECTION DAILYPrice projection according to Almazov's theory, #GBPUSD should at least touch $1.31500 - before going up, we wait for the initial condition to enter a long position, to reach the Daily Spike f 261.8.

#NIFTY August 1st view#NIFTY August 1 st View : NSE:NIFTY Currently doing wave 3, and around buying zone, lets add up Nifty future and Nse Stocks for fresh high from Aprils low

ens sell midterm"🌟 Welcome to Golden Candle! 🌟
We're a team of 📈 passionate traders 📉 who love sharing our 🔍 technical analysis insights 🔎 with the TradingView community. 🌎
Our goal is to provide 💡 valuable perspectives 💡 on market trends and patterns, but 🚫 please note that our analyses are not intended as buy or sell recommendations. 🚫
Instead, they reflect our own 💭 personal attitudes and thoughts. 💭
Follow along and 📚 learn 📚 from our analyses! 📊💡"

#COPPER #MCX View as on 31st JulyMCX:COPPER1! Copper MCX if it doesnot make one more swing higher then the rally should correct all the way. Alternate is it could be doing a triangle and then make new high.

NZDUSD in bearish trend NZDUSD in bearish trend with bullish RSI diversion and 91% long bias, entry with a Buy stop above the last Lower High RR 1:1

BTC Dominance and Altcoins SituationBitcoin dominance has reached a key support on the daily time frame. The NEW RSI indicator still sees the market as bearish but is pulling back. We will probably not see the growth of major altcoins like Ethereum for a few days. This analysis is not a financial recommendation in any way.

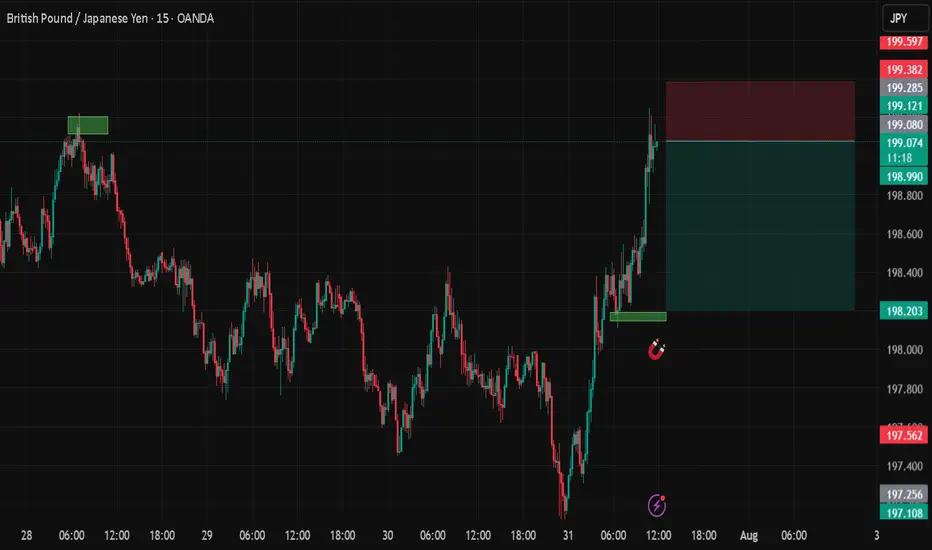
GBPJPYDate:
July 31,2025
Session:
New York Session
Pair:
GBPJPY
Bias:
Long
Liquidity from Monday's London session was swept in today's (Thursday) New York and London Session. Now I see price following the trend downward.
Entry: 199.080
Stop Loss: 199.387
Target: 198.207
RR: 2.90
US DOLLAR BREAKS ABOVE RESISTANCE 98.99 BOTTOM CONFIRMED! Hey Traders so today looking at the US Dollar and as of today there is now a 123 bottom on the charts that has been confirmed by breaking above the 2 point.
Sees like fundamentally the US Dollar has now become bullish so with this breakout now confirmed does this mean we are in the beginning of Bull Market for the USD?
Well no one knows for sure but without any interest rate cuts and lots of tarriffs coming through it seems to be that way. Only time will tell of course if this becomes a new uptrend in USD so now we have a breakout whats next?
The way you trade the 123 bottom is wait for the market to break above the 2 point. Then alot of times there will be a retest of that zone at 98.89
Watch for the retest then consider selling Euro, Pound, Cad, Australian, Gold, Commodities etc...
Against the USD.
If you however you are bearish USD I would wait until market has daily close under 3 point that way you know for sure market has turned.
I will now start to include COT Report in my Analysis so we can see institutional positioning.
Currently Large Specs are Short the USD.
Good Luck & Always use Risk Management!
(Just in we are wrong in our analysis most experts recommend never to risk more than 2% of your account equity on any given trade.)
Hope This Helps Your Trading 😃
Clifford

$ADA about to popCRYPTOCAP:ADA currently sits at strong support. and is technically repeating the exact pattern from previous Bull Runs, this does not guarantee repetition but I extrapolate the phrase, the trend is your friend and feel it applies macro scale.
ETF soon
Crypto laws passed
Leios inbound
Glacier drop inbound
CRYPTOCAP:BTC DEFi Inbound
Interoperability expanding
QE inbound
And CRYPTOCAP:ADA IMO is one of the easiest UI and is also among the most cost effective Blockchains to use on a daily basis.
This Chart is a thesis and I like Crayons.

BTC:LIVE TRADEHello friends🙌
📉Given the decline we had, we now had a good price rebound in the specified support area, which shows the power of buyers. Now, with capital and risk management, we can buy at the specified points in a stepwise manner and move to the specified targets.
🔥Follow us for more signals🔥
*Trade safely with us*

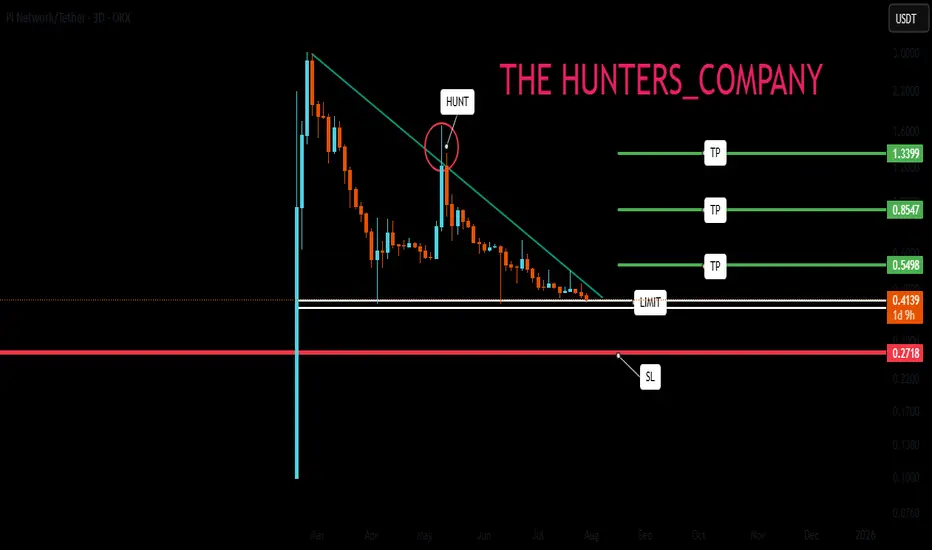
PI NETWORK : Will it finally be pumped?Hello friends🙌
👀According to the decline we had, you can see that the price has reached an important area and has formed a floor in this area. Considering the classic ego that is forming on support, you can enter the trade by breaking the resistance, of course, by managing risk and capital and moving with it to the specified goals.
🔥Follow us for more signals🔥
*Trade safely with us*
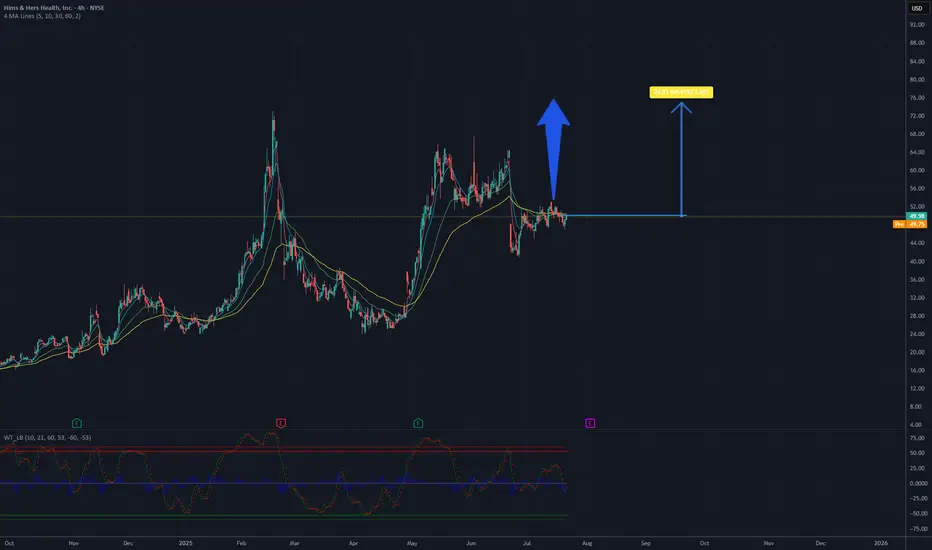
Is it a time for HIMS? Potential 50%,target 75USD.The company has announced plans to introduce comprehensive at-home lab tests, leveraging the acquisition of Trybe Labs, which could enhance service personalization and attract new customers. Additionally, expansion into markets such as Canada and Europe (through the acquisition of Zava) opens new revenue growth opportunities. The company demonstrates continuous financial improvement, including record profitability and a 111% revenue increase since reaching its ATH (All-Time High) in February 2025, which builds investor confidence.
The chart analysis of Hims & Hers Health, Inc. (NYSE: HIMS) indicates a clear upward trend in the recent period. The current price is approximately 49.38 USD. Based on historical data and visible momentum, there is potential for a growth of about 50%, which could bring the price to around 75 USD. Key support is located around 45 USD, while resistance may be tested in the 55-60 USD range before further upward movement. It is recommended to monitor volume and key technical levels to confirm the continuation of the trend.
Potential TP: 75 $
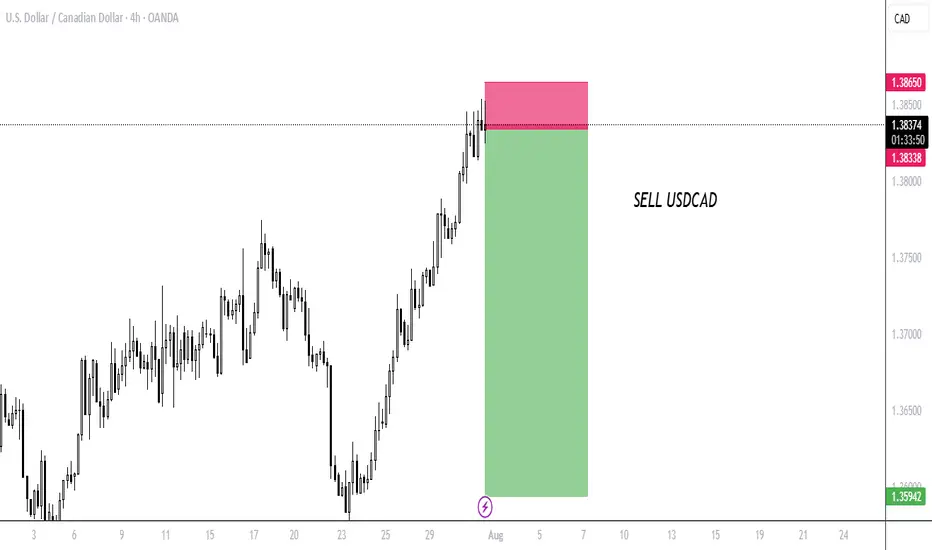
SELL USDCADIf you know familiar with Wyckoff and HS chart patterns ? you should see my reasons for selling USD CAD.Am selling USD CAD
Bitcoin Go 135000Bitcoin has not yet reached the channel ceiling and should bounce back after the resistance.

Bitcoin Go 135kBitcoin has not yet reached the channel ceiling and should bounce back after the resistance.
Bitcoin
Tp1:128000
To2:130000
Tp3:133000
Tp4:135000

BONK : Best of luck to you...Hello friends🙌
👀Considering the decline we had, you can see that the price was supported by buyers and broke the specified resistance. Now, in the price correction, there is a good opportunity to buy with risk and capital management and in steps and be patient until the specified targets are reached.
🔥Follow us for more signals🔥
*Trade safely with us*

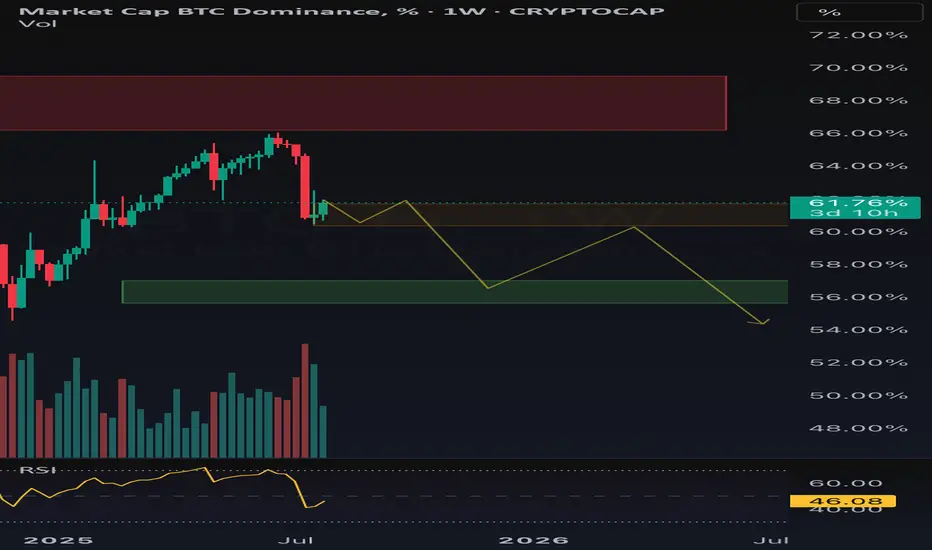
$BTC.D WeeklyConsidering that from the red zone, there has been a strong pullback accompanied by volume, I will continue my projection where these are the weekly targets for CRYPTOCAP:BTC.D
All these points have been calculated using FIB
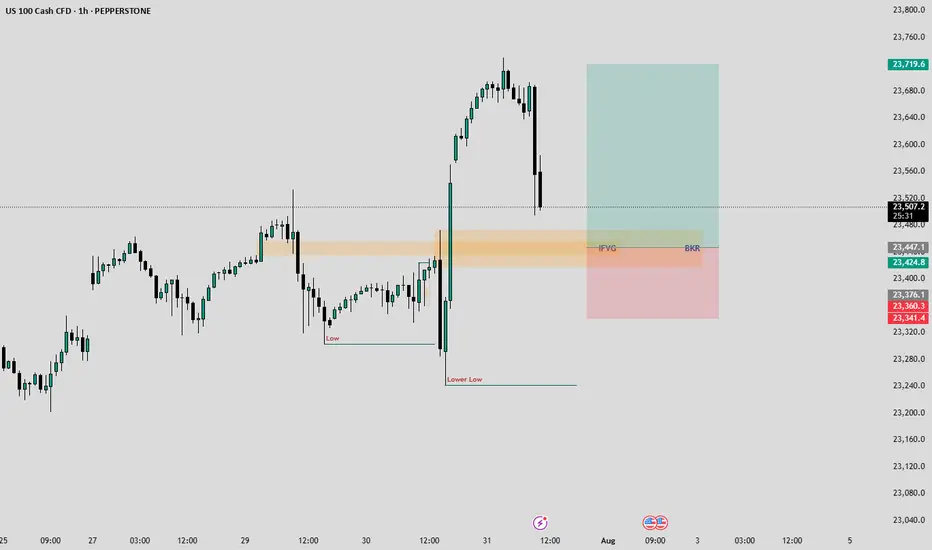
NASDAQ-Lets catch 250 Points togetherHello Fellow Traders,
Nasdaq has been wild since a time now. Today, I have spotted a rade to share with my fellow traders.
Yesterday closed with a good bullish candle. As the NY seesion has begun now, I am anticipating price to retrace to the highlighted breaker block that accurately aligns with an IFVG as well.
I am waiting for the price to fall into my area where I will monitor price's reaction, if we see signs of ejection from the highlighted areas, I wuld love to take a Buy Trade.
Entry= If rice enters the Breaker and IFVG and shows a good rejection.
SL= 23340
TP= Today's highs or 23700.
Manage your risk according toyour capital and only enter the trade if we happen to see a good rejection from the area. Be patient and don't hurry.
XAUUSD
XAUUSD Updated in 15M :
The gold signal is marked on the chart based on the latest price changes and the supply and demand in the market. These points include the entry point, stop loss, and take profit.

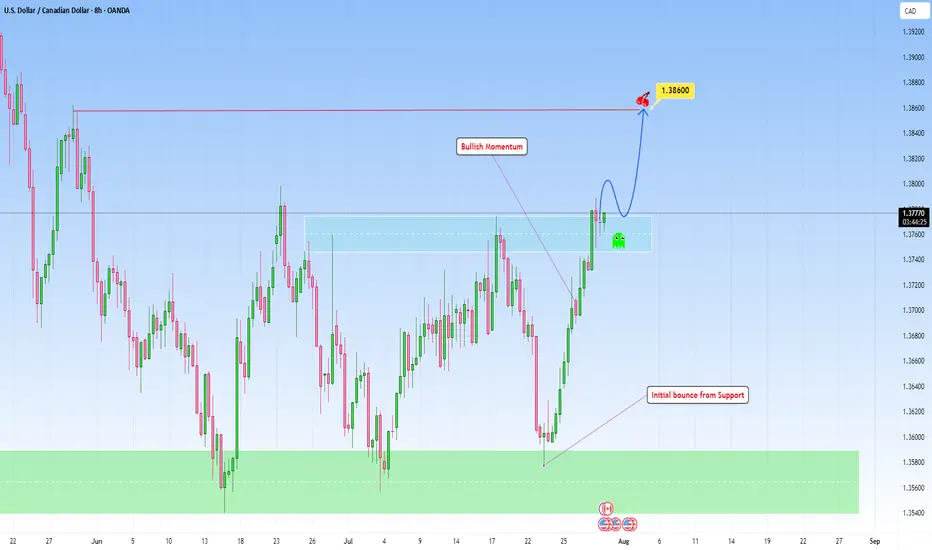
USDCAD bounced from Support and can continue higherLooking at the chart and the overall structure, I think we can favor the continuation setup with a emphasis on price action at key zones, particularly when price breaks out then can revisit this structure for a retest.
This bounce off support has been accomplished in my previous analysis:
Here, if price breaks with strength and dips back into the area and holds with bullish confirmation (likely a wick rejection or bullish engulfing on lower timeframes), that would be the cue to get in.
I am projecting the next target to 1.38600 that makes sense as a logical level for trend continuation and that I find achievable.