SOL 1H – Trendline Break Holds, But Can Bulls Clear 178?olana has finally broken its multi-week descending trendline, with price reclaiming the 50/100 EMA cluster and showing strong momentum. The breakout point aligns with a potential change in market structure, but confirmation will depend on whether buyers defend the retest zone near 168–170.
If the breakout sustains, the next key hurdle sits in the 176–178 zone. Stoch RSI is currently in overbought territory, suggesting a possible cooldown before the next push.
Key watchpoints:
– Retest of breakout level for confirmation
– Holding above EMAs to maintain bullish bias
– Clearing 178 resistance to open room for continuation toward 185+
Harmonic Patterns

EUR/USD – Day 12 of 100 Days Analysis
We’re closely watching price action around the 1.16164 demand zone. If price holds above this range and breaks 1.16472, we may see a bullish continuation up to 1.17060.
🔍 Smart Money Perspective:
Price may dip below the minor low to sweep liquidity
Retest around 1.16472 can offer a long opportunity
Target Zones:
🟢 TP1 – 1.16722
🟢 TP2 – 1.17060
⚠️ Risk Zone:
Below 1.16164, invalidation for longs. Break of 1.15981 = bearish shift.
📆 Recorded on: August 7, 2025
📍 Session: New York
💥 Watch this level-by-level roadmap unfold and stay consistent through 100 days of EUR/USD analysis!
👇 Comment your bias – Bullish or Bearish?
#forexsignals #eurusdanalysis #tradingview #priceactiontrader #forexchart #technicalanalysis #traderlifestyle #nyopen #smcforex #forexjourney

NZDUSD | Bullish NZDUSD has strengthened its position after a short correction.ZXY is trying to continue its bullish momemtum

ETH | Short | 3hrs This technical analysis is for informational and educational purposes only. It does not constitute financial advice. Remember to always research and consult with a professional before making investment decisions. Good luck! 📈💼🚀

Support levels ECOP Analysis
Closed at 48.37 (08-08-2025)
Support levels
S1 around 48
S2 around 38 - 39

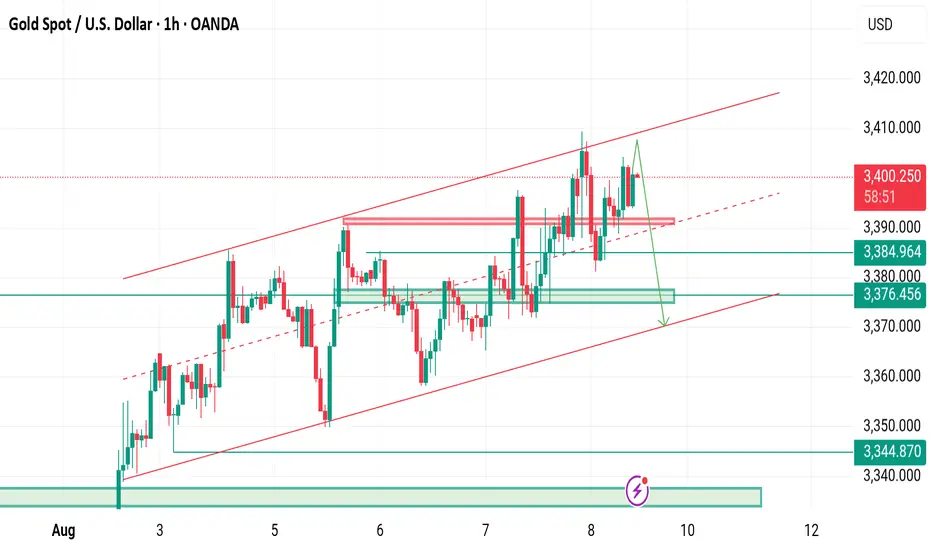
XAUUSD is on rising channel H1-H4 TIMEFRAME SETUP
Currently XAUUSD is following the rising channel along with flag pattern although I expecting market will fall from 3406-3410 zone.
What possible scenarios we have ?
• Market has to gives closing of H4 below 3390 for the implusive drop ,also I'm on holding sell trade above 3400 and my Targets are 3380 then 3365.
• secondly If gold drops to 3342-3335 thats my Buying area where I will buy XAUUSD in dips and my optimal target will be 3365 then 3380.
Additional Tip:
Above 3410 no sell Trade our rising channel will be invalid as Per SMC (BOS & CHOCH)
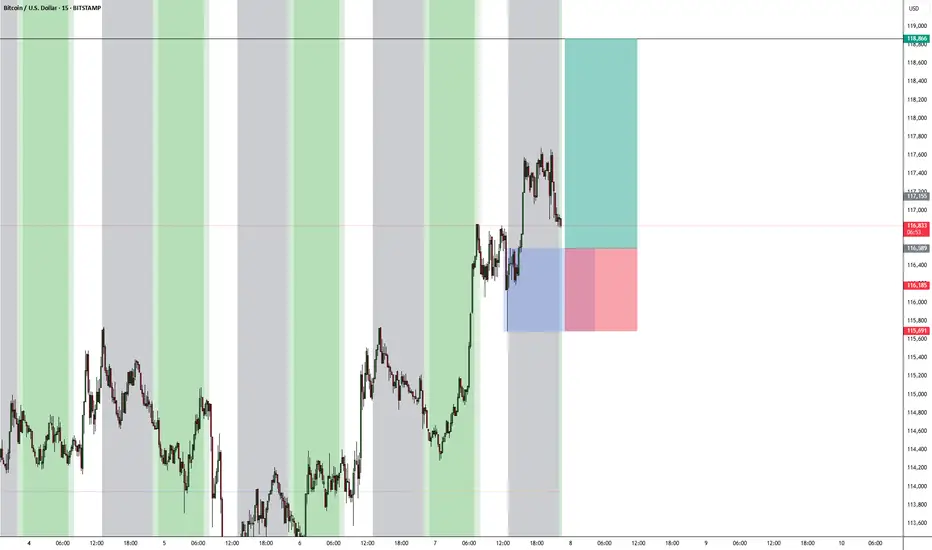
As ExpectedThe trend is still bullish, and we expect the price to reach 118.810.
A small correction — about one or two candles — is likely.

US30 H4 | Bearish drop off pullback resistanceBased on the H4 chart analysis, we could see the price rise to the sell entry at 44,294.22, which is a pullback resistance and could reverse to the downside.
Stop loss is at 44,783.24, which is an overlap resistance that aligns with the 78.6% Fibonacci retracement.
Take profit is at 43,461.56, which is a swing low support that is slightly above the 61.8% Fibonacci projection.
High Risk Investment Warning
Trading Forex/CFDs on margin carries a high level of risk and may not be suitable for all investors. Leverage can work against you.
Stratos Markets Limited (tradu.com ):
CFDs are complex instruments and come with a high risk of losing money rapidly due to leverage. 65% of retail investor accounts lose money when trading CFDs with this provider. You should consider whether you understand how CFDs work and whether you can afford to take the high risk of losing your money.
Stratos Europe Ltd (tradu.com ):
CFDs are complex instruments and come with a high risk of losing money rapidly due to leverage. 66% of retail investor accounts lose money when trading CFDs with this provider. You should consider whether you understand how CFDs work and whether you can afford to take the high risk of losing your money.
Stratos Global LLC (tradu.com ):
Losses can exceed deposits.
Please be advised that the information presented on TradingView is provided to Tradu (‘Company’, ‘we’) by a third-party provider (‘TFA Global Pte Ltd’). Please be reminded that you are solely responsible for the trading decisions on your account. There is a very high degree of risk involved in trading. Any information and/or content is intended entirely for research, educational and informational purposes only and does not constitute investment or consultation advice or investment strategy. The information is not tailored to the investment needs of any specific person and therefore does not involve a consideration of any of the investment objectives, financial situation or needs of any viewer that may receive it. Kindly also note that past performance is not a reliable indicator of future results. Actual results may differ materially from those anticipated in forward-looking or past performance statements. We assume no liability as to the accuracy or completeness of any of the information and/or content provided herein and the Company cannot be held responsible for any omission, mistake nor for any loss or damage including without limitation to any loss of profit which may arise from reliance on any information supplied by TFA Global Pte Ltd.
The speaker(s) is neither an employee, agent nor representative of Tradu and is therefore acting independently. The opinions given are their own, constitute general market commentary, and do not constitute the opinion or advice of Tradu or any form of personal or investment advice. Tradu neither endorses nor guarantees offerings of third-party speakers, nor is Tradu responsible for the content, veracity or opinions of third-party speakers, presenters or participants.

JPN225 H4 | Bearish reversalJapan 225 Index (JPN225) is reacting off the sell entry which acts as a swing high resistance and could reverse from this level oculd indicating a double top pattern which might lead to a potential price drop to the take profit.
Sell entry is at 42,043.92, which is a swing high resistance.
Stop loss is at 42,794.15, which aligns with the 127.2% Fibonacci extension and the 100% Fibonacci projection.
Take profit is at 41,269.97, which is a pullback support.
High Risk Investment Warning
Trading Forex/CFDs on margin carries a high level of risk and may not be suitable for all investors. Leverage can work against you.
Stratos Markets Limited (tradu.com ):
CFDs are complex instruments and come with a high risk of losing money rapidly due to leverage. 65% of retail investor accounts lose money when trading CFDs with this provider. You should consider whether you understand how CFDs work and whether you can afford to take the high risk of losing your money.
Stratos Europe Ltd (tradu.com ):
CFDs are complex instruments and come with a high risk of losing money rapidly due to leverage. 66% of retail investor accounts lose money when trading CFDs with this provider. You should consider whether you understand how CFDs work and whether you can afford to take the high risk of losing your money.
Stratos Global LLC (tradu.com ):
Losses can exceed deposits.
Please be advised that the information presented on TradingView is provided to Tradu (‘Company’, ‘we’) by a third-party provider (‘TFA Global Pte Ltd’). Please be reminded that you are solely responsible for the trading decisions on your account. There is a very high degree of risk involved in trading. Any information and/or content is intended entirely for research, educational and informational purposes only and does not constitute investment or consultation advice or investment strategy. The information is not tailored to the investment needs of any specific person and therefore does not involve a consideration of any of the investment objectives, financial situation or needs of any viewer that may receive it. Kindly also note that past performance is not a reliable indicator of future results. Actual results may differ materially from those anticipated in forward-looking or past performance statements. We assume no liability as to the accuracy or completeness of any of the information and/or content provided herein and the Company cannot be held responsible for any omission, mistake nor for any loss or damage including without limitation to any loss of profit which may arise from reliance on any information supplied by TFA Global Pte Ltd.
The speaker(s) is neither an employee, agent nor representative of Tradu and is therefore acting independently. The opinions given are their own, constitute general market commentary, and do not constitute the opinion or advice of Tradu or any form of personal or investment advice. Tradu neither endorses nor guarantees offerings of third-party speakers, nor is Tradu responsible for the content, veracity or opinions of third-party speakers, presenters or participants.

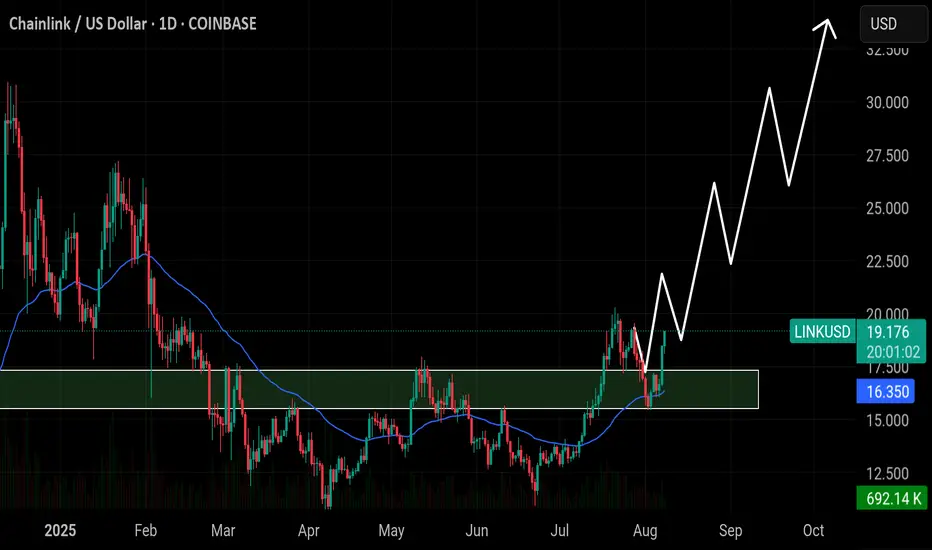
$LINK has retested the $15.80 breakout zone and bounced stronglyBIST:LINK has retested the $15.80 breakout zone and bounced strongly. Price is now gaining momentum and holding above the 50EMA. As long as this zone holds, LINK is likely to push toward $24, $28, and $32 in the coming weeks. A break below $15.0 would invalidate this bullish setup.
bitcoin long from hereim looking to long bitcoin from here with the hope of catching the next bull run
EUR/CAD – 93% Traders Are SHORT! Bearish Reversal Brewing?The EUR/CAD pair is currently in a bullish trend, but multiple technical and sentiment signals are pointing toward a possible trend reversal.
🔍 Key Observations:
Trend: Bullish (but losing momentum)
Bearish Divergence: Price making higher highs while RSI indicators show lower highs.
Pattern: Rising Wedge – a classic bearish reversal formation.
Harmonic Analysis: AB=CD pattern is approaching the potential reversal zone (PRZ).
EMA Insight: Price candles have moved across the 20 EMA and 50 EMA, signaling weakening bullish momentum.
Sentiment (Myfxbook.com): 93% of traders are currently short on EUR/CAD — strong crowd bias toward the downside.
📌 Trade Setup:
Bias: Bearish
Strategy: Sell Stop at breakout of previous Higher Low (HL)
Entry Price (EP): Sell Stop @ 1.59755
Stop Loss (SL): 1.60626
Take Profit 1 (TP1): 1.58884 (R:R = 1:1)
Take Profit 2 (TP2): 1.58013 (R:R = 1:2)
Lot Size: 0.15
Risk: $200 | Potential Reward: $200–$300
💡 Trade Execution Plan:
We will enter only after HL breakout confirmation to avoid false moves. This setup aligns Rising Wedge pattern, Bearish Divergence, EMA cross weakness, Harmonic PRZ zone, and bearish sentiment — a powerful confluence for a potential downside move.
📊 Technical Summary:
Combining price action, chart patterns, harmonics, momentum, and trader sentiment gives this short setup high probability.
📢 Your Turn:
What’s your take on this trade? Will the market follow the 93% bearish sentiment, or could this be a trap?
💬 Drop your analysis in the comments, let’s discuss!
👍 Like, 🔁 Share, and Follow for more trade setups & technical breakdowns.
#EURCAD #Forex #ForexTrading #BearishReversal #PriceAction #HarmonicPatterns #TechnicalAnalysis #EMA #Divergence #TradingView #ChartPatterns #SwingTrading #ForexSetups #ABCDPattern #PriceActionTrading #ForexSignals #RisingWedge #1HRTimeFrame #ForexLife #DayTrading #MarketSentiment #Myfxbook

Should we expect Ethereum price growth?Ethereum is moving back towards $4,000 after the pull-back I said earlier. Will this level finally be broken and the queen of crypto will move towards $5,000? I think it depends on many parameters. There is news that money is flowing into altcoins. If the $4000 level is broken with strong volume, we should expect good news for this popular digital currency.

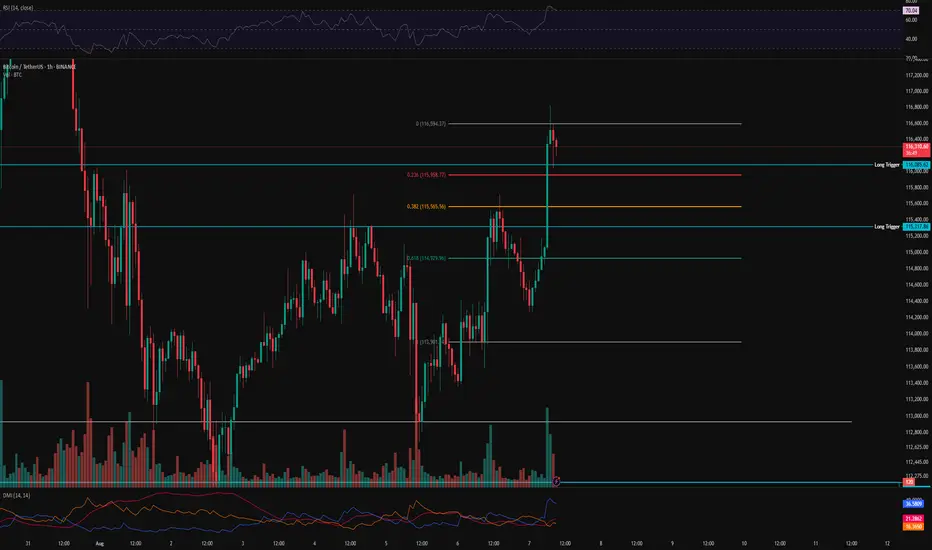
BTC 1H Analysis – Key Triggers Ahead | Day 4💀 Hey , how's it going ? Come over here — Satoshi got something for you !
⏰ We’re analyzing BTC on the 1-hour timeframe .
👀 After triggering our long entry levels , Bitcoin faced increased buying volume , and the U.S . unemployment claims came in higher than expected, which was interpreted positively for the crypto market .
🔼 With rising buying volume, Bitcoin may continue moving toward higher levels and could even aim for a new local high. Our key support zones are the same trigger levels we've been watching—these are also our ideal long entry points .
⚡️ There is a strong resistance around $117,000, where taker sellers are actively selling their Bitcoin at premium prices. In order to break through this area, we’ll need solid volume inflow from both market makers and retail buyers .
⚙️ There’s no clear RSI support zone at the moment, since on the 1-hour chart RSI is already in the Overbought area and oscillating there .
📈 Long position : Be a bit patient here . Wait for Bitcoin to pull back to key Fibonacci levels , preferably around 0.236 and 0.382, and then bounce back up . Once we break above the pullback, you can consider entering a long trade .
📉 Short position : A short setup could form only if both of our marked trigger levels get stop -hunted, combined with increased selling pressure , support breakouts , and confirmation from bearish candlestick patterns.
That said — we are not looking to short right now, as there are better opportunities to catch strong long entries .
❤️ Disclaimer : This analysis is purely based on my personal opinion and I only trade if the stated triggers are activated .
Gold (XAUUSD) – 4H Price is currently consolidating near the 3373 level, showing strength above the dynamic support zone and mid-range trend bands. A bullish breakout continuation appears likely, especially if the asset holds the 3360 support zone, which aligns closely with the 38.2% Fibonacci retracement from the recent impulsive move.
Ideal Entry:
Zone: 3360–3365, aligning with a pullback to the Fibonacci 38.2% retracement level and mid-band support.
Invalidation: A clean break and close below 3335 may suggest a deeper retracement or reversal.
🎯 Fibonacci based Targets:
Target 1: 3389 – Immediate resistance and equilibrium level; ideal for partial profit booking.
Target 2: 3422 (38.2% Fib extension) – A stronger extension target in line with the recent highs.
Target 3: 3443 (61.8% Fib extension) – Key swing extension; potential exhaustion or reversal zone.
Stop Loss: Below 3335
As long as price maintains above 3360, the bullish momentum remains valid. Look for bullish candlestick confirmation at entry and increasing volume for confirmation of a move toward the Fibonacci targets.

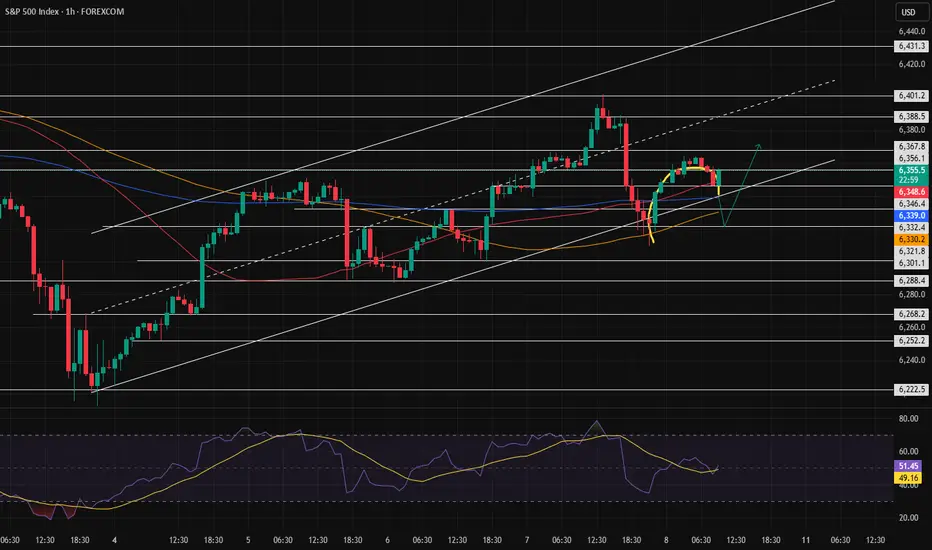
SPX500 - what's next?Further to my previous idea on SPX.
SPX respected the Resistance at FR 161.8 at 6400.
Price went down and reverted form SMA200 (4H)
Now price has completed the Perfect Gartley Pattern and reached point D.
If (against fundamentals) price reverts down from there and breaks down through SMA50 (4h), I will consider it as Bearish Validation and I will expect correction movement, which cen go down to ca 6000.
Just my humble opinion

buy gold saw liquidity sweep and unmitigated zones. comment for my explanation because I want to teach serious people only
thank you

GBPUSD 1H Supply Zone Rejection – Bearish Setup BuildingPrice is currently trading inside a clearly defined 1H supply zone near 1.34460
Multiple upper wicks show strong rejection and selling pressure at this level
Consolidation inside the supply area suggests potential distribution before a drop
🔻 Bearish Bias:
Bears expected to take control after final liquidity sweep above the zone
If price breaks below 1.33601, expect stronger momentum toward demand
📉 Trade Plan (Short Setup):
text
Copy
Edit
Sell Zone: 1.34400 – 1.34500
SL: Above 1.34650
TP1: 1.33601 (mid-support)
TP2: 1.32958 (high-volume support zone)
TP3: 1.32600 (orange demand base)
Risk:Reward ~ 2:1 or better
🧠 Key Price Levels:
🔵 Supply Zone: 1.34400 – 1.34500
🔵 Support Levels: 1.33601, 1.32958
🟠 Demand Zone: ~1.32600 (last major support zone)
📝 Notes:
Wait for bearish confirmation (M-pattern, engulfing candle, break of structure)
Ideal for Smart Money and supply/demand traders
⚠️ Disclaimer:
This is not financial advice. Trade at your own risk. Use proper risk management.

[SeoVereign] RIPPLE BEARISH Outlook – August 10, 2025In this idea, I would like to present a bearish outlook on Ripple.
There are three main reasons on which this perspective is based.
First, an arbitrary wave X forms a 1.272 ratio with another arbitrary wave X.
Second, a 1.414 BUTTERFLY pattern has formed.
Third, if the consistently formed trendline is broken to the downside, I believe the likelihood of Ripple’s decline will increase.
Accordingly, the average take-profit target has been set around 3.145 USDT.
Thank you very much for reading, and as time goes by and the chart becomes clearer, I will continue to update this idea accordingly.
Thank you.

Weakness of the trendSilver, although trying hard to go up, shows a very clear weakness in the trend. If it continues to attempt rising, it will probably only reach up to around 38.73839, and then most likely we will see a correction to fix this weakness before it moves upward with more strength.

Activation of the rounded pattern? Or a trend reversal?In the previous analysis, we mentioned that the price was at a decision point — and it made its decision, managing to move up slightly before returning to the bottom of the channel.
Now, at the end of the channel, a pattern has formed. We need to see whether it gets activated or turns out to be a fake.
If the pattern fails (turns out fake), the bullish trend could continue more strongly.
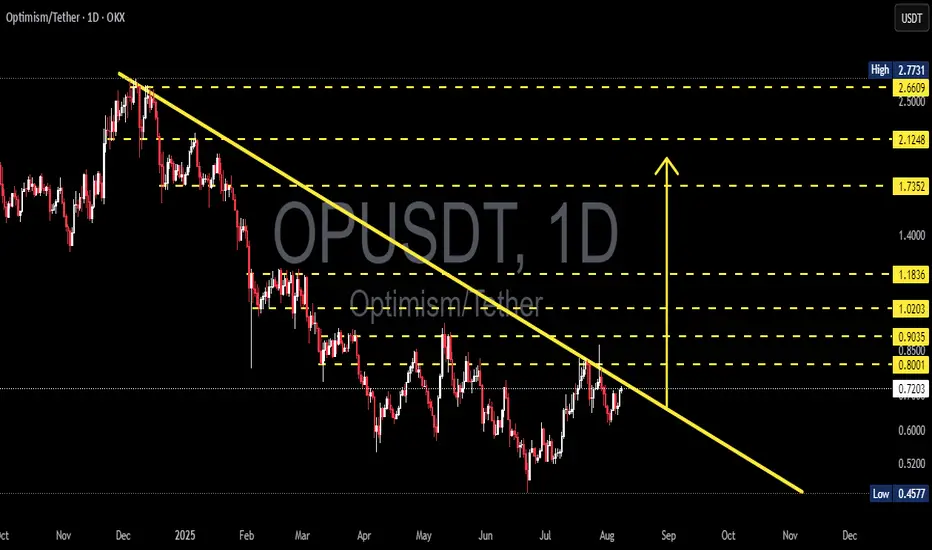
OP/USDT Technical Analysis – Approaching a Major Breakout Zone!Chart Overview: The OP/USDT pair on the 1D (Daily) timeframe is currently moving within a long-term descending trendline, forming a descending triangle or falling resistance channel since November 2024. The price is now approaching a critical point near the long-term resistance trendline (yellow line), which has been tested multiple times.
---
🟢 Bullish Scenario: Breakout Potential
If the price manages to break and close above the descending trendline resistance (currently near the $0.80–$0.85 zone), it would signal a strong bullish breakout. The next key resistance levels to watch (based on yellow dotted horizontal lines) are:
1. $0.9035 – minor resistance
2. $1.0203 – psychological level
3. $1.1836 – mid-term strong resistance
4. $1.7352 and $2.1248 – extended bullish targets
A confirmed breakout would ideally be supported by increasing volume and RSI momentum above 50.
---
🔴 Bearish Scenario: Rejection at Resistance
If the price fails to break the trendline and gets rejected, a downside move is likely to follow. Key support levels to watch are:
1. $0.7200 – current support
2. $0.6000 – minor support
3. $0.4577 – strong historical support (lowest level)
This would suggest continued bearish control and could extend the downtrend that has lasted over 8 months.
---
📊 Pattern Breakdown: Descending Trendline
Consistent lower highs since the peak near $2.77
The descending trendline is the main battle zone between bulls and bears
This pattern often leads to a breakout if buyers gain momentum
---
🎯 Conclusion & Strategy:
This is a critical zone for OP/USDT.
Traders should wait for breakout confirmation before entering long positions.
For breakout traders: consider a buy-the-breakout strategy with stop-loss below the trendline.
For short sellers: look for a rejection at resistance with targets at the nearest support levels.
#OPUSDT #CryptoAnalysis #Altcoins #TechnicalAnalysis #BreakoutTrade #Optimism #CryptoSetup #BullishScenario #BearishScenario #ChartPatterns
Silver' drop opportunity.Silver has rised last days very strongly in a narrow upward channel without any significant pullbeck. In my opinion it Is only pullbeck of downward trend from the last peak of 39,5 And the price Will Soon resume Its downward correction. I only don't know if the level for finishing this upward pullbeck finishihes ať 38,5 or around 39$. I'm bearish but be carefull and wait for the price break the Channel then shorting it Is very meaningful.
