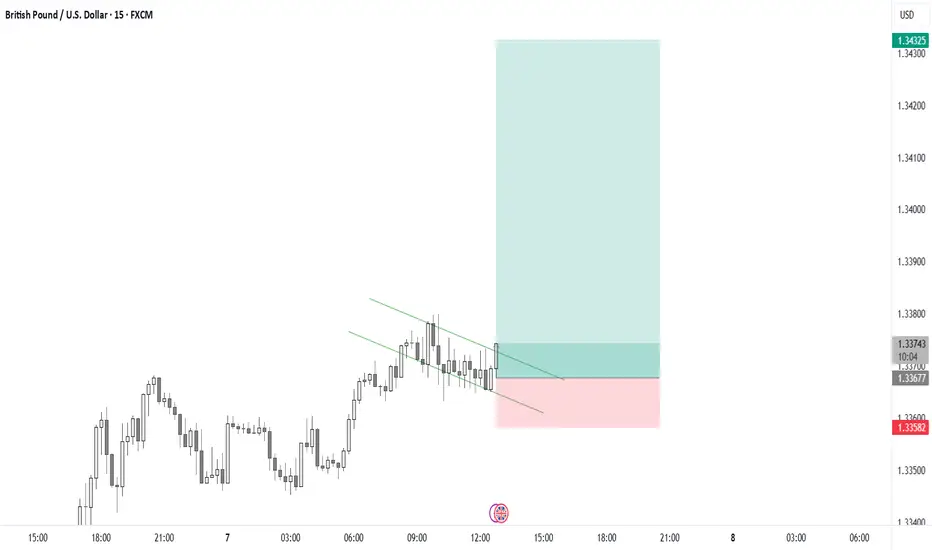
GBPUSD is BearishPrice was in an uptrend, however it now seems to have taken a rejection from a four hourly descending trendline with a double top formation and bearish RSI divergence. If previous higher low is broken then we can expect a bearish reversal as per Dow theory. Targets are mentioned on the chart.
Harmonic Patterns

XRP/USD Long Setup – Bullish Bounce from Key Demand Zone!XRP is showing early signs of a bullish reversal after a strong rejection from the $2.74–$2.90 demand zone. Price has started to push upward, forming a higher low structure on the 4H timeframe, suggesting a possible continuation toward higher levels.
🔍 Technical Breakdown:
Demand Zone (Support): $2.74 – $2.90 (Strong buy zone highlighted in orange)
Current Price: $2.987 (Trading above the demand zone with higher lows forming)
First Target (TP1): $3.231 (key structure resistance)
Second Target (TP2): $3.549 (supply zone where previous selloff began)
✅ Bullish Confluences:
Price bounced cleanly from demand zone
Bullish market structure with higher low
Visible volume support at current levels (LuxAlgo VRVP)
Room to move into imbalance above
📌 Trade Setup:
If momentum continues and XRP holds above $2.90:
Entry Zone: $2.95 – $3.00 (current level)
SL: Below $2.74 (beneath demand zone)
TP1: $3.231
TP2: $3.549
🧠 Notes:
Break and close above $3.231 would open the path to higher levels
Watch for consolidation before breakout
Supply zone at $3.549 is significant — partial TP is wise
🟢 Bias: Bullish

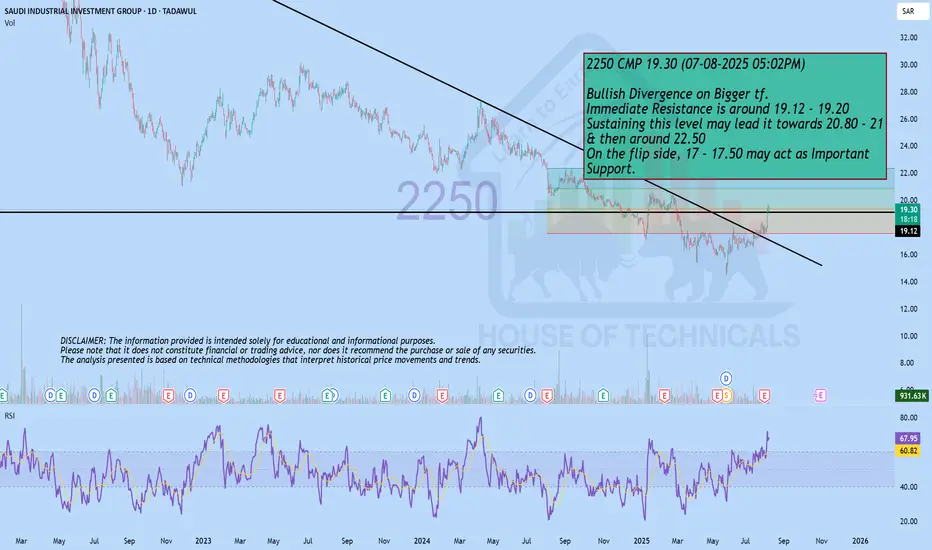
Bullish Divergence on Bigger tf.2250 CMP 19.30 (07-08-2025 05:02PM)
Bullish Divergence on Bigger tf.
Immediate Resistance is around 19.12 - 19.20
Sustaining this level may lead it towards 20.80 - 21
& then around 22.50
On the flip side, 17 - 17.50 may act as Important
Support.
LTCUSD H4 | Bullish bounceLitecoin (LTC/USD) is falling towards the buy entry which is an overlap support and could bounce to the upside.
Buy entry is at 110.50, an overlap support that is slightly above the 78.6% Fibonacci retracement.
Stop loss is at 101.23, which is a swing low support.
Take profit is at 123.91, which is a swing high resistance.
High Risk Investment Warning
Trading Forex/CFDs on margin carries a high level of risk and may not be suitable for all investors. Leverage can work against you.
Stratos Markets Limited (tradu.com ):
CFDs are complex instruments and come with a high risk of losing money rapidly due to leverage. 65% of retail investor accounts lose money when trading CFDs with this provider. You should consider whether you understand how CFDs work and whether you can afford to take the high risk of losing your money.
Stratos Europe Ltd (tradu.com ):
CFDs are complex instruments and come with a high risk of losing money rapidly due to leverage. 66% of retail investor accounts lose money when trading CFDs with this provider. You should consider whether you understand how CFDs work and whether you can afford to take the high risk of losing your money.
Stratos Global LLC (tradu.com ):
Losses can exceed deposits.
Please be advised that the information presented on TradingView is provided to Tradu (‘Company’, ‘we’) by a third-party provider (‘TFA Global Pte Ltd’). Please be reminded that you are solely responsible for the trading decisions on your account. There is a very high degree of risk involved in trading. Any information and/or content is intended entirely for research, educational and informational purposes only and does not constitute investment or consultation advice or investment strategy. The information is not tailored to the investment needs of any specific person and therefore does not involve a consideration of any of the investment objectives, financial situation or needs of any viewer that may receive it. Kindly also note that past performance is not a reliable indicator of future results. Actual results may differ materially from those anticipated in forward-looking or past performance statements. We assume no liability as to the accuracy or completeness of any of the information and/or content provided herein and the Company cannot be held responsible for any omission, mistake nor for any loss or damage including without limitation to any loss of profit which may arise from reliance on any information supplied by TFA Global Pte Ltd.
The speaker(s) is neither an employee, agent nor representative of Tradu and is therefore acting independently. The opinions given are their own, constitute general market commentary, and do not constitute the opinion or advice of Tradu or any form of personal or investment advice. Tradu neither endorses nor guarantees offerings of third-party speakers, nor is Tradu responsible for the content, veracity or opinions of third-party speakers, presenters or participants.

BUY GBPUSDGBPUSD will continue higher. Price looks strong ahead of the highly anticipated BoE statement. A bullish flag further confirms this trade.
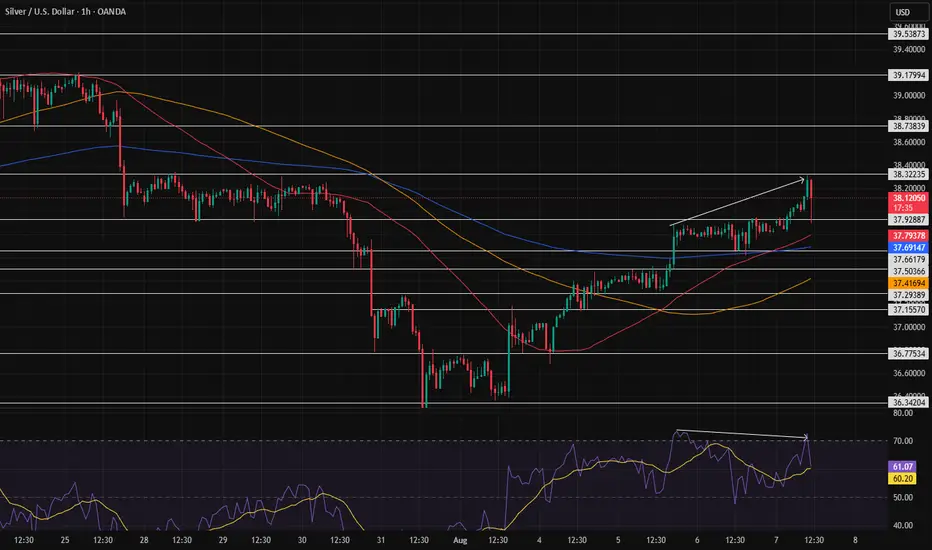
Resistance at 38.32235After the price reached the point we mentioned and got rejected, it's now trying to approach that area again. However, we're seeing a divergence, which could indicate weakness in the trend—though that's not always the case.
In any case, we have to wait and see; if it manages to break through that level, we can hope for the price to reach 39.17994.
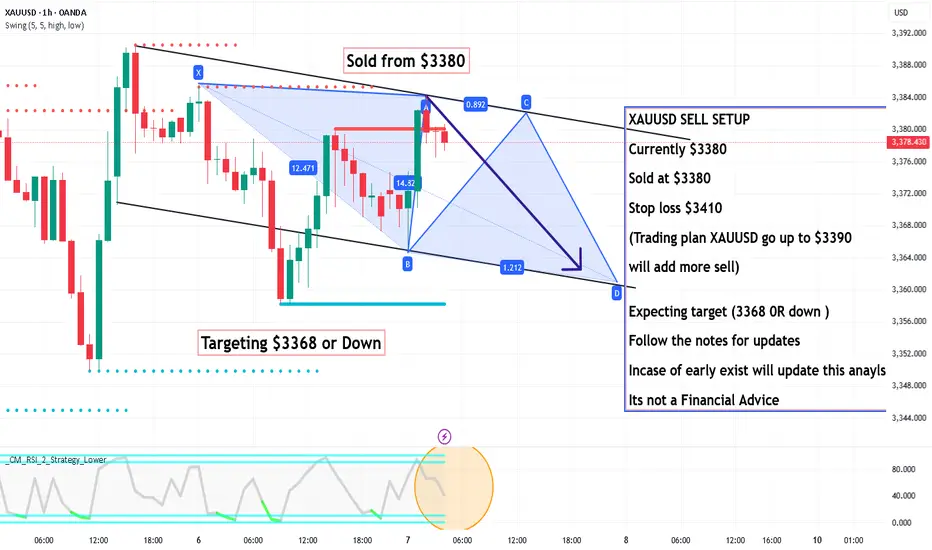
XAUUSD SELL SETUP ,Sold at $3380XAUUSD SELL SETUP
Currently $3380
Sold at $3380
Stop loss $3410
(Trading plan XAUUSD go up to $3390
will add more sell)
Expecting target (3368 0R down )
Follow the notes for updates
Incase of early exist will update this anaylsis
Its not a Financial Advice
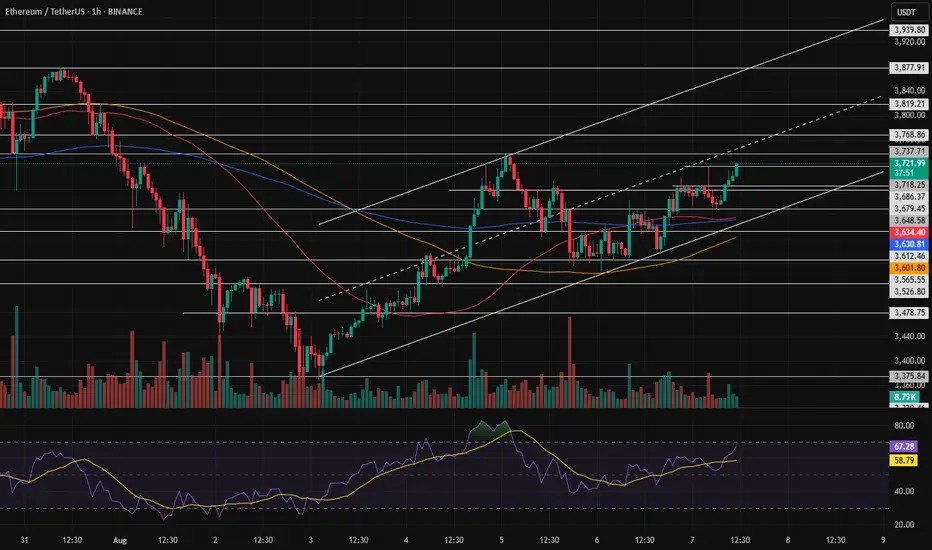
The 3738.28 zone is the golden pointAfter confirmation in this price zone, we can say that the path to 3800 becomes much easier and more likely, making the move toward 4000 more feasible. However, it's still too early to make decisions about that, so for now, we're only analyzing up to 3800.
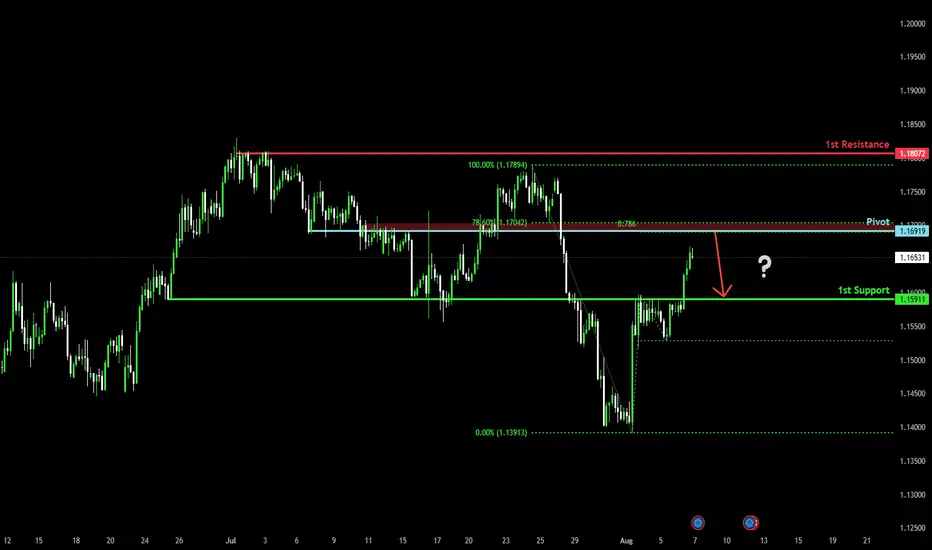
Bearish reversal for the Fiber?The price is rising towards the pivot and could reverse to the 1st support which is an overlap support.
Pivot: 1.1691
1st Support: 1.1591
1st Resistance: 1.1807
Risk Warning:
Trading Forex and CFDs carries a high level of risk to your capital and you should only trade with money you can afford to lose. Trading Forex and CFDs may not be suitable for all investors, so please ensure that you fully understand the risks involved and seek independent advice if necessary.
Disclaimer:
The above opinions given constitute general market commentary, and do not constitute the opinion or advice of IC Markets or any form of personal or investment advice.
Any opinions, news, research, analyses, prices, other information, or links to third-party sites contained on this website are provided on an "as-is" basis, are intended only to be informative, is not an advice nor a recommendation, nor research, or a record of our trading prices, or an offer of, or solicitation for a transaction in any financial instrument and thus should not be treated as such. The information provided does not involve any specific investment objectives, financial situation and needs of any specific person who may receive it. Please be aware, that past performance is not a reliable indicator of future performance and/or results. Past Performance or Forward-looking scenarios based upon the reasonable beliefs of the third-party provider are not a guarantee of future performance. Actual results may differ materially from those anticipated in forward-looking or past performance statements. IC Markets makes no representation or warranty and assumes no liability as to the accuracy or completeness of the information provided, nor any loss arising from any investment based on a recommendation, forecast or any information supplied by any third-party.
Big breakout in tvs motors Tvs motors gives good breakout. By crossing its all tym high tvs motors gives a great opportunity for swing( 8-10 % upside possible).
But tvs motors at 2954-2980
Target 3100 3200 3243 3540
Sl 2890

Gold Trade Plan 06/08/2025Dear Traders
I am expecting a drop in gold to the targets of 3309 and 3282. I see a pattern on the chart, and if the price doesn't fix above 3390, a drop to 3290 and 3282 is inevitable.
First Target : 3330
Second target : 3309
third Target : 3290
Regards,
Alireza!

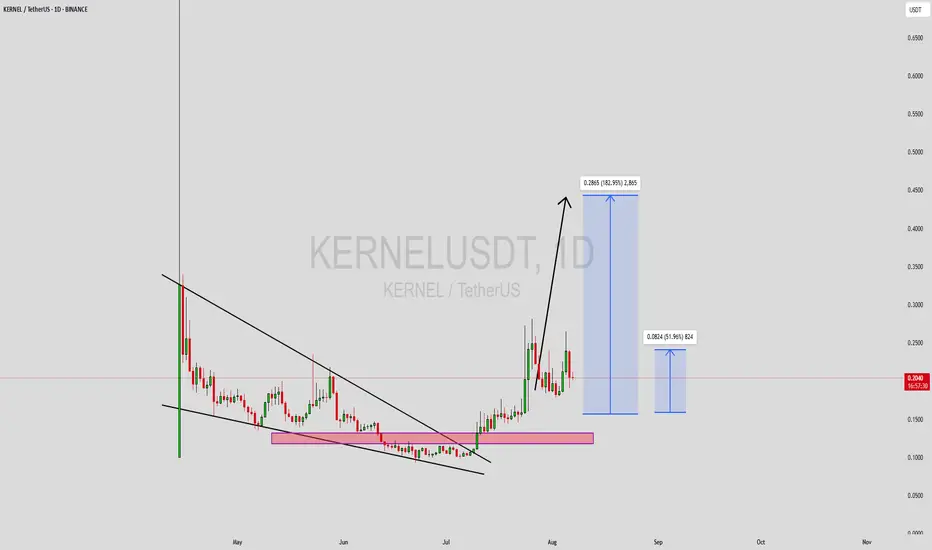
KERNELUSDT Forming Falling WedgeKERNELUSDT is shaping up as a strong breakout candidate, currently trading within a well-defined falling wedge pattern. This technical formation often marks the end of a downtrend and suggests a bullish reversal is near. As the price compresses and approaches the apex of the wedge, we typically see an increase in bullish momentum. In KERNEL's case, the volume is holding steady at promising levels, indicating growing interest and potential accumulation by savvy investors ahead of a breakout.
The falling wedge pattern is widely respected among technical analysts due to its historically high success rate when paired with rising volume and market optimism. KERNELUSDT is offering exactly that setup. With a projected gain of 140% to 150% from the current levels, this crypto pair is attracting traders who are hunting for high-upside opportunities in a consolidating market. Breakouts from such patterns are often sharp and fast, which makes proper timing crucial for maximizing gains.
Market sentiment around the KERNEL project is also improving, with increasing chatter across social platforms and trading communities. This aligns well with the technical structure on the chart and adds further weight to the bullish case. If KERNEL can break above the wedge resistance with volume confirmation, it could quickly surge into price discovery zones not seen in recent weeks.
With all indicators aligning and price tightening within the wedge, KERNELUSDT deserves close attention from technical traders. A well-timed entry here could result in substantial upside if the breakout plays out as expected.
✅ Show your support by hitting the like button and
✅ Leaving a comment below! (What is You opinion about this Coin)
Your feedback and engagement keep me inspired to share more insightful market analysis with you!
SPY 0DTE Bearish Setup – Max Pain in Play (Aug 7)## ⚠️ SPY 0DTE Bearish Setup – Max Pain in Play (Aug 7)
**Low-Conviction Market = Short-Term Put Opportunity?**
### 🧠 Summary of Consensus:
All major models (Grok, Gemini, Claude, Llama, DeepSeek) flag the **lack of bullish momentum**.
💡 **Key Bearish Signals**:
* 📉 Price below VWAP
* 📊 Weak volume
* 📉 RSI & flow: neutral to bearish
* 🎯 Max pain hovering near current price
---
### 🤖 AI Model Breakdown:
| Model | Bias | Action |
| -------------- | ------------------- | ---------------------------- |
| Grok / Gemini | 🔻 Weak Bearish | No trade (wait for clarity) |
| Claude / Llama | 🔻 Moderate Bearish | Buy PUT at \$630 |
| DeepSeek | ⚖️ Mixed Bearish | Monitor – no high-conviction |
🧭 **Consensus Direction**: **Weak Bearish**
---
### 🔧 Trade Setup (0DTE)
| Metric | Value |
| ---------------- | ------------- |
| 🎯 Instrument | SPY |
| 🔀 Direction | PUT (SHORT) |
| 💵 Entry Price | 0.78 |
| 💣 Strike Price | 630.00 |
| 🛑 Stop Loss | 0.39 |
| 🎯 Profit Target | 1.56 |
| 📅 Expiry | Aug 07 (0DTE) |
| ⏰ Entry Timing | Market Open |
| 📈 Confidence | 60% |
📊 **Risk/Reward**: 1:2
📉 **Time Decay Alert**: Tight stop-loss due to fast 0DTE decay.
---
### ⚠️ Key Watchouts:
* 📈 Reclaiming VWAP = **exit immediately**
* 🔊 Sudden volume spike = momentum shift risk
* 🧯 Keep position size small – this is a **scalp**, not a swing
---
### 🧠 Final Take:
> If SPY stays pinned below VWAP & max pain remains, this **0DTE put could print**. But discipline is everything — tight stop, tight leash. ⚔️
---
🧠 **Follow for daily AI-backed earnings & SPY plays**
📉 **Not financial advice – manage risk like a pro**

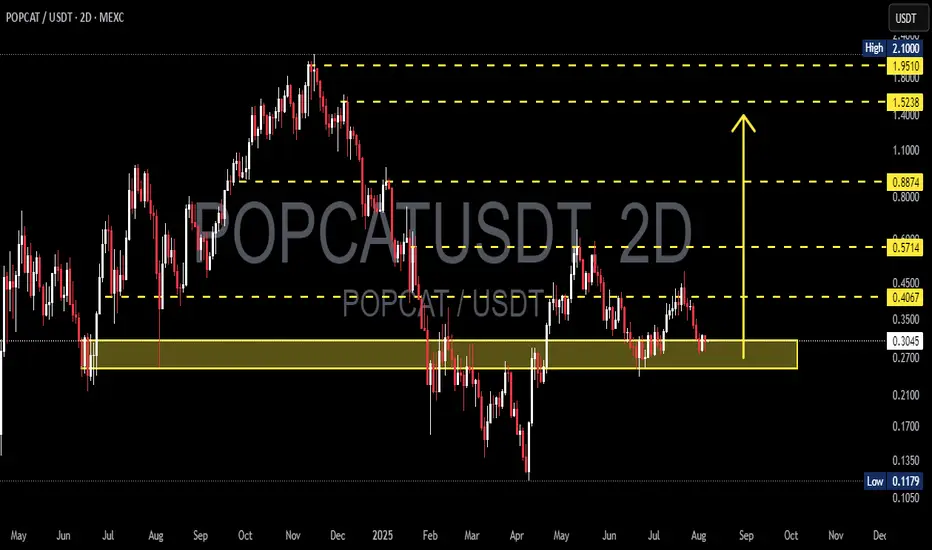
POPCAT/USDT – Testing Demand Zone: Reversal or Breakdown?POPCAT/USDT is currently retesting one of the most crucial demand zones in its mid-term price structure, located between $0.2700 – $0.3037. This area has historically acted as a strong support level and has triggered significant rebounds in the past. The market's reaction here will be key in determining whether POPCAT is ready for a bullish reversal or heading for a deeper correction.
---
🔍 Market Structure & Price Action
The price has entered a sideways consolidation phase after a steady decline from the $0.4067 region.
So far, the support zone at $0.2700 has been respected multiple times, indicating buying interest remains active.
However, no clear bullish reversal pattern has formed yet, making the next movement critical.
---
🟢 Bullish Scenario (Reversal / Bounce)
If the price manages to hold above this demand zone and forms a higher low along with a strong bullish candlestick confirmation, we could see a potential trend reversal.
🎯 Potential bullish targets:
TP1: $0.4067 – Minor resistance, top of the current range.
TP2: $0.5714 – Mid-range resistance, a previous breakdown zone.
TP3: $0.8874 – Major resistance, the last high before the steep drop.
TP4: $1.5238 – $1.9510 – Psychological resistance zone, possible medium-term swing targets if bullish momentum strengthens.
🔐 Key confirmations:
Bullish engulfing / hammer candlestick on the 2D chart.
Increase in volume + breakout above range resistance.
---
🔴 Bearish Scenario (Breakdown Continuation)
If the price fails to hold $0.2700 and we see a clear daily or 2D candle close below the demand zone, this would indicate loss of bullish strength and open room for further downside.
🎯 Bearish targets:
TP1: $0.2100 – Psychological support level.
TP2: $0.1179 – All-time low and historical bottom.
⚠️ Risk factors:
Strong bearish candle close + high volume breakdown would confirm sellers’ dominance.
---
🧩 Pattern & Formation Insights
A horizontal base / accumulation range is visible within the demand zone.
If the price rebounds, we could be forming a double bottom – a classic reversal signal.
However, if the zone breaks, the chart may develop into a descending channel or bearish continuation pattern.
---
🧠 Trading Strategy Outlook
Swing Traders: Consider long entries within the demand zone ($0.2700–$0.3037) with a tight stop-loss just below the zone. Aim for multiple resistance levels as take-profit targets.
Breakout Traders: Wait for confirmation above $0.4067 with increased volume.
Bearish Setup: Short entry upon breakdown below $0.2700 with targets towards the next support zones.
#POPCAT #AltcoinAnalysis #CryptoTechnicalAnalysis #DemandZone #BreakoutOrBreakdown #USDT #MEXC #SwingTrade #CryptoSetup #BullishReversal #BearishBreakdown #ChartAnalysis #TradingView
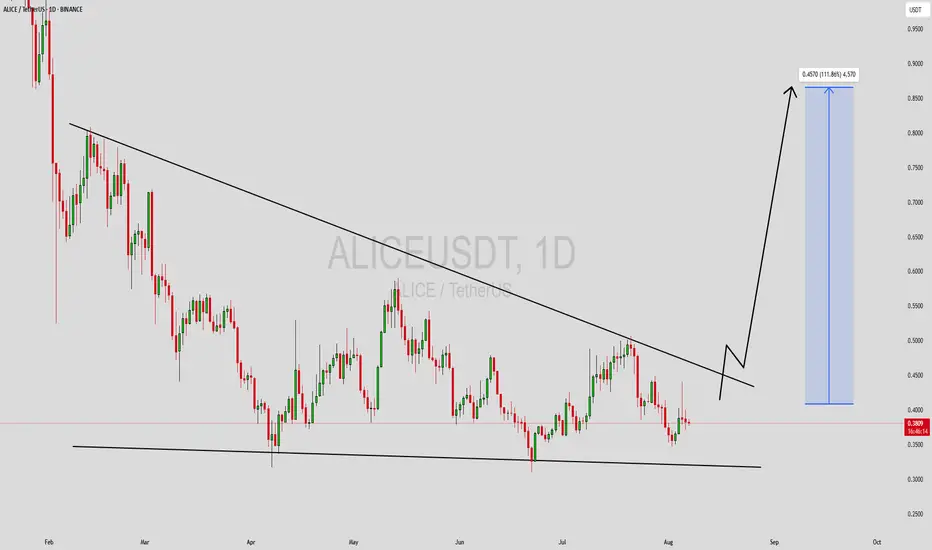
ALICEUSDT Forming Descending ChannelALICEUSDT is currently trading within a descending channel pattern, a classic technical structure that often precedes a significant bullish reversal. This pattern forms when price action is contained between two downward-sloping parallel lines, signaling a gradual downtrend. However, these channels are known to break to the upside once bearish momentum weakens and buying interest returns. With ALICEUSDT showing good volume and healthy investor attention, the conditions are aligning for a potential breakout.
Descending channels are closely monitored by technical traders due to their strong risk-to-reward setup. ALICE is currently near the lower boundary of the channel, offering an ideal entry point for those anticipating a reversal. If the price manages to break out from the upper trendline with volume confirmation, we could see a sharp rally toward the projected gain range of 90% to 100% or even higher. Historical price behavior and market structure further strengthen this bullish outlook.
Investor sentiment around ALICEUSDT is building steadily, fueled by renewed interest in metaverse and blockchain gaming projects. As more investors take note of the technical setup and potential gains, we may see increased participation, driving momentum further. Technical indicators such as RSI and MACD are also showing signs of potential divergence, often seen before breakout moves.
Given the strong pattern formation, growing volume, and market interest, ALICEUSDT stands as a high-potential candidate for the coming weeks. Traders should keep an eye on key resistance levels and volume surges as potential breakout confirmation signals.
✅ Show your support by hitting the like button and
✅ Leaving a comment below! (What is You opinion about this Coin)
Your feedback and engagement keep me inspired to share more insightful market analysis with you!
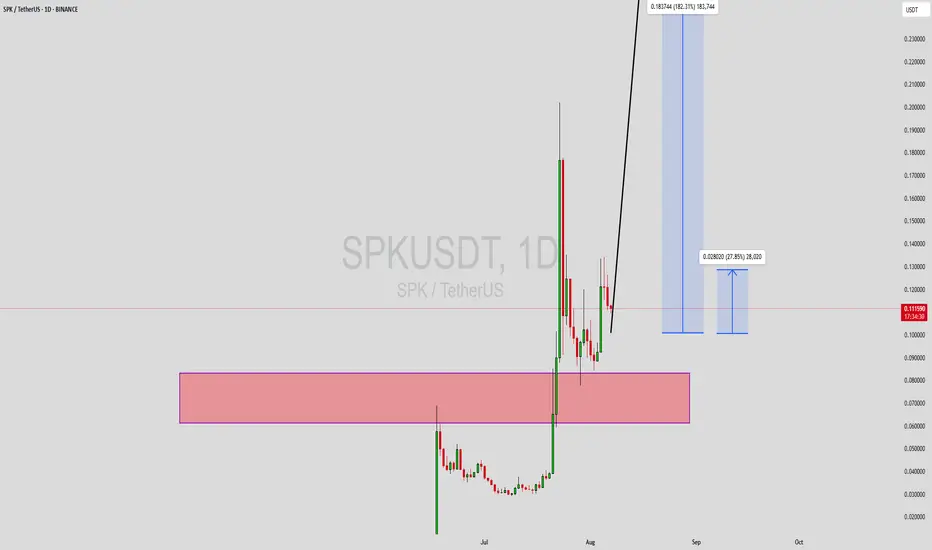
SPKUSDT Forming Bullish ContinuationSPKUSDT has recently emerged as a high-potential breakout candidate, catching the eye of many crypto traders and investors. The price action has shown remarkable strength after reclaiming and retesting a key demand zone, marked in red on the chart. Following this, SPK printed a strong impulsive move, suggesting renewed momentum and accumulation. With healthy volume flowing in and a supportive structure beneath, the coin appears ready to resume its bullish rally toward the projected 140% to 150% target area.
This technical setup signals strong bullish intent, especially as the market continues to favor altcoins with solid community interest and aggressive price behavior. The price is currently forming higher lows on the daily timeframe, and with a bullish continuation pattern unfolding, the potential for explosive upside becomes highly likely. Traders who understand market structure will note that this kind of compression above a support zone often leads to a sharp breakout.
SPK also benefits from growing investor attention, with increasing social mentions and trading volume supporting the upward momentum. While the broader market trends remain a factor, SPK's chart speaks for itself — the setup aligns with high-reward trading principles, and short-term price targets point toward significant gains. The immediate resistance lies far above the current levels, offering enough room for bulls to push price action higher.
Whether you are a trend-following trader or a breakout enthusiast, SPKUSDT presents a strong technical and sentiment-driven case for a bullish continuation.
✅ Show your support by hitting the like button and
✅ Leaving a comment below! (What is You opinion about this Coin)
Your feedback and engagement keep me inspired to share more insightful market analysis with you!
USDCAD BUY 1.3610On the 4-hour chart, USDCAD is experiencing a short-term oscillation and decline, with a bearish trend prevailing. Currently, attention can be paid to the area around 1.3610, which is a potential buy point for a bullish bat pattern and is within the previous demand zone.

ASM -Australian Strategic MaterialsPromising.
Now word to say yet but very promising.
This is the key and solution to get away from China and balance the supply of Lithium and Rare Earth Materials.
ASM have signed production with Korea.
Korea has a significant influence in production of Samsung phone and EV cars around the world.
all we need is first production and BOOM


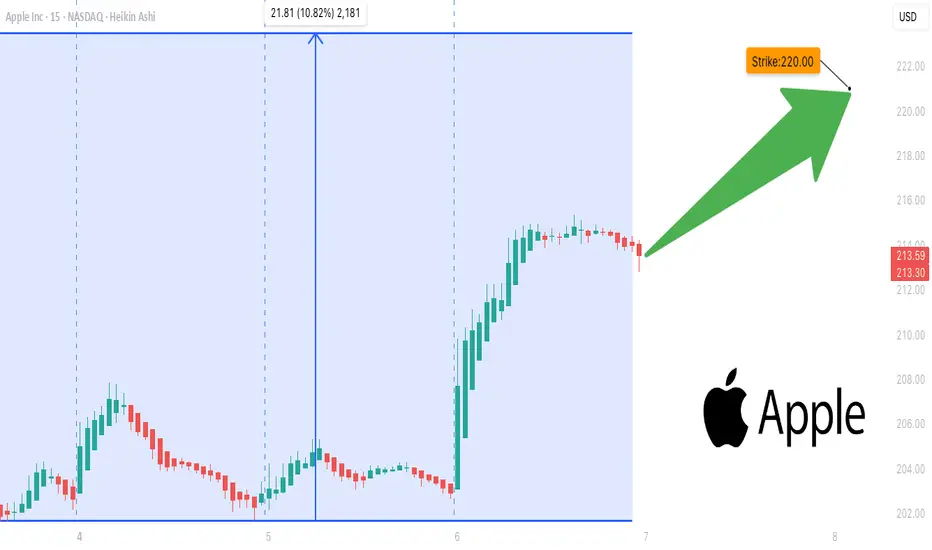
AAPL Bulls Ready to Strike## 🍎 AAPL Bulls Ready to Strike? 🚨 Weekly Options Loading...
**Call at \$220 → Entry \$0.66 → Target \$1.32 💰💰**
---
**🧠 AI Consensus Highlights:**
✔️ Strong Options Flow 📈
✔️ Institutional Volume Spike
⚠️ Caution: Bearish Daily RSI
🔀 Mixed Sentiment = Selective Entries Only
---
**🔥 Featured Trade Setup:**
* 📍 **Strike:** \$220 Call
* 💵 **Entry:** \$0.66
* 🎯 **Target:** \$1.32
* 🛑 **Stop:** \$0.33
* 📅 **Expiry:** Aug 8
* 📈 **Confidence:** 65%
* ⏰ **Entry Timing:** Open
---
**⚔️ Model Breakdown (AI Models):**
* **Grok & Claude:** Bullish → Call Recommended
* **DeepSeek & Gemini:** Cautious → No Entry
* **Meta:** Mixed → Watch RSI & Gamma Sensitivity
---
**🧠 Strategy:**
Scalp the weekly upside using a tight stop-loss + profit lock. Timing is key with high gamma volatility expected post-earnings.
---
**📛 Tags for TradingView Post:**
\#AAPL #OptionsAlert #AppleStock #EarningsPlay #CallOptions #WeeklySetup #TradingStrategy #OptionsFlow #BullishSetup #TechStocks #AITrading #InstitutionalFlow #MarketAnalysis
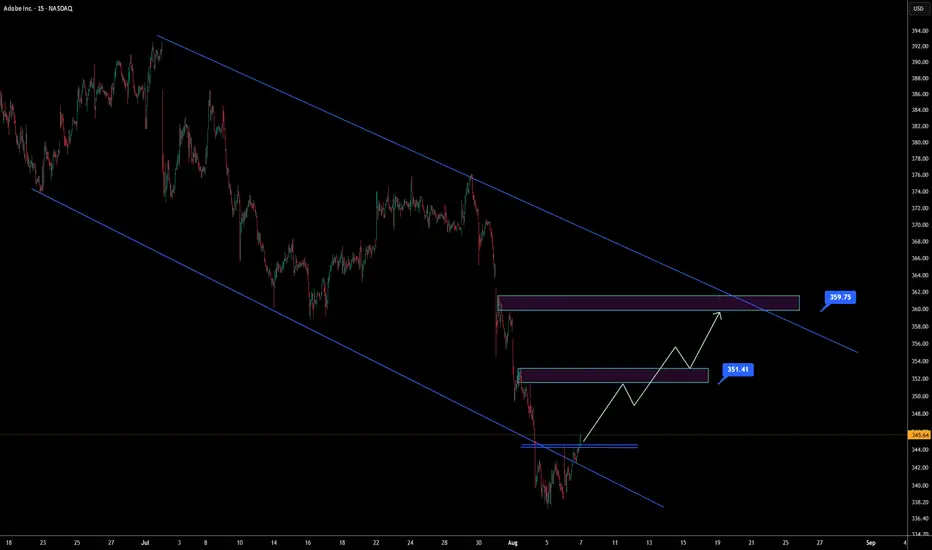
ADBE - Bullish Breakout from Channel Support | Targeting 359.75Price recently bounced from the lower boundary of a well-defined descending channel, finding support at a key demand area.
The breakout above local resistance suggests bullish momentum building up, with two target zones mapped at 351.41 and 359.75.
Watching for a potential continuation towards the upper trendline of the channel.
LINK/USDT Bullish Setup – Rebound from Demand Zone Targets ChainLink (LINK) is showing a potential bullish reversal on the 4H timeframe, after defending the key demand zone between $15.60 – $16.20. Buyers stepped in aggressively, and price is now forming higher lows — a good signal of trend shift.
🔍 Technical Breakdown:
Demand Zone (Support): $15.60 – $16.20 (highlighted in orange)
Current Price: $16.65 (bullish structure forming off support)
First Target (TP1): $17.95 (prior resistance / mid-range)
Second Target (TP2): $19.55 – $20.00 (major supply zone)
✅ Bullish Confluences:
Strong bounce off demand zone
Bullish structure forming (higher low + bullish candles)
Volume Profile (LuxAlgo VRVP) confirms demand at this level
Clear imbalance toward $19.55 zone
📌 Trade Plan:
If price continues upward and holds above $16.20:
Entry Zone: $16.50 – $16.80 (current market price)
Stop Loss (SL): Below $15.60 (beneath demand zone)
TP1: $17.95
TP2: $19.55
🧠 Notes:
Break above $17.95 confirms bullish continuation
Take partials around TP1 and trail remaining to TP2
$19.55 zone may trigger short-term pullback due to supply
🟢 Bias: Bullish (as long as $15.60 holds)

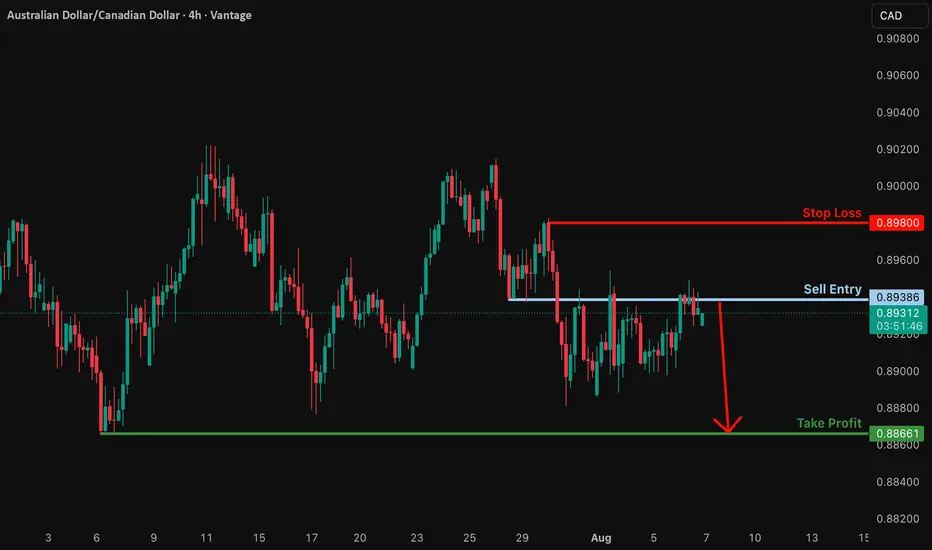
Potential bearish drop?AUD/CAD is reacting off the resistance level, which is a pullback resistance, and could drop from this level to our take-profit.
Entry: 0.89386
Why we like it:
There is a pullback resistance.
Stop loss: 0.8980
Why we like it:
There is a pullback resistance.
Take profit: 0.8866
Why we like it:
There is a swing low support.
Enjoying your TradingView experience? Review us!
Please be advised that the information presented on TradingView is provided to Vantage (‘Vantage Global Limited’, ‘we’) by a third-party provider (‘Everest Fortune Group’). Please be reminded that you are solely responsible for the trading decisions on your account. There is a very high degree of risk involved in trading. Any information and/or content is intended entirely for research, educational and informational purposes only and does not constitute investment or consultation advice or investment strategy. The information is not tailored to the investment needs of any specific person and therefore does not involve a consideration of any of the investment objectives, financial situation or needs of any viewer that may receive it. Kindly also note that past performance is not a reliable indicator of future results. Actual results may differ materially from those anticipated in forward-looking or past performance statements. We assume no liability as to the accuracy or completeness of any of the information and/or content provided herein and the Company cannot be held responsible for any omission, mistake nor for any loss or damage including without limitation to any loss of profit which may arise from reliance on any information supplied by Everest Fortune Group.