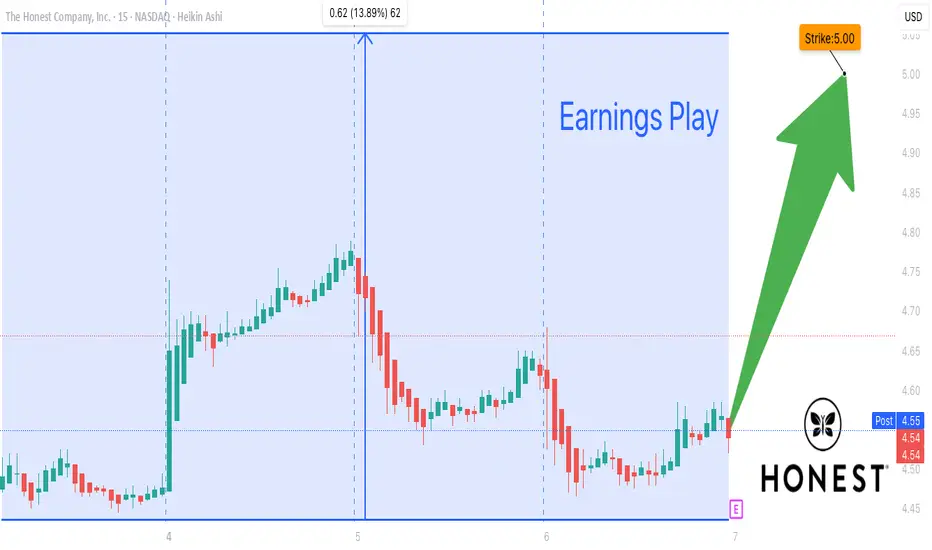
HNST Earnings Tonight: High-Conviction \$5C Setup! ## 💄📈 HNST Earnings Tonight: High-Conviction \$5C Setup! 🚨
**88% Beat Rate | Avg Surprise 257% | Premium \$0.30 → Target \$1.00+?**
Volatility Loading… 💥 Will Honest Co. Deliver Again?
---
**📊 Trade Snapshot:**
* 🎯 **Strike:** \$5.00 Call
* 💰 **Entry:** \$0.30
* 📈 **Profit Target:** \$1.00
* 🛑 **Stop Loss:** \$0.15
* 📆 **Expiry:** Aug 15
* 📊 **Confidence:** 72%
* ⏰ **Earnings Tonight (AMC)**
* 📍 **IV Rank:** 75%
---
**🔥 Why It Matters:**
* 8/8 Earnings Beats 📊
* High Accumulation & Volume Spike
* Call OI > 6,500 contracts
* Bearish skew → Risk priced in
* RSI Neutral → Room to move
---
**#HNST #EarningsPlay #OptionsTrading #VolatilityTrade #BreakoutAlert #ConsumerStocks #TradingView #SwingTrade #IVCrushProtection #CallOptions #5DollarStrike #HonestCompany #EarningsSetup**
Harmonic Patterns
DOGEUSD Bullish Setup – Demand Zone Reversal in PlayDOGE/USD has rebounded from a clearly defined demand zone around $0.18049 – $0.19795, showing signs of strength after forming a higher low. This zone has acted as a historical buy area and is reinforced by strong volume activity.
🔹 Key Levels:
🟠 Demand Zone: $0.18049 – $0.19795 (Confirmed accumulation zone)
🔵 Immediate Resistance: $0.23128
🔵 Major Supply Zone: $0.27346 – $0.28000 (Strong rejection area in past structure)
🟢 Bullish Scenario:
If the current bullish momentum holds:
Target 1: $0.23128 – First structural resistance
Target 2: $0.27346 – Previous high and major supply zone
Green arrows indicate the potential upward move if buyers sustain pressure.
📌 Trade Idea:
Buy Setup
Entry: $0.19800 – $0.20600 (current area)
SL: Below $0.19400 (below demand zone)
TP1: $0.23128
TP2: $0.27346
⚠️ Caution:
If price closes below $0.19400, bullish setup becomes invalid.
Wait for strong bullish confirmation before entry (e.g., bullish engulfing, higher low, or break above $0.21000).
🔁 Follow for more DOGEUSD and altcoin demand zone plays.
📊 #DOGEUSD #Dogecoin #Altcoins #CryptoTrading #DemandZone #PriceAction #TradingView

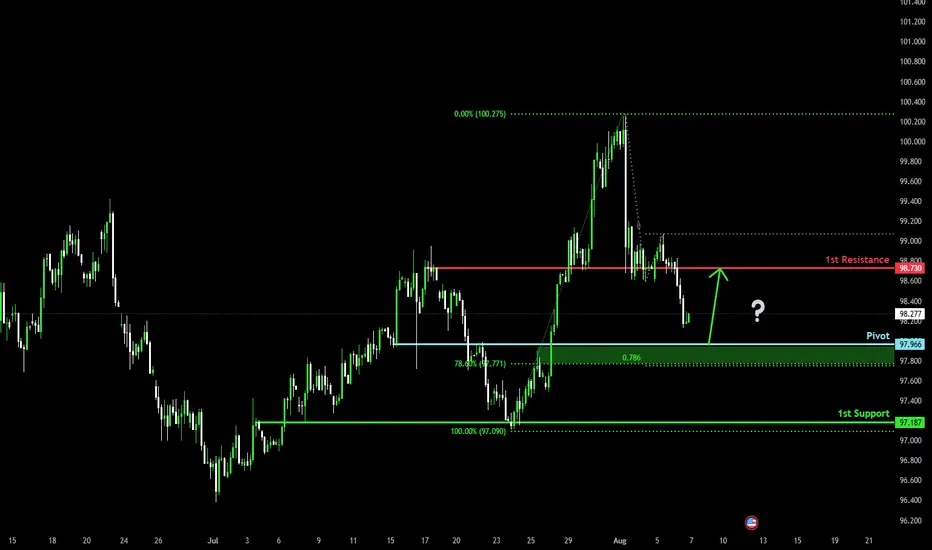
Bullish bounce off?US Dollar Index (DXY) is falling towards the pivot and could bounce to the 1st resistance.
Pivot: 97.96
1st Support: 97.18
1st Resistance: 98.73
Risk Warning:
Trading Forex and CFDs carries a high level of risk to your capital and you should only trade with money you can afford to lose. Trading Forex and CFDs may not be suitable for all investors, so please ensure that you fully understand the risks involved and seek independent advice if necessary.
Disclaimer:
The above opinions given constitute general market commentary, and do not constitute the opinion or advice of IC Markets or any form of personal or investment advice.
Any opinions, news, research, analyses, prices, other information, or links to third-party sites contained on this website are provided on an "as-is" basis, are intended only to be informative, is not an advice nor a recommendation, nor research, or a record of our trading prices, or an offer of, or solicitation for a transaction in any financial instrument and thus should not be treated as such. The information provided does not involve any specific investment objectives, financial situation and needs of any specific person who may receive it. Please be aware, that past performance is not a reliable indicator of future performance and/or results. Past Performance or Forward-looking scenarios based upon the reasonable beliefs of the third-party provider are not a guarantee of future performance. Actual results may differ materially from those anticipated in forward-looking or past performance statements. IC Markets makes no representation or warranty and assumes no liability as to the accuracy or completeness of the information provided, nor any loss arising from any investment based on a recommendation, forecast or any information supplied by any third-party.
Will Neymar Break Out the Price Action of Santos To the moon.
Neymar did return to Santos, the energy around the club has exploded.
He has: 📸 Instagram: approximately 231.4 million followers
🐦 Twitter (X): approximately 64 million followers
🔥 Fan engagement is surging: Social media growth, merchandise sales, and matchday hype have all increased.
⚽️ On-field performance is matching the hype:
In their last match, Santos won 3–1, with Neymar scoring 2 goals, reminding fans of his legendary form.
📅 Next match this Sunday could further drive visibility and excitement — both for fans and investors.
💰 What’s Driving the Coin's Value?
The Santos fan token isn’t just hype — it has real utility:
🎟️ Buy match tickets using the token.
🛍️ Purchase merchandise directly from the official club store.
🗳️ Participate in fan votes and club decisions.
📈 Outlook: Can We Hit $4.60?
With Neymar back, the spotlight is back on Santos. As attention increases:
⚡️ Demand for the token may spike.
💎 Whales and fans alike are accumulating.
📊 The chart shows strong potential for a break, and $4.60 could be the next big target if momentum holds.
👉 Stay tuned. Santos might just be going to the moon, and next break can be $4.60
Next match is Sunday with Neymar.

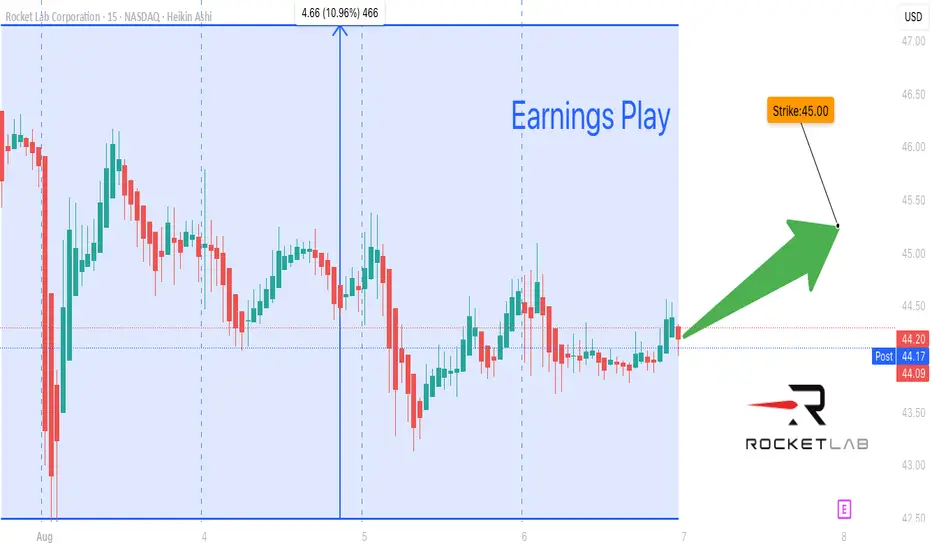
RKLB Earnings Bet: Will Rocket Lab Blast Off After August 7?
### 🚀 RKLB Earnings Bet: Will Rocket Lab Blast Off After August 7? 🚀
**🔥 75% Bullish Confidence | IV Rising | \$45C Looking Juicy!**
📊 **Earnings Play Breakdown – August 6, 2025**
🧠 **Model Summary:**
* ✅ *Revenue Growth: +32.1% YoY*
* 🚨 *Still Unprofitable (-44.3% margin)*
* 📉 *Oversold RSI: 30.10 (Bounce Setup?)*
* 🏗️ *Heavy R\&D Drag – But Long-Term Tailwinds*
💥 **Options Heat:**
* \$45C ➡️ Heavy Volume @ \$2.27
* Implied Move: \~5%
* Call/Put Flow: Bullish Lean
* IV Rank: 75% 🚨
📈 **Suggested Trade:**
> 🟢 **RKLB 45C (Aug 8 Expiry)**
> 🎯 Entry: \$2.27 | Exit Target: \$4.54+
> 📉 Stop: \$1.14 | RR: 3:1+
> 📆 Enter: Before Earnings (Aug 7, AMC)
---
🧠 **Why It’s Hot**
> RKLB is down, oversold, and loaded with short interest — but earnings could ignite a squeeze. High IV, sector tailwinds, and bullish flow = setup worth watching.
---
📌 **Hashtags (for visibility)**
`#RKLB #EarningsPlay #RocketLab #OptionsTrading #HighIV #BullishSetup #SpaceStocks #VolatilityPlay #CallOptions #TradingView`
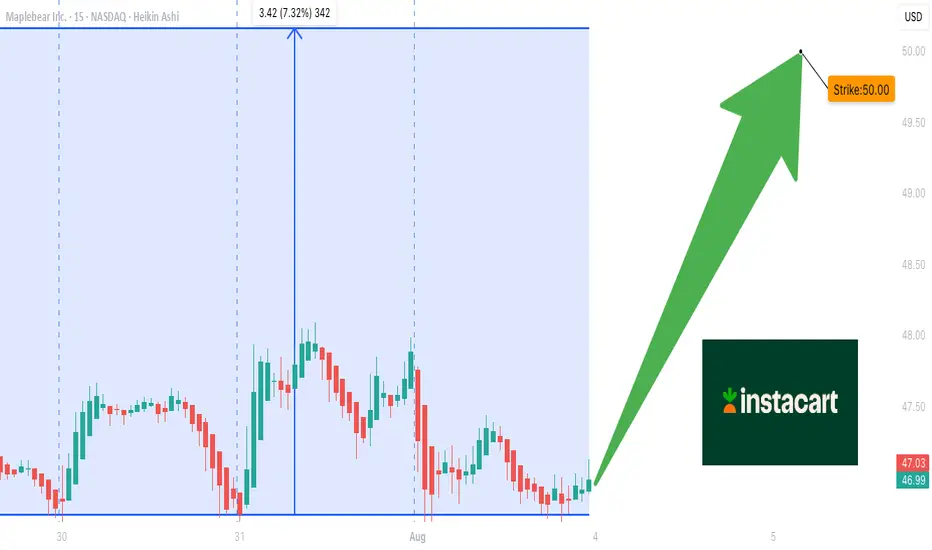
CART Life Time Opportunity
### 🚀 \ NASDAQ:CART Weekly Setup (Aug 5–9) 🚀
**Bullish Flow Detected | C/P Ratio: 3.77 | Confidence: 65%**
🧠 **AI Consensus Highlights:**
🔹 **Grok/xAI**: Institutional flow favors calls
🔹 **Gemini/Google**: Mixed momentum, bullish options bias
🔹 **Claude/Anthropic**: Bearish divergence in price/volume
🔹 **Llama/Meta**: Slightly bullish, calls preferred
🔹 **DeepSeek**: Mixed → No-trade (caution)
---
### 📊 Trade Idea (0DTE Friendly)
**Type**: Long Call (Naked)
**Strike**: `$50`
**Expiry**: `Aug 8`
**Entry**: `$0.90`
**Profit Target**: `$1.20` (+33%)
**Stop Loss**: `$0.45` (-50%)
**Position Size**: 1 Contract
**Confidence**: 65%
**Entry Timing**: Market Open
---
### 🔥 Why This Trade?
✅ 3.77 Call/Put Ratio
✅ Strong call-side OI + favorable flow
⚠️ Mixed RSI (Daily rising, Weekly falling)
⚠️ Volume may indicate prior distribution
---
📌 **Risk Note**: Moderate time decay. Monitor RSI daily.
🎯 **Goal**: Quick 30–100% premium win on call pop.
📅 Trade Window: **Aug 5–8**
---
✅ Drop your thoughts 👇
🔁 Repost if you're watching \ NASDAQ:CART
📈 Follow for daily AI-synced flow setups
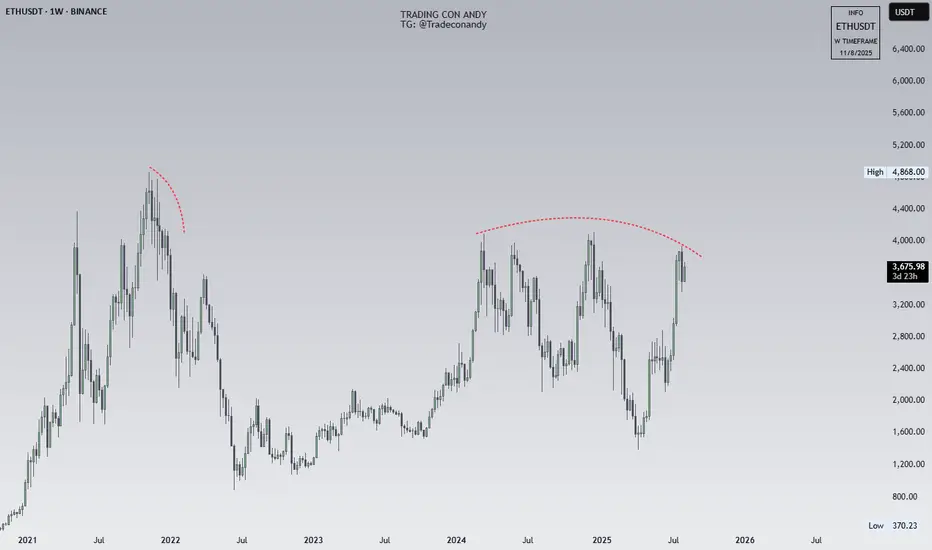
Ethereum ONLY UPBINANCE:ETHUSDT.P At any moment this goes above $4000, don't say I didn't warn you, a giant bullish candle is coming, there's too much liquidity above.
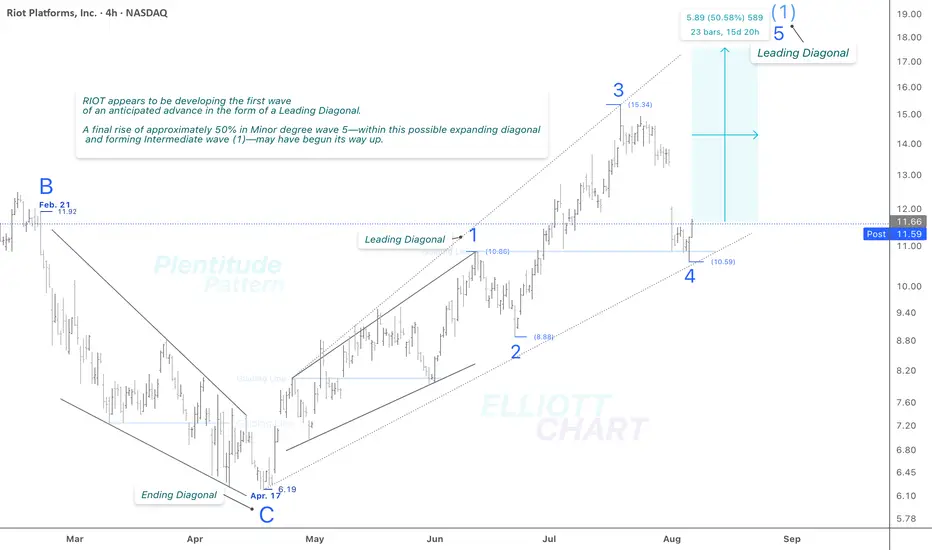
RIOT / 4hNASDAQ:RIOT appears to be developing the first wave of an anticipated advance in the form of a Leading Diagonal, suggesting the early stages of a bullish long-term structure.
A final push higher of approximately 50% in Minor degree wave 5—within this potential expanding diagonal, forming Intermediate wave (1)—may now be underway.
NASDAQ:RIOT CRYPTOCAP:BTC BITSTAMP:BTCUSD MARKETSCOM:BITCOIN
#CryptoStocks #RIOT #BTCMining #Bitcoin #BTC
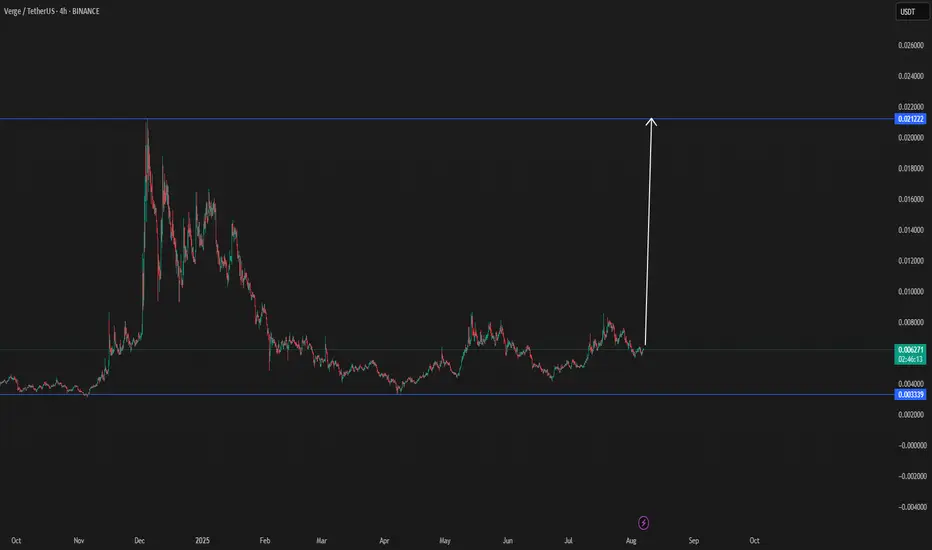
XVG (VERGE) BACK TO OLD TIMES up $0,01There is new data that shows an increase in interest of the verge increase.
This could mean a new return to the up $0,01 price action
I did expect before the floki increase from start to end, and expecting verge to taking the same way.
Last break was able to do in 2 days and 16H
Cup & handleCup & Handle Formation Expected.
Crossing & Sustaining the Resistance level may lead it towards new highs.

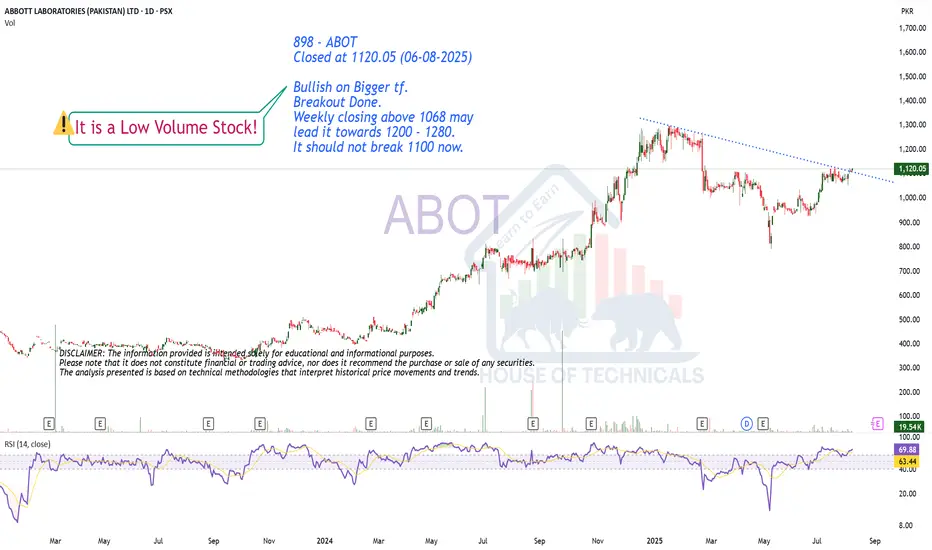
Breakout!898 - ABOT
Closed at 1120.05 (06-08-2025)
Bullish on Bigger tf.
Breakout Done.
Weekly closing above 1068 may
lead it towards 1200 - 1280.
It should not break 1100 now.
CryptoWolfy - Why you should all buy $Intel right now🔍 Why Intel Is a Good Buy Right Now
1. Strategic Leadership & Restructuring
Intel’s new CEO, Lip-Bu Tan, has initiated a bold turnaround strategy focused on financial discipline and operational efficiency 1.
The company is cutting unnecessary capital expenditures and streamlining its foundry operations, aiming to become a more agile and focused organization 2.
2. AI & Chip Innovation
Intel is investing heavily in AI accelerators and energy-efficient chips, positioning itself to compete with NVIDIA and AMD in emerging AI workloads 3.
Its Xeon 6 CPUs are already being used in NVIDIA’s DGX B300 systems, showing early traction in high-performance computing 2.
3. Domestic Manufacturing Advantage
With most of its chip-making facilities in the United States, Intel is better positioned to weather geopolitical tensions compared to competitors like TSMC and Samsung, which have exposure to China 3.
4. Financial Discipline & Cost Optimization
Intel is targeting $17 billion in non-GAAP operating expenses for 2025 and has already reduced its workforce by 15% 2.
It’s consolidating operations and slowing construction in less strategic areas to align spending with demand.
📈 Why Intel Could Rebound to $50–$60
1. Historical Valuation & Recovery Potential
Intel traded at $60 just a few years ago. A return to that level would require a combination of revenue growth, margin recovery, and improved investor sentiment 4.
2. Revenue Growth Scenario
If Intel can grow revenues by 12% annually, it could reach $65 billion by 2026, up from $52 billion in 2024 4.
This growth would be driven by new chip launches like Lunar Lake and Arrow Lake, which use advanced 3nm processes from TSMC.
3. Margin Expansion & P/E Multiple
Improving margins and a return to profitability could justify a higher price-to-earnings (P/E) multiple, potentially pushing the stock toward the $50–$60 range 4.
4. Analyst Optimism
Some analysts have set price targets as high as $62, reflecting a potential 200%+ upside from current levels 3.

USDJPY BUY IDEA1. Ascending Channel Structure
Price has been respecting a rising channel for several weeks.
Currently testing channel support (lower trendline).
This suggests a critical decision point: bounce or break.
2. 200 EMA (likely)
Price is hovering just above a long-term moving average, acting as dynamic support.
A clean break below this could trigger bearish momentum.
3. Support & Resistance Zones
A gray demand zone aligns with recent consolidation (support area).
Price is hovering near this demand zone, meaning buyers could step in here.
Overhead resistance (at ~151.045) marks the final target zone for the long setup.
4. Long Position Markup
A buy setup is marked with:
Entry: Around 147.150
Stop Loss: Around 146.385
Take Profit: 151.045
Risk-Reward Ratio: ~1:5 (very favorable)
5. Bearish Candlestick Pressure
Recent candles show multiple rejections and pressure near structure.
But no clean break below the trendline or EMA yet.

GALAUSDTPhase 1: Breakout from FVG
• Break above the major FVG zone at $0.028–0.030 is crucial.
• A successful breakout and retest could trigger momentum.
• This marks the beginning of a structural shift.
⸻
Phase 2: Structural Resistance
• Key levels to test:
• $0.0345 – historical local top.
• $0.038 – key supply zone.
• Market may consolidate or form a bullish flag before the next move.
⸻
Phase 3: Mid-run Rally
• Break above $0.038 opens the way toward:
• $0.042 – $0.045 resistance block.
• Expect light pullbacks along the way.
⸻
Phase 4: Acceleration Phase
• Once above $0.045, momentum strengthens.
• Eyes on:
• $0.052
• Followed by $0.058 – $0.060 – a strong psychological and structural zone.
⸻
Phase 5: Push to $0.08
• If price closes confidently above $0.060:
• We could see a run to $0.067 – $0.070
• Then : $0.078 – $0.080
Follow me 😉

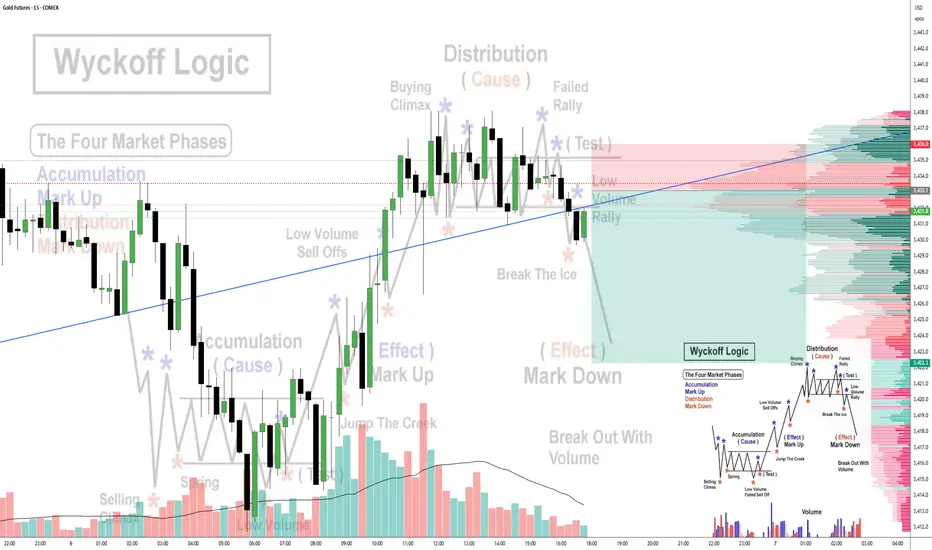
06-08-25 GC Wyckoff 5 minLet just see where this is going, same pattern on Daily and 5 min
Any of them could go up and this still would be Wyckoff theory, except Distribution would be called Reaccumulation
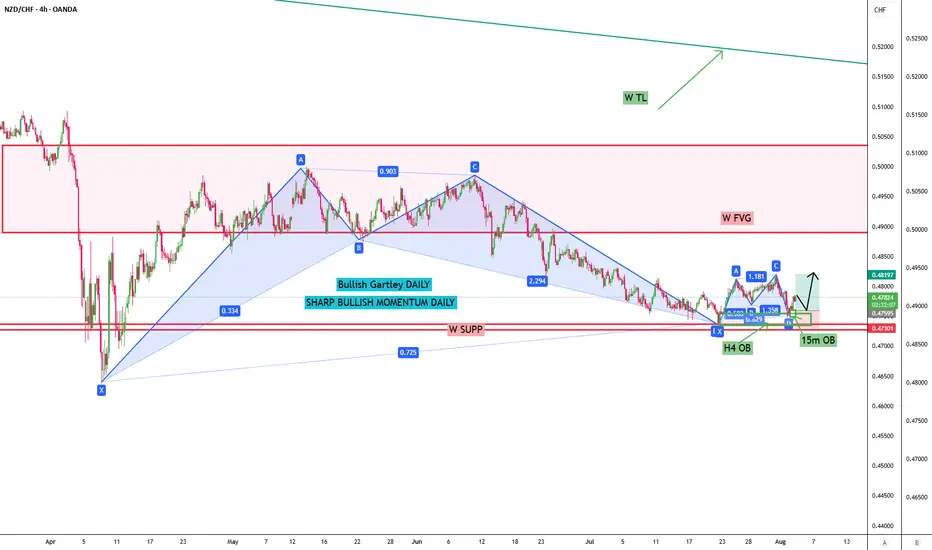
NZDCHF POTENTIAL BULLISHWeekly chart shows NZDCHF has bounced off its minimum since 2004, with RSI showing just recovering from the OS area. Price has bounced back from the weekly resistance around 0.47400. This bounce has formed a bullish Gartley on the daily chart and another bullish Gartley on the H4 timeframe. It was supported by an OB on H4 and in micro scale engulfing candles.
I expect that the 20 MA will reject the price on H4 BB since multiple bearish candles passed the lower band.
Would consider the entry where the 15m OB was touched by a rejected wick around 0.47600. TPs may be around points A and C on the Gartley pattern, and SL below the X point.
Let's see how it goes, and fingers crossed, the pending gets activated.
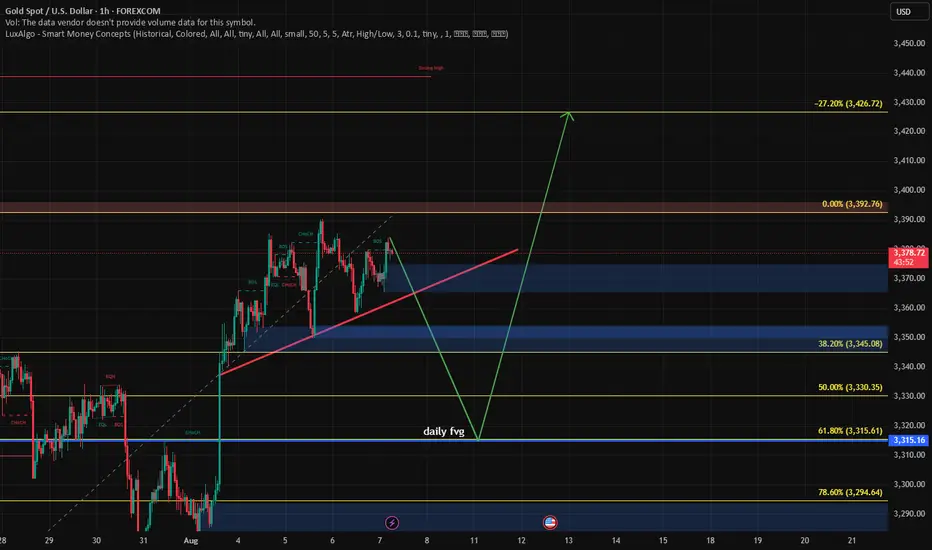
xau usd a probable scene Market can sweep its trend line liquidity and could take another buy entry at the given level.. and also can go to the target ...its just for an educational and study purpose , i dont recommend to take trade at this point. just watch and see
XAUUSDStart of Phase D in the distribution structure
Thanks to the esteemed professor, Professor Ramtia Seddiqi.
ARAM PISHBIN

BTC/USD - KEY SUPPORT BREAKOUT IN FOCUS!Bitcoin is currently trading near a critical support level, and price action is setting up for a decisive move.
📉 Bearish Scenario (Primary Bias):
Key support at ~$117,800 has broken, signaling a shift in market sentiment.
If the breakdown holds, we could see a strong bearish continuation toward the demand zone around $111,000.
Price may retest the broken support before the next leg down.
📈 Bullish Scenario (Alternate):
If buyers regain control and reclaim the broken support, BTC could retest the strong high at $120,700, and possibly push toward the supply zone near $123,000.
🔎 Structure Highlights:
Supply Zone: $122,000 – $123,000
Demand Zone: $110,000 – $111,500
Key Resistance/Support: $117,800
Strong High: ~$120,700
📌 Watch Closely:
Price behavior on the retest of the broken support
Bearish confirmation for downside continuation
Bullish reclaim for short-term recovery
A decisive move is near – be ready for both scenarios with tight risk management!

PENGUUSDT Bearish Setup – Supply Zone Rejection IncomingPrice is currently consolidating just below a strong supply zone (highlighted in blue), where we previously saw an aggressive rejection. The recent price action shows a potential lower high forming under resistance, suggesting weakening bullish momentum.
🔑 Key Levels:
🔵 Supply Zone Resistance: 0.035800 – 0.036000
🔵 Minor Support: 0.034364
🔵 Demand Zone Target: 0.032800 – 0.032918
🧠 Bias: Bearish
I expect a potential fakeout to the upside, tapping into the supply zone one last time before a sharp reversal. A break and close below 0.034364 could trigger further downside toward the demand zone.
📌 Trade Idea:
🔺 Wait for a sweep of the supply zone followed by bearish confirmation
🔻 Target 1: 0.034364
🔻 Target 2: 0.032800 (Demand zone)
❌ Invalidate if price closes strongly above 0.036000
📊 Strategy Used:
Supply & Demand
Liquidity Sweep
Smart Money Concepts
📣 Disclaimer: This is not financial advice. Do your own research before entering any trades.
#PENGUUSDT #CryptoTrading #SmartMoney #SupplyAndDemand #FrankFx #TradingViewAnalysis #BearishBias #LiquiditySweep #PriceAction


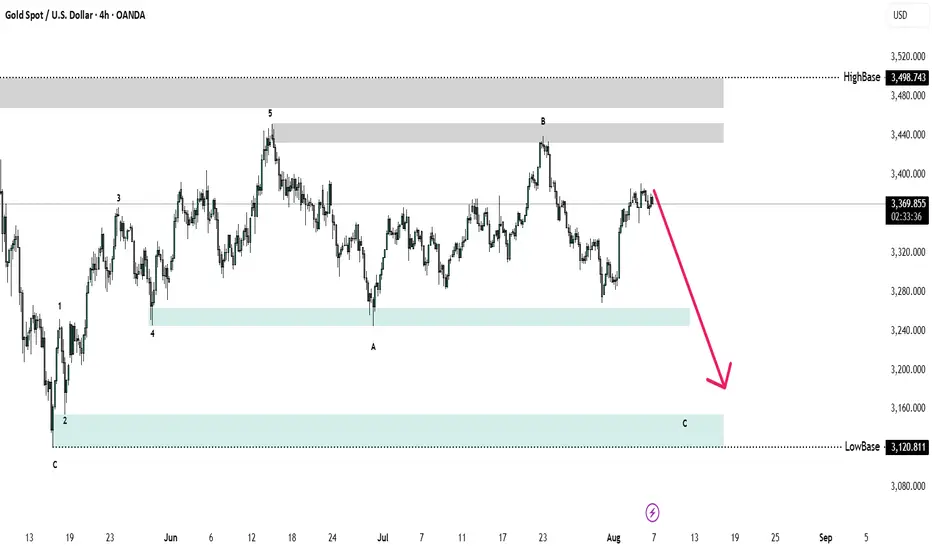
Gold Selling Plan!1. We have strong trading range in Daily and 4H this mean market can move up and down anytime and grab liquidity.
2. Analyzing waves going to show there is a downtrend structure as correction but if you look it in weekly its always upward for gold.
3. as market couldnt pass 3452 its going to 3152
if you trade daily careful market moves extremly crazy as we have big trading range in daily.
BITCOIN ready to fly.Bitcoin is going to fly the following 3 weeks arriving till 143k$-145k$
In September will see the price going down to visit the 125k$ level, and UPTOBER will bring us the last surprise, a bitcoin arriving till 167k$
And that´s all.
Good luck to everyone.
We´ll see 65k$ ending 2026 or begining 2027.
