GOLD CAN FALLING SOONAccording to M15 analysis gold market in flying pressure from last day now market maybe go down from RESISTANCE ZONE if you want then go sell from RESISTANCE ZONE is best for you Dont be greedy use money management
TRADE AT YOUR OWN RISK
REGARD ALBERT
Harmonic Patterns

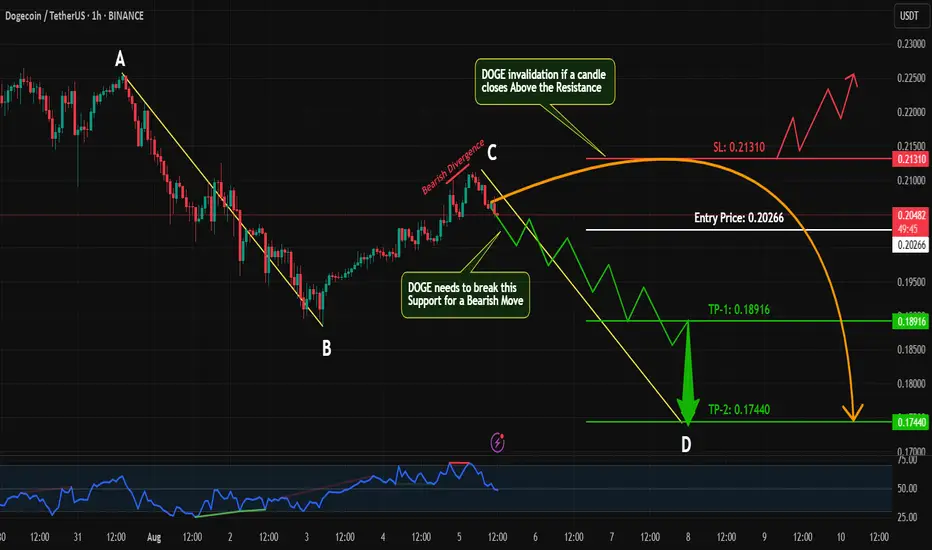
DOGE Bearish Setup in Progress |AB=CD Pattern+Bearish Divergence Hey Traders!
#DOGE/USDT is currently showing signs of a bearish continuation on the 1H timeframe 📉. Here's why I'm watching this closely:
🔹 AB=CD Harmonic Pattern:
The AB leg is already complete, and the price action is now progressing toward forming the CD leg — a classic harmonic setup suggesting further downside.
🔹 Bearish Divergence on RSI:
While the price made a higher high, RSI failed to confirm — signaling weakening momentum and potential reversal ahead.
🔹 Key Support Level in Focus:
I’m watching the previous minor support zone for confirmation. If price breaks and retests this level, it could be a great entry point for a short trade with solid risk-reward.
📌 Trade Plan:
✅ Wait for confirmation below support
✅ Look for bearish candlestick patterns or breakdown
✅ Enter short with proper risk management (SL just above local highs)
💬 What do you think about this setup? Are you already short on #DOGE or waiting for more confirmation? Drop your thoughts below 👇 and let’s discuss!
If you find this analysis helpful, don’t forget to:
👍 Like
💬 Comment
🔁 Share
📥 Follow for more high-probability setups!
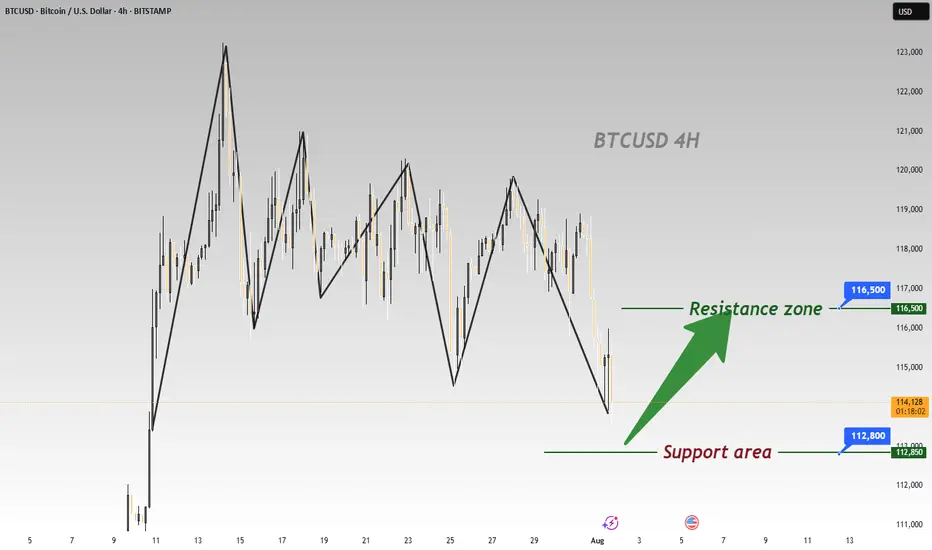
BTC Plummets Post-NFP; Go Long for Rebound to 116500BTC has plummeted significantly under the influence of the non-farm payroll data 📉, and now is an excellent opportunity to go long. Its Support level is around 112800, and according to the current trend, we can wait for a rebound to around 116500.
⚡️⚡️⚡️ BTCUSD ⚡️⚡️⚡️
🚀 Buy@ 113000 - 113800
🚀 TP 114500 - 115500 - 116500
Daily updates bring you precise trading signals 📊 When you hit a snag in trading, these signals stand as your trustworthy compass 🧭 Don’t hesitate to take a look—sincerely hoping they’ll be a huge help to you 🌟 👇
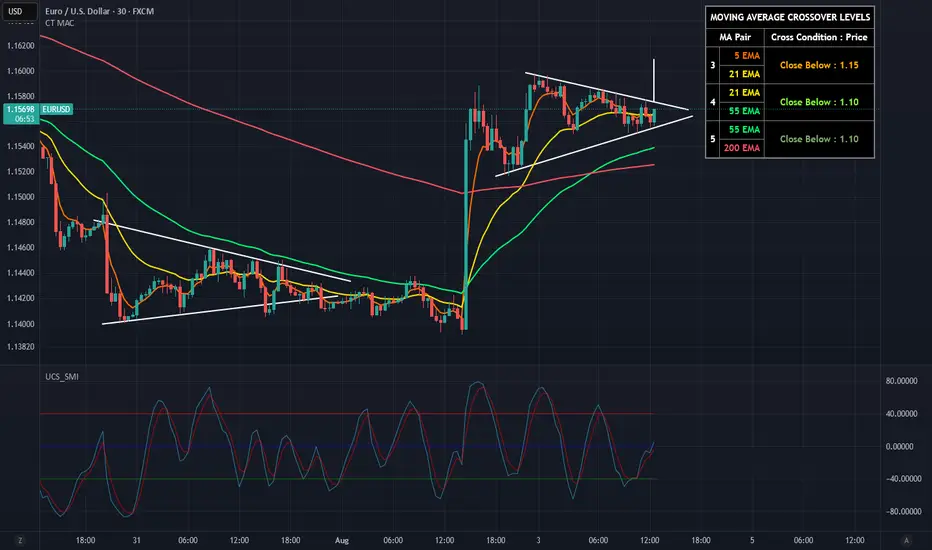
EUR/USD - Short-Term - Triangle Breakout soonI'm currently watching EUR/USD as it's forming an ascending triangle on the lower timeframes. Price has been respecting the lower resistance while printing higher lows - suggesting bullish pressure building up. A breakout above the upper area could trigger a larger move to the upside. My first target for the breakout sits around 1.161 based on the triangle height.
Let’s see if the momentum follows through.
AUD/USD Bearish Setup-Trendline Breakout Signals Potential Drop📉 AUD/USD Bearish Setup – Trendline Breakout Signals Potential Drop!
The AUD/USD pair has broken below a key ascending trendline, signaling a shift in momentum from bullish to bearish.
🔍 Key Highlights:
Price was previously trading within an ascending channel.
Strong resistance was confirmed around the 0.6619 level.
A decisive break of the trendline and the key support zone (0.6500) now points to increased bearish pressure.
Market is currently retesting the broken support zone, which may act as new resistance before the next leg down.
🎯 Target Point: 0.6371
If bearish momentum continues, we anticipate price to move toward the target support zone near 0.6371, offering a solid risk-reward setup.
📌 Watch For: Bearish confirmation on retest + momentum indicators aligning to the downside.

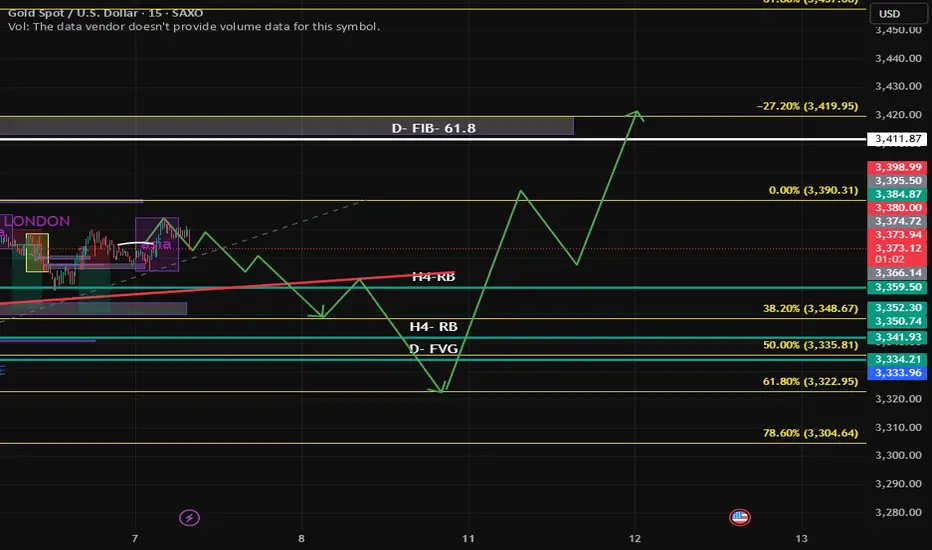
Liquidity Sweep to Drop – XAUUSD Sell Plan🟠 Context Summary
Chart Type: XAUUSD 15M
Pattern Observed: Liquidity sweep and sharp rejection from premium zone.
Label: “Gold Start Melting”
Distribution Zone Targeted
🔽 Sell Plan
✅ Bias: Bearish
📍 Entry Zone (Sell Entry Area):
Entry after price tapped into premium zone (highlighted red box).
Strong bearish engulfing candle confirms rejection.
🎯 Target Zones:
Target 1: 3,368 (top of distribution zone)
Target 2: 3,317 (bottom of distribution zone)
Target 3 (Final): 3,293 (full FVG fill / value area)
⛔ Stop Loss:
Above the swing high that caused the drop.
Suggested: 3,400.50 – 3,403.00
⚙️ Entry Confirmation:
Confirm entry after:
Price closes below small support or consolidation (green zone).
Breakdown retest (if price pulls back).
🧱 Trade Logic
Sweep of Liquidity: Price took out highs and immediately reversed.
FVG Created: Implied institutional selling interest.
Distribution Zone: Forecasting larger move down.
📌 Notes:
Watch for lower timeframe consolidation before continuation.
If price retraces to fill imbalance partially and stalls, consider re-entry.

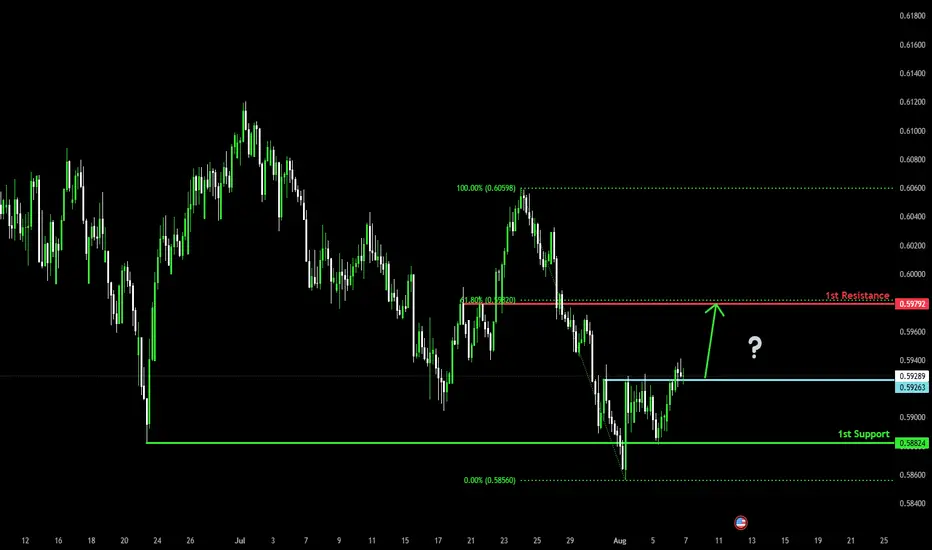
Could the Kiwi bounce from here?The price is falling towards the pivot, which is a pullback support and could potentially rise to the 1st resistance which aligns with the 61.8% Fibonacci retracement.
Pivot: 0.5926
1st Support: 0.5882
1st Resistance: 0.5979
Risk Warning:
Trading Forex and CFDs carries a high level of risk to your capital and you should only trade with money you can afford to lose. Trading Forex and CFDs may not be suitable for all investors, so please ensure that you fully understand the risks involved and seek independent advice if necessary.
Disclaimer:
The above opinions given constitute general market commentary, and do not constitute the opinion or advice of IC Markets or any form of personal or investment advice.
Any opinions, news, research, analyses, prices, other information, or links to third-party sites contained on this website are provided on an "as-is" basis, are intended only to be informative, is not an advice nor a recommendation, nor research, or a record of our trading prices, or an offer of, or solicitation for a transaction in any financial instrument and thus should not be treated as such. The information provided does not involve any specific investment objectives, financial situation and needs of any specific person who may receive it. Please be aware, that past performance is not a reliable indicator of future performance and/or results. Past Performance or Forward-looking scenarios based upon the reasonable beliefs of the third-party provider are not a guarantee of future performance. Actual results may differ materially from those anticipated in forward-looking or past performance statements. IC Markets makes no representation or warranty and assumes no liability as to the accuracy or completeness of the information provided, nor any loss arising from any investment based on a recommendation, forecast or any information supplied by any third-party.
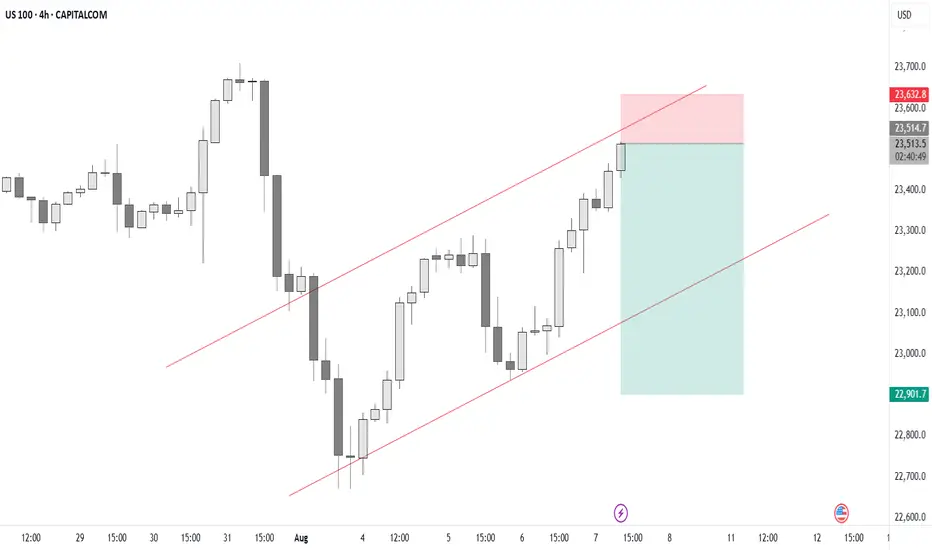
Sell US100US100 Sell idea. This trade setup is based on a bearish flag pattern seen on the 4HR chart. Let us see how price reacts from this resistance.
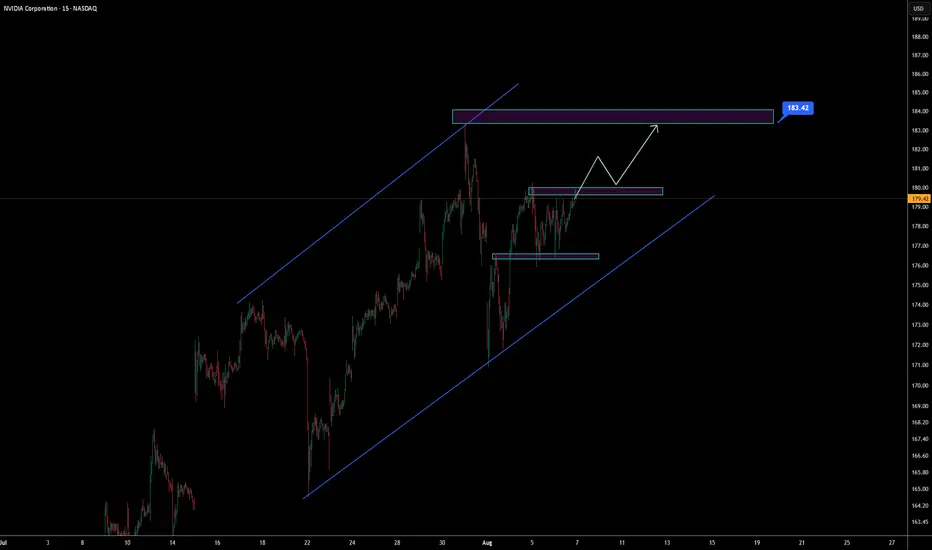
NVIDIA Approaching Breakout – Targeting 183.42 Within AscendingNVIDIA is moving within a well-defined ascending channel.
The price is currently consolidating near a local resistance area, showing signs of bullish continuation.
A breakout above this zone could confirm momentum toward the upper boundary of the channel, with a projected target around 183.42.
Watching for bullish structure and volume confirmation.

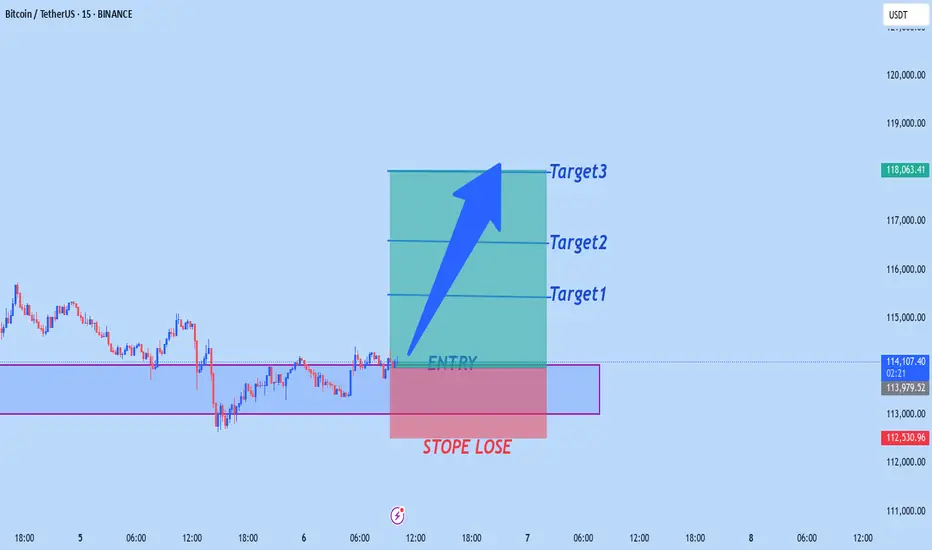
BTCUSD CAN FLY HIGHbtcusd buy from 114,000
target1 115,500
target2 116,500
target3 118,000
Stope lose 112,500
TRADE AT YOUR OWN RISK
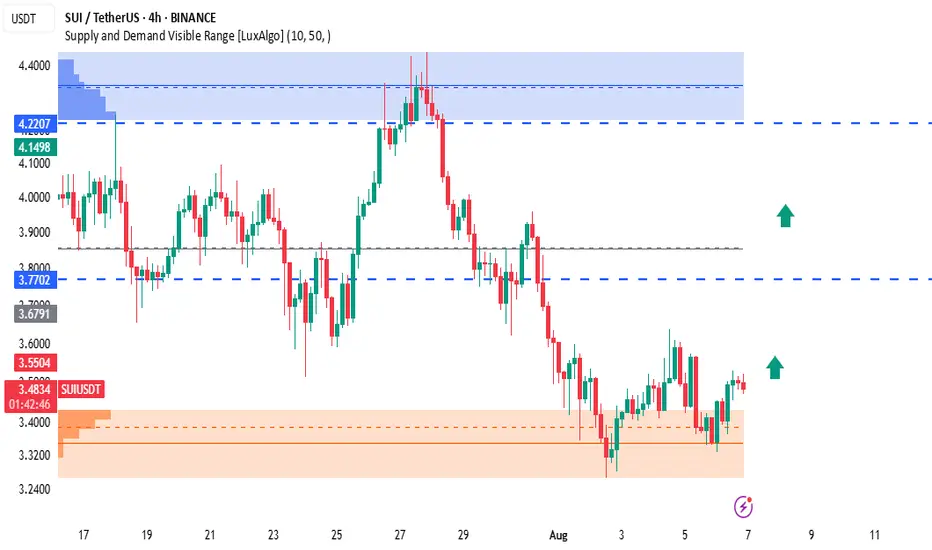
SUI/USDT Bullish Setup – Strong Rejection from Demand Zone!SUI is showing early bullish momentum after rebounding from a solid demand zone between $3.24 – $3.40. Buyers are defending this zone strongly, and price is now forming a higher low on the 4H timeframe, signaling potential upside continuation.
🔍 Technical Breakdown:
Demand Zone (Support): $3.24 – $3.40 (Highlighted in orange)
Current Price: $3.48 (Trading slightly above demand zone, showing bullish structure)
First Resistance (TP1): $3.7702 (prior support turned resistance)
Final Target (TP2): $4.1498 – $4.22 (major supply zone with historical selling pressure)
✅ Bullish Confluences:
Price formed double bottom at the demand zone
Bullish candle structure building up
Visible volume cluster supports bounce (LuxAlgo VRVP)
Clear upside imbalance toward $4.22
📌 Trade Setup:
If price continues to hold above $3.40 and breaks recent highs:
Entry: $3.45 – $3.50 (current breakout range)
SL: Below $3.24 (beneath the demand zone)
TP1: $3.7702
TP2: $4.1498
TP3 (extended target): $4.2207
🧠 Notes:
Watch for breakout above $3.55 for stronger momentum confirmation
Scaling out partially at $3.77 is wise due to previous resistance
Supply zone at $4.22 is a critical decision point
🟢 Bias: Bullish until $3.24 is broken
EURUSD possible bearish for 1.1200#eurusd forming lower high and lower low in daily time frame. Price broke 1.1557 & 1.1447 support level. 1.1738-1788 daily supply zone for sell. there are many different support levels before 1.1200 level i.e. 1.1550, 1.1420, 1.1255 & 1.1200. 1.1430-20 is secure level to book profit in sell trade.

BITCOINTHE daily structure of the bitcoin shows a break out of the daily ascending trendline ,but on 4hrs we are protected by 4hr ascending trendline line ,the daily sr/rs level holds superior opinion of price action than any intraday time frame .so trade with care and know that any key level on 4r/3r can fail while contesting with daily TF and weekly structure.
#bitcoin #btc
MORNING FORECAST LESSONHarnessing the Power of Morning Rituals to Enhance Your Forecasting Skills
The Art of Intuition: How to Read the Signs in Your Morning Forecasting
Creating a Forecasting Vision Board: Stacking Confluences for a Bright Day
The Hidden Connections: How Nature's Patterns Can Influence Your Morning Forecasts
Awakening Creativity Through Morning Confluence Practices for Forecasting Success

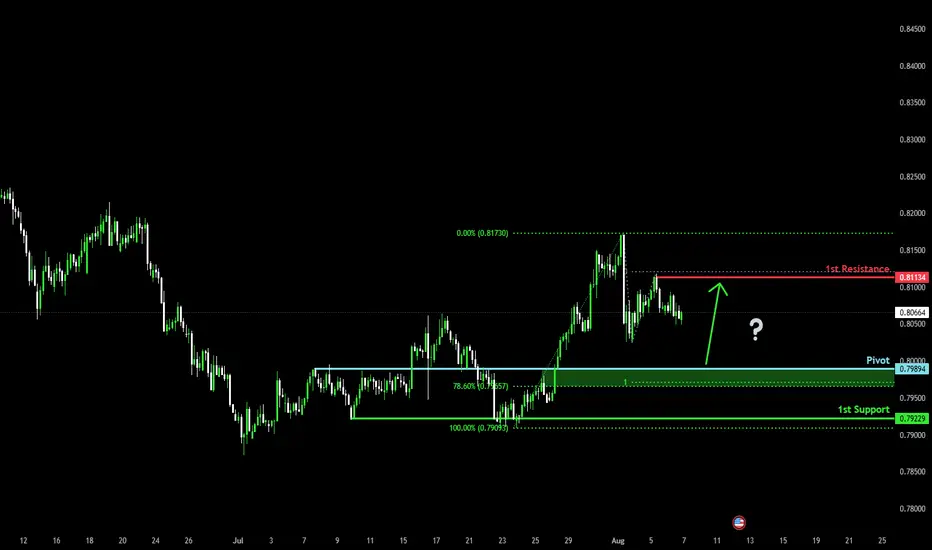
Bullish bounce off?The Swissie (USD/CHF) is falling towards the pivot and could bounce to the 1st resistance which acts as a pullback resistance.
Pivot: 0.7989
1st Support: 0.7922
1st Resistance: 0.8113
Risk Warning:
Trading Forex and CFDs carries a high level of risk to your capital and you should only trade with money you can afford to lose. Trading Forex and CFDs may not be suitable for all investors, so please ensure that you fully understand the risks involved and seek independent advice if necessary.
Disclaimer:
The above opinions given constitute general market commentary, and do not constitute the opinion or advice of IC Markets or any form of personal or investment advice.
Any opinions, news, research, analyses, prices, other information, or links to third-party sites contained on this website are provided on an "as-is" basis, are intended only to be informative, is not an advice nor a recommendation, nor research, or a record of our trading prices, or an offer of, or solicitation for a transaction in any financial instrument and thus should not be treated as such. The information provided does not involve any specific investment objectives, financial situation and needs of any specific person who may receive it. Please be aware, that past performance is not a reliable indicator of future performance and/or results. Past Performance or Forward-looking scenarios based upon the reasonable beliefs of the third-party provider are not a guarantee of future performance. Actual results may differ materially from those anticipated in forward-looking or past performance statements. IC Markets makes no representation or warranty and assumes no liability as to the accuracy or completeness of the information provided, nor any loss arising from any investment based on a recommendation, forecast or any information supplied by any third-party.
AUDJPY Forming Bullish MomentumAUDJPY has recently bounced from a strong demand zone near the 94.50–95.00 region, as seen on the 4H chart. This zone has acted as a key support area in previous price action, and the market is now printing higher lows after rejecting it multiple times. Price is showing bullish momentum, and with buyers stepping in aggressively from this area, we are now anticipating a continuation to the upside toward 96.80 and beyond.
From a fundamental perspective, the Australian dollar is gaining traction due to recent upbeat economic sentiment, especially as the Reserve Bank of Australia (RBA) maintains its data-dependent stance. Although rate hikes are on pause, the RBA is leaving the door open for further tightening should inflation remain sticky. On the flip side, the Japanese yen remains weak across the board, with the Bank of Japan maintaining ultra-loose monetary policy and no near-term signals of change. This divergence in central bank policy continues to support bullish pressure on AUDJPY.
Technically, the risk-reward profile is favorable. The bullish engulfing candles off the demand zone suggest strong buyer intent. A break and hold above the intraday resistance around 96.00 would confirm bullish continuation, with upside targets stretching toward 96.80–97.20. Meanwhile, stops can be managed tightly below 94.50, keeping the setup clean and structured. With the yen facing broad weakness and Aussie resilience in play, this pair offers momentum trading potential.
Overall, AUDJPY is primed for upside as long as the support zone holds. Traders should monitor price action around current levels for bullish confirmation and scale in on minor pullbacks. This setup aligns with market sentiment and fundamental divergence, creating a high-probability opportunity in the current forex landscape.

XAU usd , a possible route mapplease go thru the path, watch and do act according to ur view as well.. good luck..
please note: this information has to take as an educational purpose. entering to this trade must be at ur risk..
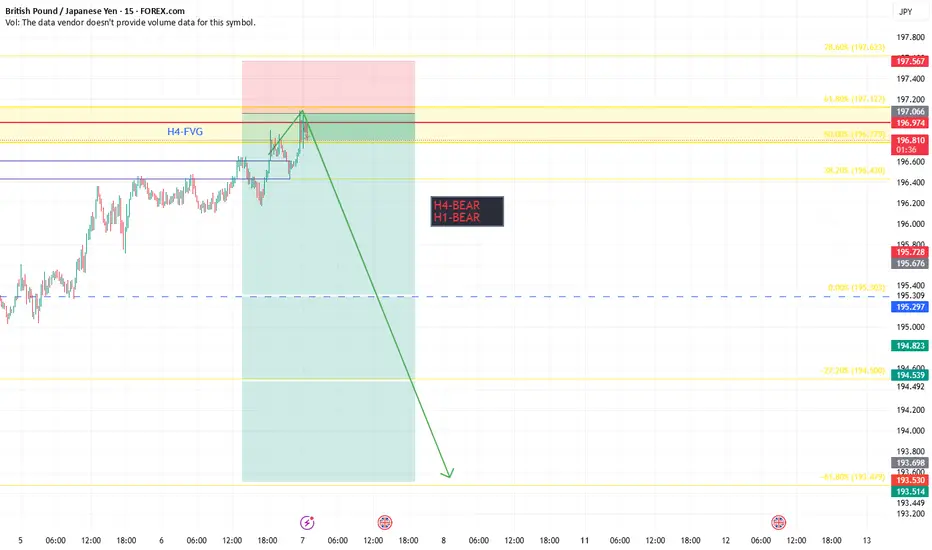
GBP JPY SELL SETUPSee the chart for GBP JPY. came at the zone and expecting a sell continuation ..see the targets (tp-1 & tp2) trade this as swing.. do comment Ur feedback if u like my charting and analysis.
if you are interested to join my personal mentorship group which is i planning to expand ..then please join . i will assist you with more trade setups and real trade information.
message me to @thanz_123
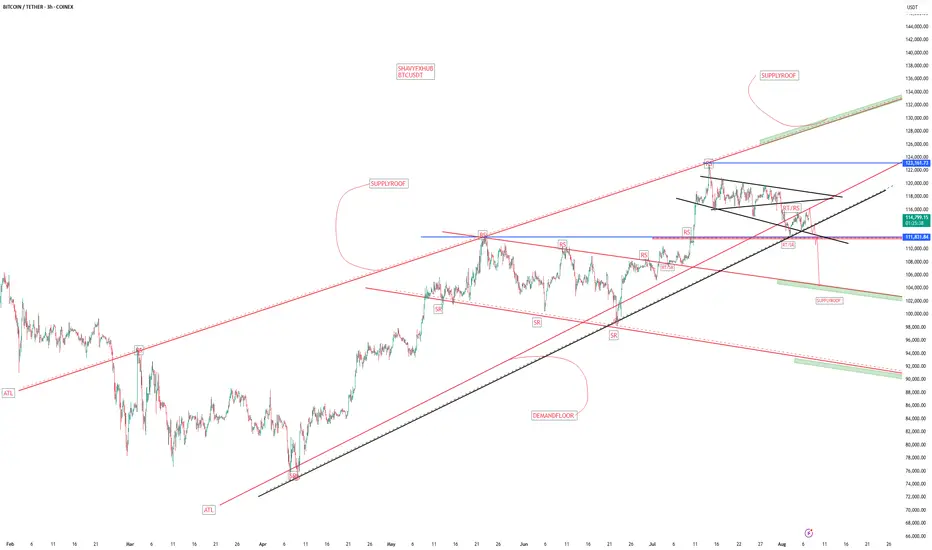
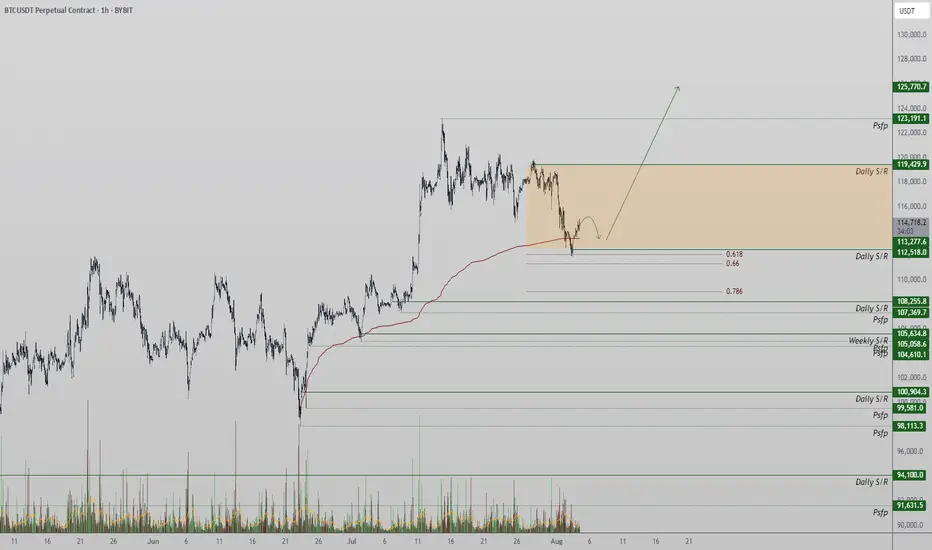
Bitcoin Tests Major Support at $112,500Bitcoin is currently in a local downtrend, with price now testing a major support zone around $112,500. This level, backed by multiple technical confluences, may serve as the base for a potential reversal if defended on lower timeframes.
Price action has been drifting lower over the past sessions, finding its way into a key support zone defined by the 0.618 Fibonacci retracement, the blue upward trendline, and prior structure. The $112,500 region now acts as the immediate level to hold from an intraday perspective. If bulls are able to defend this zone and volume confirms participation, the probability of a rotation higher toward $123,000 increases significantly.
Key Technical Points:
- Support at $112,500: Aligned with 0.618 Fibonacci, trendline support, and structural pivot
- Intraday Confirmation Required: Holding this level on lower timeframes improves the
probability of reversal
= $123,000 Target in Sight: Technical target for rotation if a bottoming structure forms and holds
From a short-term perspective, Bitcoin has clearly shifted into a local downtrend, creating a sequence of lower highs and lower lows. However, the current area around $112,500 presents a strong confluence of support that could interrupt this trend. This zone includes the 0.618 Fibonacci retracement from the most recent swing move, a respected upward trendline (blue), and a previous structural pivot. Together, these elements increase the probability of a bounce—provided price can stabilize.
At this stage, price may still trade sideways and consolidate within this region to form a bottoming structure before any meaningful move higher. For traders, this means confirmation is key. Watching for multiple intraday candle closes above the support zone, paired with an increase in bullish volume, would suggest that demand is building. Only then would the setup favor an entry targeting the local highs.
The upside technical target from this area remains at $123,000, representing the recent swing high and a clear resistance level. A reclaim and rotation to this level would validate the support zone and reintroduce the bullish bias in the short term. Until that occurs, however, price could continue to consolidate, especially if volume remains low or indecisive.
The overall structure still leans constructive, as long as $112,500 holds. A breakdown below this level would weaken the short-term setup and potentially open the door to deeper downside probing. But for now, the region remains a high-probability bounce zone on lower timeframes.
What to Expect in the Coming Price Action
Bitcoin is testing critical intraday support at $112,500. If this level holds with volume confirmation and intraday structure aligns, a rotation toward $123,000 is likely. However, price may continue consolidating at this level before a clear direction forms.
ETH/USDT Short Setup – Bearish Rejection from Supply Zone!Ethereum is showing signs of weakness after getting rejected from a key 1H supply zone between $3,680 – $3,720. Price failed to break above this level and has started pulling back, suggesting potential downside momentum.
🔍 Technical Breakdown:
Supply Zone (Resistance): $3,680 – $3,720 (Highlighted in blue)
Current Price: $3,666 (Rejection candle forming below resistance)
Immediate Support (TP1): $3,552 (previous structure support)
Key Demand Zone (TP2): $3,417 – $3,342 (strong buying interest previously seen here)
❌ Rejection Evidence:
Price tapped into high-volume area and sold off
Lower highs forming after rejection
Bearish engulfing candles starting to show on 1H
📌 Trade Idea:
If price stays below $3,680 and breaks below $3,640:
Entry: $3,660 – $3,670 (current price zone)
SL: Above $3,720 (above supply zone)
TP1: $3,552
TP2: $3,417
TP3 (Max target): $3,342
🧠 Notes:
Watch for clean break of $3,552 to confirm momentum
Retest of broken support could offer a second entry
ETH remains volatile – use good risk management
🔴 Bias: Bearish Until $3,720 Is Broken

Prediction Xxauusd keeps rejecting of this box on the 3 hour if we see a close above we will see the 90s

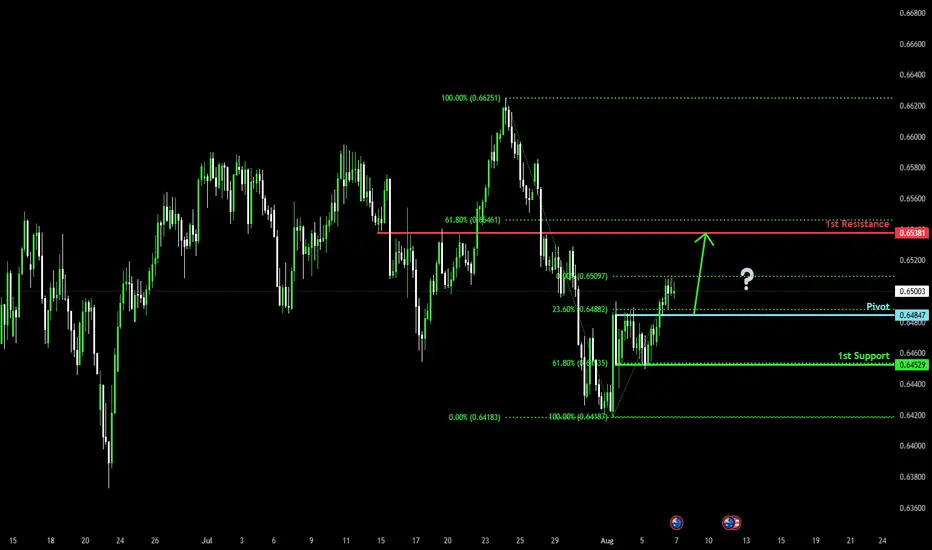
Bullish bounce off pullback support?The Aussie (AUD/USD) is falling towards the pivot which is a pullback support and could bounce to the 1st resistance.
Pivot:0.6484
1st Support: 0.6452
1st Resistance: 0.6538
Risk Warning:
Trading Forex and CFDs carries a high level of risk to your capital and you should only trade with money you can afford to lose. Trading Forex and CFDs may not be suitable for all investors, so please ensure that you fully understand the risks involved and seek independent advice if necessary.
Disclaimer:
The above opinions given constitute general market commentary, and do not constitute the opinion or advice of IC Markets or any form of personal or investment advice.
Any opinions, news, research, analyses, prices, other information, or links to third-party sites contained on this website are provided on an "as-is" basis, are intended only to be informative, is not an advice nor a recommendation, nor research, or a record of our trading prices, or an offer of, or solicitation for a transaction in any financial instrument and thus should not be treated as such. The information provided does not involve any specific investment objectives, financial situation and needs of any specific person who may receive it. Please be aware, that past performance is not a reliable indicator of future performance and/or results. Past Performance or Forward-looking scenarios based upon the reasonable beliefs of the third-party provider are not a guarantee of future performance. Actual results may differ materially from those anticipated in forward-looking or past performance statements. IC Markets makes no representation or warranty and assumes no liability as to the accuracy or completeness of the information provided, nor any loss arising from any investment based on a recommendation, forecast or any information supplied by any third-party.