Gold (XAU/USD) - 2H Wave Setup + Scalp Opportunities# 🔻 Gold (XAU/USD) - 2H Wave Setup + Scalp Opportunities Ahead
**By: Mohsen Mozaffarinezhad**
📅 August 7, 2025 | ⏰ Valid through August 8 (End of NY Session)
⏱ Timeframe: 2H
📌 Method: Elliott Wave + Supply/Demand + SSL Hybrid Confirmation
---
## 🧠 Market Context:
Price has completed a **strong bullish leg** and is currently forming a classic **(a)-(b)-(c)** corrective pattern. We are now between **point (b)** and the potential completion of **(c)**. The broader market is expected to **retest the lower demand POI**, possibly before resuming the uptrend.
---
## 🔎 Technical Highlights:
- 📉 Bearish correction in progress: (b) → (c)
- 📦 Major **Supply** above 3,390 – acted as rejection point
- 🟦 Strong **Demand Zone**: 3,345 – 3,320
- 🔁 Price forming a potential **ABC correction**
- 🔔 **Point of Interest (POI)** near 3,350 may offer entry confirmation
- 💠 **SSL Channel**: Currently bearish crossover
- 🔄 **RQQ, HT, MACD, RSI**: Bearish/neutral, waiting for reversal signals
- 📊 **Volatility (Vol %ile)**: 67%
- 🎯 **ATR**: 13.52 (2H – medium range)
- 🧯 **Risk Level:** Normal
---
## 🟢 Scalp Strategy:
Scalp traders can take advantage of both micro-swings at **points (a) and (b)** using lower TF (M5/M15) confirmations:
### 🎯 Scalp Buy:
- 📍 Entry: Near 3,345–3,350
- 🛑 SL: Below 3,340
- 🎯 TP: 3,365–3,370 (short-term liquidity sweep)
- ⚠️ Only on bullish SSL + RSI divergence (M5)
### 🎯 Scalp Sell:
- 📍 Entry: Near 3,375–3,380 (**point b rejection**)
- 🛑 SL: Above 3,385
- 🎯 TP: 3,360 then 3,350
- ⚠️ Use Heikin-Ashi reversal + SSL confirmation
---
## 📌 Mid-Term Outlook (Swing):
If price reaches **point (c)** around the **lower demand zone** and reacts with bullish structure (BOS, CHoCH), we anticipate a strong rally toward:
- **TP1:** 3,385
- **TP2:** 3,400
- **TP3:** 3,420 (next macro supply)
---
## ⚠️ Notes:
> This setup remains **valid until the end of NY session, August 8**.
> Wait for **clear confirmation** before execution.
> All scalps are suggested with **tight risk management**.
_Analysis by Mohsen Mozaffarinezhad | Educational Purposes Only_
---
#gold #xauusd #elliottwave #supplydemand #sslhybrid #scalping #smartmoney #tradingview #forexanalysis
Harmonic Patterns

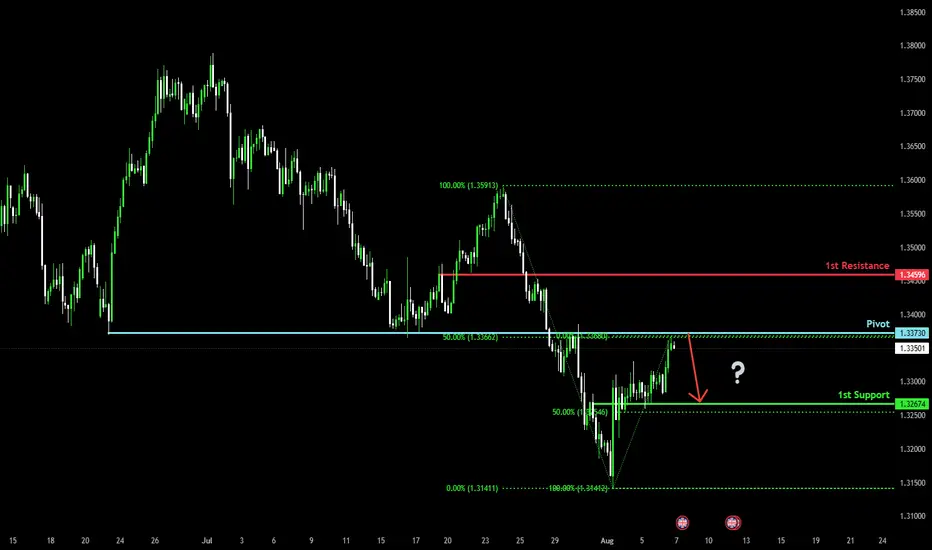
Bearish reversal?The Cable (GBP/USD) is rising towards the pivot which acts as an overlap resistance that lines up with the 50% Fibonacci retracement and could drop to the 1st support.
Pivot: 1.3373
1st Support: 1.3267
1st Resistance: 1.3459
Risk Warning:
Trading Forex and CFDs carries a high level of risk to your capital and you should only trade with money you can afford to lose. Trading Forex and CFDs may not be suitable for all investors, so please ensure that you fully understand the risks involved and seek independent advice if necessary.
Disclaimer:
The above opinions given constitute general market commentary, and do not constitute the opinion or advice of IC Markets or any form of personal or investment advice.
Any opinions, news, research, analyses, prices, other information, or links to third-party sites contained on this website are provided on an "as-is" basis, are intended only to be informative, is not an advice nor a recommendation, nor research, or a record of our trading prices, or an offer of, or solicitation for a transaction in any financial instrument and thus should not be treated as such. The information provided does not involve any specific investment objectives, financial situation and needs of any specific person who may receive it. Please be aware, that past performance is not a reliable indicator of future performance and/or results. Past Performance or Forward-looking scenarios based upon the reasonable beliefs of the third-party provider are not a guarantee of future performance. Actual results may differ materially from those anticipated in forward-looking or past performance statements. IC Markets makes no representation or warranty and assumes no liability as to the accuracy or completeness of the information provided, nor any loss arising from any investment based on a recommendation, forecast or any information supplied by any third-party.
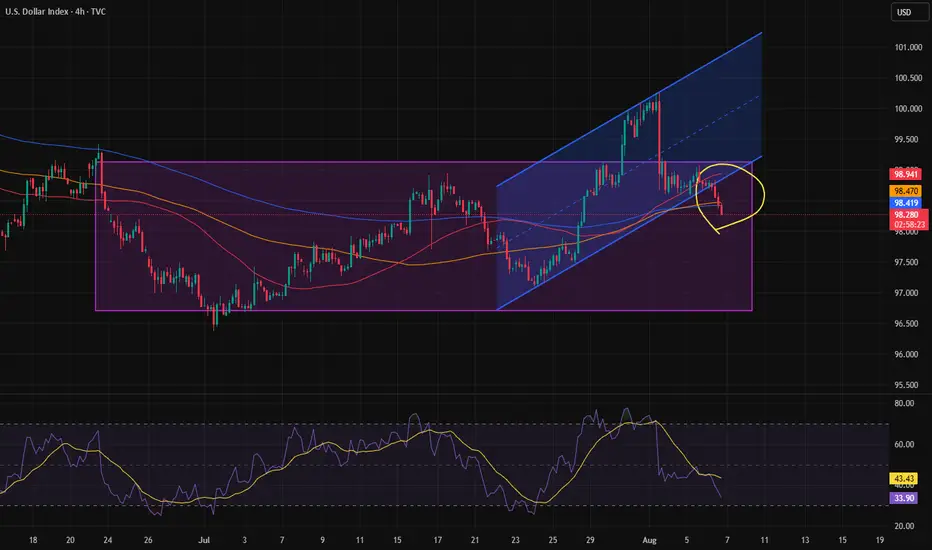
Dollar dropWith the break of the ascending channel's bottom, the price is expected to reach the bottom of the range.
Bitcoin testing 116k zoneIf we are successful in breaking above the 116k zone resistance. Bitcoin will pump hard to 120k and 123k next. As the high time frame trend continues to stay uptrend. Let's see if bitcoin breaks it now or has some other plans.
Stay tuned!

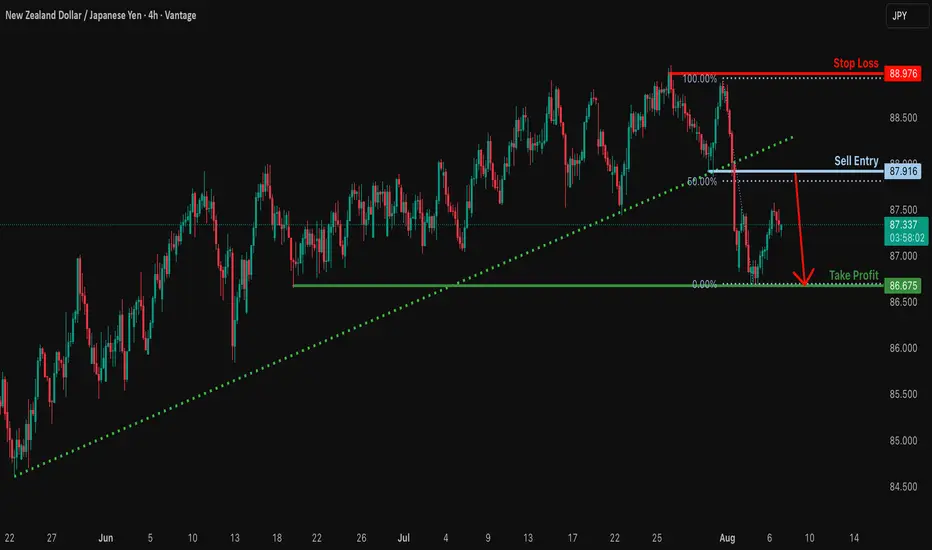
Bearish reversal?NZD/JPY is rising towards the resistance level which is a pullback resistance that aligns with the 50% Fibonacci retracement and could drop from this level to our take profit.
Entry: 87.91
Why we like it:
There is a pullback resistance that lines up with the 50% Fibonacci retracement.
Stop loss: 88.97
Why we like it:
There is a multi swing high resistance.
Take profit: 86.67
Why we like it:
There is amulti swing low support.
Enjoying your TradingView experience? Review us!
Please be advised that the information presented on TradingView is provided to Vantage (‘Vantage Global Limited’, ‘we’) by a third-party provider (‘Everest Fortune Group’). Please be reminded that you are solely responsible for the trading decisions on your account. There is a very high degree of risk involved in trading. Any information and/or content is intended entirely for research, educational and informational purposes only and does not constitute investment or consultation advice or investment strategy. The information is not tailored to the investment needs of any specific person and therefore does not involve a consideration of any of the investment objectives, financial situation or needs of any viewer that may receive it. Kindly also note that past performance is not a reliable indicator of future results. Actual results may differ materially from those anticipated in forward-looking or past performance statements. We assume no liability as to the accuracy or completeness of any of the information and/or content provided herein and the Company cannot be held responsible for any omission, mistake nor for any loss or damage including without limitation to any loss of profit which may arise from reliance on any information supplied by Everest Fortune Group.
#AUCTION/USDT ready to pump ?#AUCTION
The price is moving within a descending channel on the 1-hour frame, adhering well to it, and is on its way to breaking it strongly upwards and retesting it.
We have a bounce from the lower boundary of the descending channel. This support is at 10.68.
We have a downtrend on the RSI indicator that is about to be broken and retested, supporting the upside.
There is a major support area in green at 10.31, which represents a strong basis for the upside.
Don't forget a simple thing: ease and capital.
When you reach the first target, save some money and then change your stop-loss order to an entry order.
For inquiries, please leave a comment.
We have a trend to hold above the 100 Moving Average.
Entry price: 11.25
First target: 11.60
Second target: 12.00
Third target: 12.51
Don't forget a simple thing: ease and capital.
When you reach the first target, save some money and then change your stop-loss order to an entry order.
For inquiries, please leave a comment.
Thank you.

BITCOIN THE daily structure of the bitcoin shows a break out of the daily ascending trendline ,but on 4hrs we are protected by 4hr ascending trendline line ,the daily sr/rs level holds superior opinion of price action than any intraday timie frame .so trade with care and know that any key level on 4r/3r can fail while contesting with daily TF and weekly structure.
#bitcoin #btc

Near Important Resistance!AGP Analysis
Closed at 215.06 (06-08-2025)
Immediate Resistance lies around 220 - 222.
Important Support lies around 191 - 192.

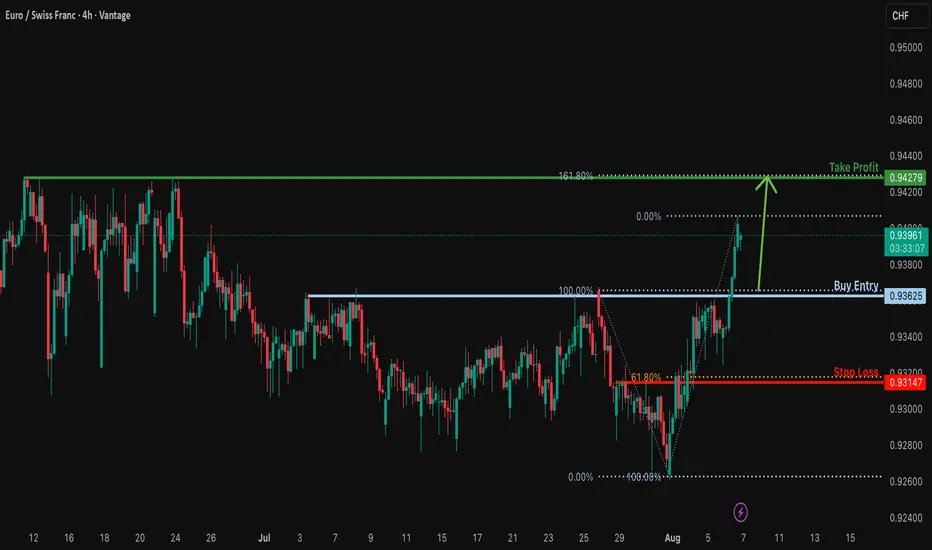
Bullish bounce off pullback support?EUR/CHF is falling towards the support level which is a pullback support and could bounce from this level to our take profit.
Entry: 0.93625
Why we like it:
There is a pullback support.
Stop loss: 0.93147
Why we like it:
There is a pullback support that aligns with the 61.8% Fibonacci retracement.
Take profit: 0.94279
Why we like it:
There is a swing high resistance that lines up with the 161.8% Fibonacci extension.
Enjoying your TradingView experience? Review us!
Please be advised that the information presented on TradingView is provided to Vantage (‘Vantage Global Limited’, ‘we’) by a third-party provider (‘Everest Fortune Group’). Please be reminded that you are solely responsible for the trading decisions on your account. There is a very high degree of risk involved in trading. Any information and/or content is intended entirely for research, educational and informational purposes only and does not constitute investment or consultation advice or investment strategy. The information is not tailored to the investment needs of any specific person and therefore does not involve a consideration of any of the investment objectives, financial situation or needs of any viewer that may receive it. Kindly also note that past performance is not a reliable indicator of future results. Actual results may differ materially from those anticipated in forward-looking or past performance statements. We assume no liability as to the accuracy or completeness of any of the information and/or content provided herein and the Company cannot be held responsible for any omission, mistake nor for any loss or damage including without limitation to any loss of profit which may arise from reliance on any information supplied by Everest Fortune Group.
EUR USD potential roadmapLooking for entry signal for weaker EUR favouring a major ABC -C leg down perhaps W2 ends. Currently looks like end of minor abc - c leg up at resistance (blue trendline)

Be in Lon Position for GOLDDears
After breakout red zone we can fill buy order with small stop lose for big target.

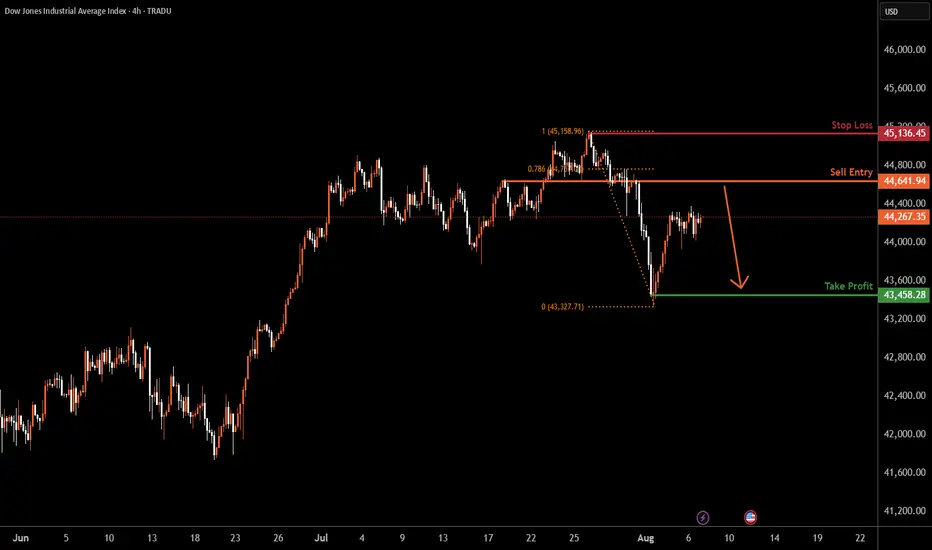
US30 H4 | Bearish reversalDow Jones (US30) is rising towards the sell entry which is an overlap resistance and could reverse to the downside.
Sell entry is at 44,641.94, which is an overlap resistance that is slightly below the 78.6% Fibonacci retracement.
Stop loss is at 45,136.45, which is a swing high resistance.
Take profit is at 43,458.28, which has been identified as a swing low support.
High Risk Investment Warning
Trading Forex/CFDs on margin carries a high level of risk and may not be suitable for all investors. Leverage can work against you.
Stratos Markets Limited (tradu.com ):
CFDs are complex instruments and come with a high risk of losing money rapidly due to leverage. 65% of retail investor accounts lose money when trading CFDs with this provider. You should consider whether you understand how CFDs work and whether you can afford to take the high risk of losing your money.
Stratos Europe Ltd (tradu.com ):
CFDs are complex instruments and come with a high risk of losing money rapidly due to leverage. 66% of retail investor accounts lose money when trading CFDs with this provider. You should consider whether you understand how CFDs work and whether you can afford to take the high risk of losing your money.
Stratos Global LLC (tradu.com ):
Losses can exceed deposits.
Please be advised that the information presented on TradingView is provided to Tradu (‘Company’, ‘we’) by a third-party provider (‘TFA Global Pte Ltd’). Please be reminded that you are solely responsible for the trading decisions on your account. There is a very high degree of risk involved in trading. Any information and/or content is intended entirely for research, educational and informational purposes only and does not constitute investment or consultation advice or investment strategy. The information is not tailored to the investment needs of any specific person and therefore does not involve a consideration of any of the investment objectives, financial situation or needs of any viewer that may receive it. Kindly also note that past performance is not a reliable indicator of future results. Actual results may differ materially from those anticipated in forward-looking or past performance statements. We assume no liability as to the accuracy or completeness of any of the information and/or content provided herein and the Company cannot be held responsible for any omission, mistake nor for any loss or damage including without limitation to any loss of profit which may arise from reliance on any information supplied by TFA Global Pte Ltd.
The speaker(s) is neither an employee, agent nor representative of Tradu and is therefore acting independently. The opinions given are their own, constitute general market commentary, and do not constitute the opinion or advice of Tradu or any form of personal or investment advice. Tradu neither endorses nor guarantees offerings of third-party speakers, nor is Tradu responsible for the content, veracity or opinions of third-party speakers, presenters or participants.
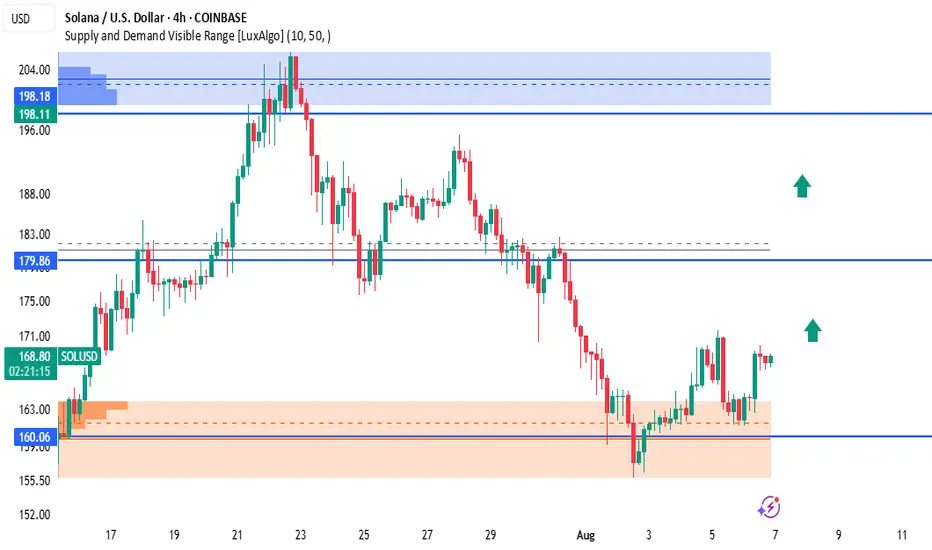
SOLUSD – Demand Zone Reversal in ProgressSolana is showing strong bullish signs after rejecting the demand zone around $160.06, forming a short-term higher low and beginning to climb. The current structure suggests momentum is shifting back to the upside, targeting key resistance levels.
🔹 Key Zones & Levels:
🟠 Demand Zone (Support): $157.00 – $160.06
🔵 Mid Resistance: $179.86 – Prior support turned resistance
🔵 Major Supply Zone: $198.11 – $198.18 (Previous peak area with strong sell pressure)
🟢 Bullish Outlook:
If SOLUSD maintains this upward momentum:
Target 1: $179.86
Target 2: $198.18
Green arrows on the chart highlight the expected bullish path as long as price holds above the demand zone.
📌 Trade Setup (Example):
Long Setup:
Entry: $165 – $169 (current zone)
SL: Below $159
TP1: $179.86
TP2: $198.18
⚠️ Risk Note:
A 4H close below $157 would invalidate this bullish bias.
Wait for strong bullish confirmation like a break and retest above $170 before going heavy.
💬 Follow for more Solana price action updates.
📊 #SOLUSD #Solana #CryptoAnalysis #DemandZone #PriceAction #SmartMoney #TradingView
BTCUSD Technical Analysis – Supply Zone RejectionBTC/USD is currently reacting strongly to a visible supply zone around the $115,000 – $115,648 area, showing clear signs of rejection after testing that zone multiple times. This rejection aligns with the high-volume area on the visible range.
🔹 Key Levels:
🔵 Resistance Zone (Supply): $115,000 – $115,648
🔵 Mid Support: $113,975 (Previous structure zone)
🟠 Demand Zone: $112,391 – $112,700 (High interest buy zone with visible order blocks)
🔻 Bearish Expectation:
If price continues to respect the supply zone:
First Target: $113,975 – Minor support, may cause temporary bounce.
Second Target: $112,391 – Stronger demand area, possible bullish reaction expected here.
Red arrows mark the potential path BTC may take if bearish pressure holds.
⚠️ Note:
A break above $115,648 invalidates the bearish setup.
Wait for confirmation (e.g., bearish engulfing or break of structure) before entry.
📌 Trade Idea:
Sell Setup:
Entry: Near $115,000–$115,600
SL: Above $115,700
TP1: $113,975
TP2: $112,391
🔁 Follow for more BTCUSD supply/demand-based updates.
📊 #Bitcoin #BTCUSD #CryptoAnalysis #PriceAction #SupplyAndDemand #SmartMoney #TradingView

OTHERS.D🌱 CRYPTOCAP:OTHERS.D ⁀➷
#OTHERS.Dominance. Macro chart Another
🐛 Intermediate Target - 16%
🍃 Macro Target 1 — 19 %
🍃 Macro Target 2 — 23 %
🍃 Macro Target 3 — 27 %
- Not financial advice, trade with caution.
#Crypto #OTHERSDominance #OTHERS.D #Investment
✅ Stay updated on market news and developments that may influence the price of OTHERS.D . Positive or negative news can significantly impact the cryptocurrency's value.
✅ Exercise patience and discipline when executing your trading plan. Avoid making impulsive decisions driven by emotions, and adhere to your strategy even during periods of market volatility.
✅ Remember that trading always involves risk, and there are no guarantees of profit. Conduct thorough research, analyze market conditions, and be prepared for various scenarios. Trade only with funds you can afford to lose and avoid excessive risk-taking.

LongPengu broke a swing on the daily at equilibrium.
I am interested in a long position if it retraces back to OTE.
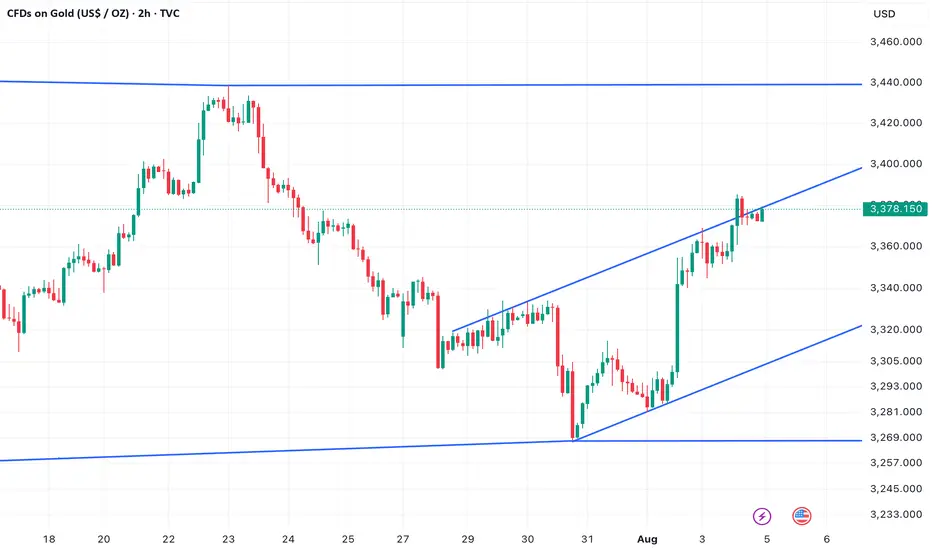
Gold in ascending channelAfter last week's steep and violent drop from $3,439 USD post Fed, Gold has found new momentum thanks to weaker than expected non-farm payroll numbers. But the price has been capped inside an ascending channel. This doesn't look particularly convincing to me for a strong reversel and bull case in the short term unless we manage to break out of the channel soon. If we fail to break the $3,439 USD high pre- Fed meeting I expect a test of the lower bound of the channel and a potential break below that.
A break below the channel opens up the way to the low at $3,267 USD.
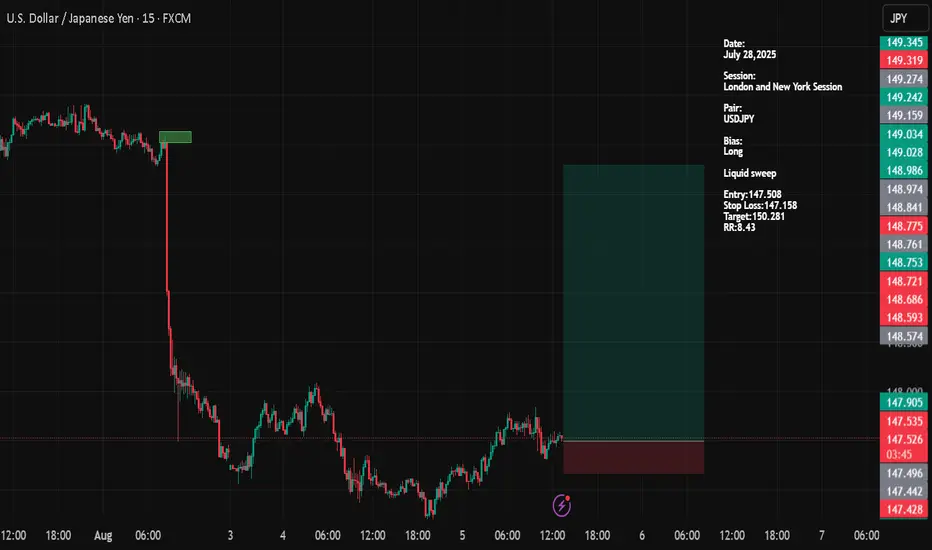
USDJPYDate:
August 05,2025
Session:
New York Session
Pair:
USDJPY
Bias:
Long
Liquid sweep
Entry:147.508
Stop Loss:147.158
Target:150.281
RR:8.43
Natural Gas SpotFormed Gartley though break 0.786 ratio but allowed upto starting point , also forming ABCD pattern, appear ib wave B or X later will decide b or X which wave . Let see. I am not SEBI registered analyst, this is not buy , sell , hold recommendation. Only personal view for educational purpose. Thanz. if goes wrong no offence.

PLTR Earnings About To Print
## 🚨 PLTR Earnings Incoming: +80% Confidence Call Setup into AI Boom 🚀
**🧠 Palantir Technologies (PLTR) Earnings Analysis – August 8, 2025 (AMC)**
**📈 Position:** \$165 Call | 🎯 Entry: \$6.45 | 💰 Target: \$22.58 | 🛑 Stop: \$3.23
**🕒 Entry Timing:** Pre-Earnings Close | Expiry: Aug 8, 2025
---
### 🔍 Quick Breakdown:
* 📊 **Revenue Growth:** +39.3% TTM – AI sector leadership
* 💰 **Margins:** 80% Gross | 19.9% Operating | 18.3% Net
* 🧾 **EPS Beat Rate:** 88% | Avg Surprise: +10.7%
* 📉 **Debt-to-Equity:** 4.43 – watch rates & debt risk
* 📈 **RSI:** 66.88 – strong momentum, near breakout
* 📊 **Volume:** Above average – institutional accumulation
* 🧠 **Options Flow:** Heavy \$165/\$170 call OI = bullish gamma exposure
* 🛡️ **Support:** \$151.94 | 📌 Resistance: \$161.24
* 🔭 **Macro Tailwinds:** AI + defense demand + sector rotation into tech
---
### 🧠 Trade Thesis:
Strong fundamentals + bullish options flow + tech sector tailwinds = **High-probability breakout**
🧨 **IV Rank: 0.75** – Big move priced in
💡 Likely to squeeze if results exceed expectations
---
### 💼 Trade Setup (Recap):
```
💎 Ticker: NASDAQ:PLTR
🔔 Direction: Long Call
🎯 Strike: $165
💵 Entry: $6.45
🎯 Profit Target: $22.58 (250%+)
🛑 Stop Loss: $3.23
📅 Expiry: 2025-08-08
📆 Earnings: August 8 (AMC)
🧠 Confidence: 80%
```
---
### 📌 Hashtags for TradingView:
```
#PLTR #EarningsPlay #AIStocks #TechMomentum
#OptionsTrading #GammaSqueeze #CallOptions
#UnusualOptionsActivity #Palantir #EarningsSetup
#TradingViewIdeas #VolatilityPlay #RiskReward
#AI #DefenseStocks #SwingTrade
```
---
💬 **TL;DR:** PLTR earnings are set to rip. Revenue surging, margins healthy, call options stacked, and momentum rising. Are you in before the AI-driven explosion?

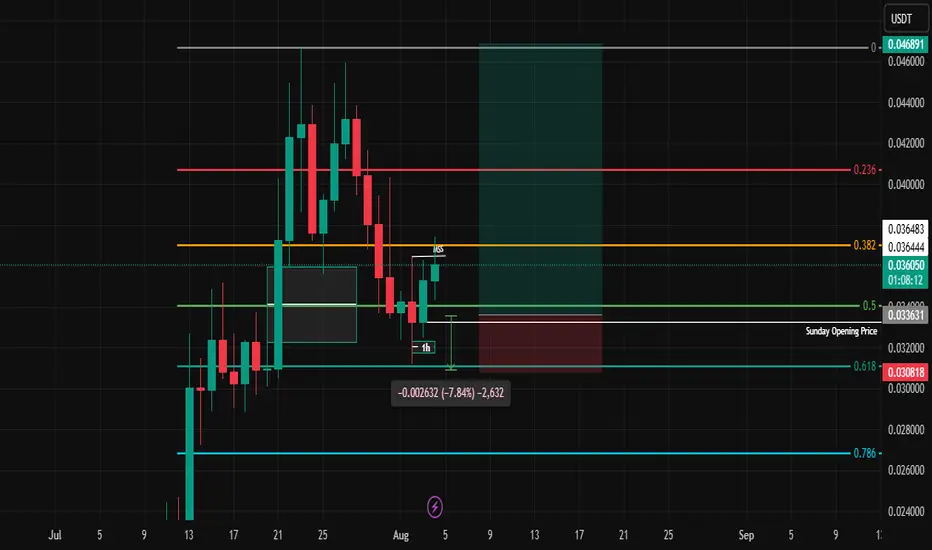
GALA/USDT – ABCDE Correction & Breakout PotentialGALA/USDT – ABCDE Correction & Breakout Potential
The chart illustrates a well-defined ABCDE corrective structure:
🔹 Point (A): Rejection at key resistance near 0.02100
🔹 Point (B): Pullback to the 0.5–0.618 Fibonacci zone
🔹 Point (C): Short-term rebound & FVG mitigation
🔹 Point (D): Strong support reaction on confluence of:
✅ 0.786 Fib retracement
✅ Long-term trendline (yellow)
✅ Demand zone (bottom red box)
📈 Next Move?
If (D) holds, the pattern suggests a move toward (E), targeting the breakout above descending resistance near 0.02292, aligning with a macro FVG zone and prior supply.

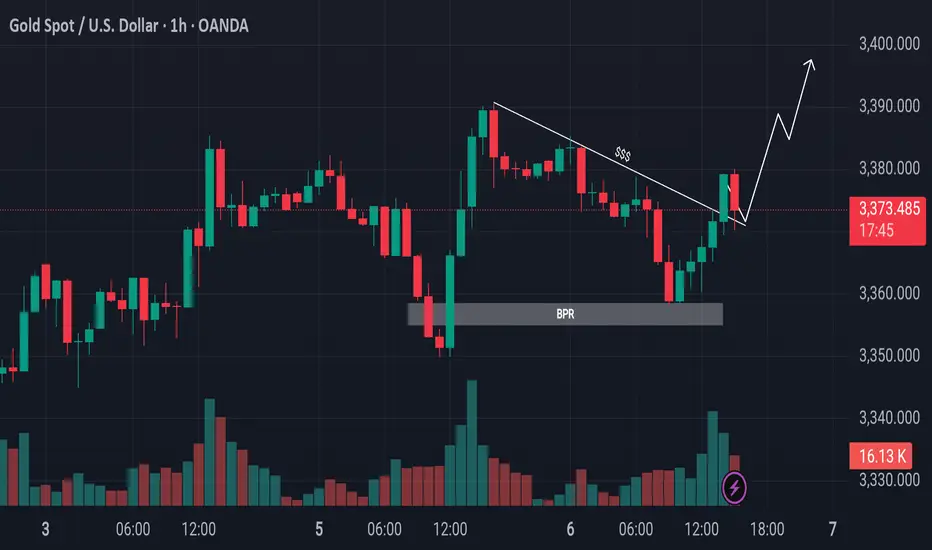
Gold Retraces to OTE and Breaks ResistanceEyes on Swing Highs!Gold Market Update
The gold market declined from its previous bullish leg and retraced below the 50% level, reaching into the Optimal Trade Entry (OTE) zone. It also tapped into a Bullish Price Rejection (BPR) area. Following that, price broke above the trendline resistance. Currently, it is advisable to wait for a potential retest of the breakout level. If confirmed, the market could continue its upward movement toward the previous swing highs.
Do Your Own Research (DYOR)
Bitcoin is heading to the moon!if the wyckoff methodology is applied then this is a re-accumulation phase with a first target in the 150k area followed by a main target in the 260k to 280K zone.
The wyckoff phases identified on the chart are as follows
Phase A:
BC (Buying Climax)
AR (Automatic Reaction)
ST (Secondary Test)
Phase B:
Characterized by volatility and testing within the range.
Phase C:
SC (Selling Climax)
Spring – a final shakeout below support to mislead traders before upward movement.
Phase D:
Clear higher highs and higher lows; sign of strength (SOS) and last point of support (LPS) observed.
Phase E :
Price has broken above the re-accumulation range and rested the trading range which is now acting as support.
As the assets price exits the trading range id expect a strong move to around the 150K area followed by a secondary move to the 260-280k target.
