BNBBTC NeutralTime Frame: 4H
Symbol: BNBBTC
Bias: Neutral
We do not have any strong directional bias for this pattern.
Harmonicsignals

ADAUSDT NeutralTime Frame: 4H
Symbol: ADAUSDT
Bias: Neutral
There is no bias for this instrument . We do not see any high probability set up.

SOLUSDT LongTime Frame: 4H
Symbol: SOLUSDT
Entry: 33.35
TP: 38.22
SL: 30.11
Bias: Long
We are planning a long trade based on the probability of current price movement based upon price rejection which may lead to a high probability buy trade.

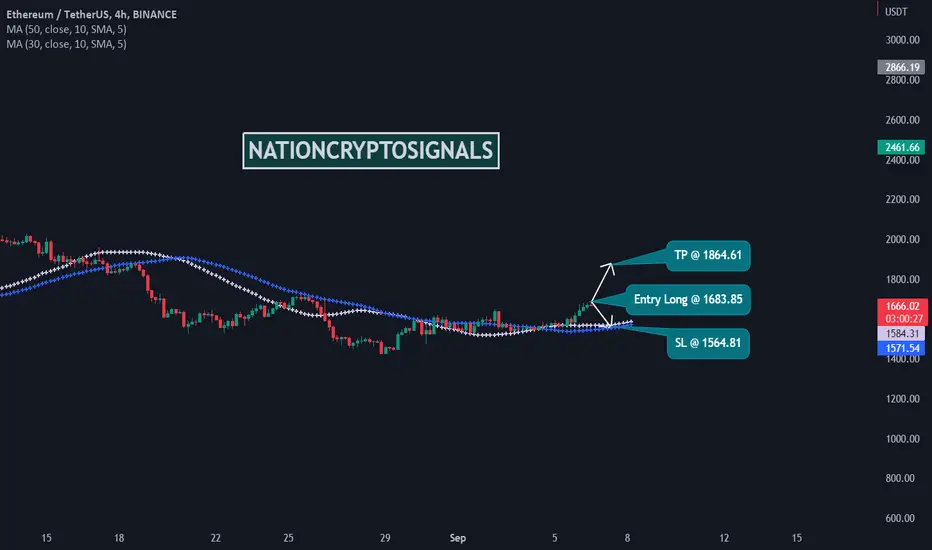
ETHUSDT LongTime Frame: 4H
Symbol: ETHUSDT
Entry: 1683.85
TP: 1864.61
SL: 1564.81
Bias: Long
The clear market bias is long and our goal is to run for a buy opportunity.
BTCUSDT ShortTime Frame: 4H
Symbol: BTCUSDT
Entry: 19945.91
TP: 18892.94
SL: 20728.12
Bias: Short
We plan a short position from the current price study.

BNBBTC LongTime Frame: 4H
Symbol: BNBBTC
Entry: 0.013891
TP: 0.014453
SL: 0.013490
Bias: Long
We are bullish for this instrument . We are planning a long trade set up from the current market picture.

ADAUSDT ShortTime Frame: 4H
Symbol: ADAUSDT
Entry: 0.4625
TP: 0.4296
SL: 0.4894
Bias: Short
We are to sell this instrument. The selling pressure is high and there is no alternative to ignore it.

SOLUSDT NeutralTime Frame: 4H
Symbol: SOLUSDT
Bias: Neutral
We do not have any directional bias for this instrument . Our goal is to stay neutral.

ETHUSDT ShortTime Frame: 4H
Symbol: ETHUSDT
Entry: 1654.16
TP: 1482.80
SL: 1763.63
Bias: Short
We are planning a short opportunity for this instrument. The obvious factor that is influencing the current trend is selling pressure ,so shorting bias will sustain for a while.

BTCUSDT ShortTime Frame: 4H
Symbol: BTCUSDT
Entry: 20360.92
TP: 19353.94
SL: 21219.82
Bias: Short
We are to short this instrument considering the current market perspective.

Indus towers cypher pattern,Indus towers good for swing/ short term, cypher pattern complete,
buy if give consolidation break out (203 above) for Target of 219
**Little risky**

BNBBTC LongTime Frame: 4H
Symbol: BNBBTC
Entry: 0.013824
TP: 0.014224
SL: 0.013498
Bias: Long
Our bias is long and considering the current price pattern long side outweighs short bias.

ADAUSDT ShortTime Frame: 4H
Symbol: ADAUSDT
Entry: 0.4485
TP: 0.3975
SL: 0.4795
Bias: Short
For this instrument we have a plan to go short . Considering the scope of price action we believe that the opportunity is justified for next few days .

SOLUSDT NeutralTime Frame: 4H
Symbol: SOLUSDT
Bias: Neutral
We do not have any directional bias for this instrument . Our goal is to wait for a good opportunity.

ETHUSDT NeutralTime Frame: 4H
Symbol: ETHUSDT
Bias: Neutral
There is no specific directional bias for this instrument . Our goal is to wait for a better opportunity.

BTCUSDT ShortTime Frame: 4H
Symbol: BTCUSDT
Entry: 20088.11
TP: 18842.04
SL: 21084.96
Bias: Short
The trend pattern is heading towards lower level projecting a better shorting opportunity.

BNBBTC LongTime Frame: 4H
Symbol: BNBBTC
Entry: 0.014164
TP: 0.014639
SL: 0.013743
Bias: Long
We are planning a long opportunity from the current price context.

ADAUSDT ShortTime Frame: 4H
Symbol: ADAUSDT
Entry: 0.4563
TP: 0.4055
SL: 0.4911
Bias: Short
The explicit trend for this instrument is bearish and our goal is to go with bear.

SOLUSDT ShortTime Frame: 4H
Symbol: SOLUSDT
Entry: 33.13
TP: 26.77
SL: 37.17
Bias: Short
We are searching after a short opportunity from the current price pattern considering the market momentum and volatility.

ETHUSDT ShortTime Frame: 4H
Symbol: ETHUSDT
Entry: 1572.97
TP: 1388.52
SL: 1714.86
Bias: Short
The oscillations and volatility denote a selling opportunity and our bias is short .

BTCUSDT ShortTime Frame: 4H
Symbol: BTCUSDT
Entry: 20355.94
TP: 19230.59
SL: 21137.44
Bias: Short
We are searching after a bearish opportunity from the current price context.

BNBBTC ShortTime Frame: 4H
Symbol: BNBBTC
Entry: 0.014209
TP: 0.013462
SL: 0.014768
Bias: Short
The trend of this instrument is demonstrating a bearish opportunity . We are to wade through a bearish journey if the momentum is not in favor.

ADAUSDT ShortTime Frame: 4H
Symbol: ADAUSDT
Entry: 0.4610
TP:0.4214
SL: 0.4857
Bias: Short
The price pattern of this pair is showing a bearish bias . We are to sell based of the current price direction.
