Harmonicsignals


Price Trapping with harmonics signalsHarmonics Scanners calling a SELL (butterfly pattern)
Rules on chart
use risk management


GBPJPY BUYING THEORY London SESSIONNot Taken anytrade. Had some free time so. Do give it a thumbs up!

USDCAD DAILY - LONGBAT Pattern completed at our D-leg. Previous, we have a strong bullish engulfing candle and now giving us a pullback for another entry towards the target completion of 0.382 AD fibonacci retracement level.

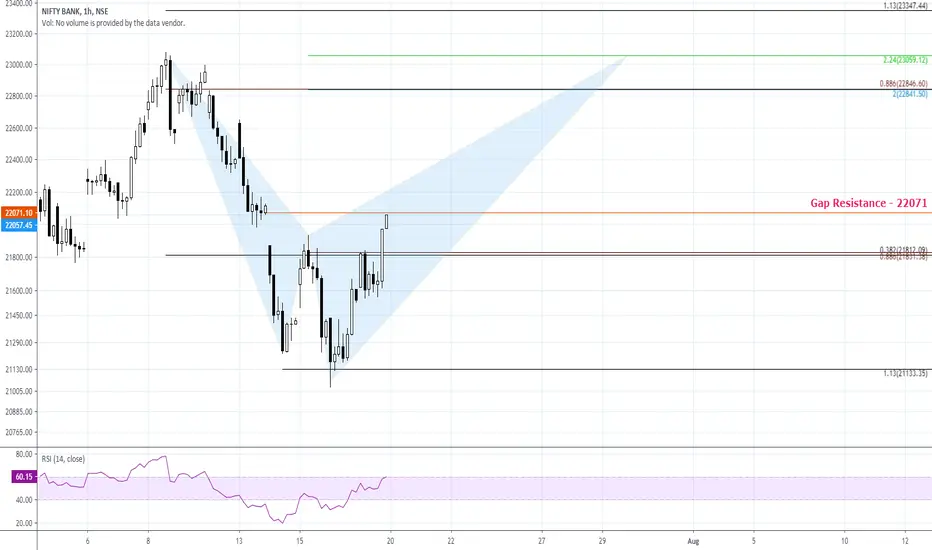
Possible Price Reversal In BANKNIFTY Possible price reversal can be seen from the levels 22450-22300 we can build a long position if we see a reversal candle.
IF Not ?
Then consider 22300-23100 levels as Support Levels.
IF 22300 support is broken in BANKNIFTY we may see more bloodbath then.
Build your long and short positions accordingly.
(Till then enjoy the weekend)
Trade with Proper Risk Management.
Victory is beyond fear!!
Disclaimer: I am not a SEBI Registered Analyst. Please take position after consulting your advisor.

Bearish Butterfly CAD/JPYSell!!
- Alternate AB = CD formula confirms D (PRZ)
- Bullish inverted hammer ofter appears before a reversal ( also found on PRZ)
Want more facts about Harmonic patterns? Just follow me it's free!

USDCAD - Possible reversalsIt's clear and simple. It has the condition to reverse here to retest previous range's zone. Or drop more for harmonic reversal.
As you may know I have an exclusive price action analysis algorithm, that supports this idea. I'll post them in updates.


LONG ACC - Long Swing Setup January 2020Here is my idea for a short term swing in ACC . Trade will be active on Breakout above 1548
Buy : 1548
Stop Loss : 1462
Target : 1602/1648/1800

WABI, Bagging this dipEntries Zone: 1937
Bids level 2: 1672
Target 1: 2425
Target 2: 2947
Target 3: 4122
Target 4: 4970
Indicators used: Phantom Script, and XABCD Scanner by @coinobsalgos << Make sure to follow them!
Trading this due to phantom buy level just rang today.
And due to XABCD Pattern completing Harmonic


EURUSD LONG POSITION TO 11200 FOR 53 PIPSI am looking to trade FX:EURUSD in a long position to reach 1.11200 for a total of 53 pips
This trade would complete the D leg of the harmonic pattern to reach 50% profit range
This trade is for educational purposes only & not a recommendation to take this trade :)


BTC Long OpportunityPracticing Gartley Pattern. Green confirmation candle confirming the trend.
We will see dramatic movement upwards if this pattern is truly there.
(the numbers aren't exactly accurate, but who knows? fib ratios werent even in the OG gart)

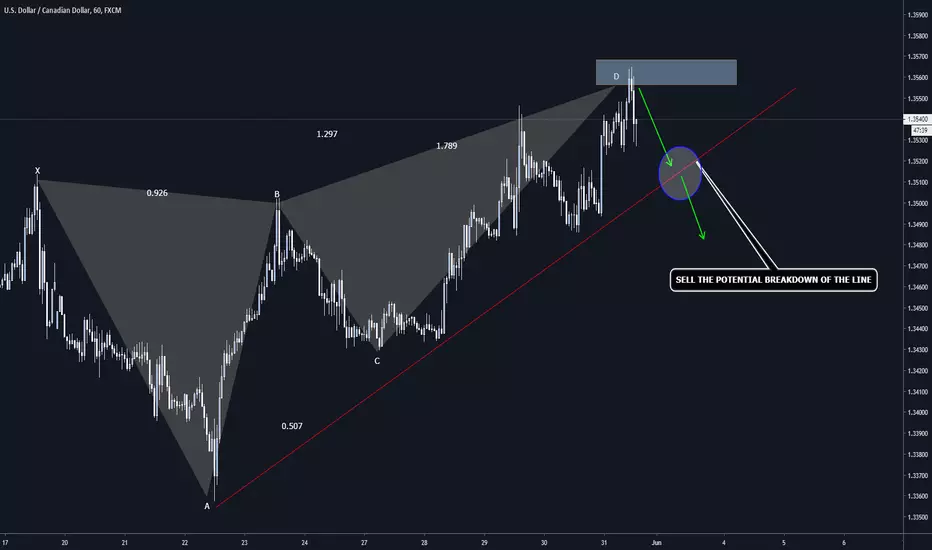
USDCAD H1 Chart Update: Trendline BreakoutWe have sold the Bearish Butterfly.
It is too early to speak about a working trade
I plan to add short positions at the potential breakdown of the trendline.
Keep you updated.
EURUSD Harmonic Deep CrapEURUSD 30M Time frame Harmonic Deep crap formation completion. At market open wait for the completion of the 1hr bearish Gartley to finish forming. After Gartley completion. Watch MACD indicator for a positive to negative switch. And negative to positive on your pattern. You can do this by using the trend angle tool. Also wait for you Stoch indicator signals to cross in the over bought area. And for your final confirmation signal wait for the (short) signal to appear on your chart using the blue sky 90% indicator. After you have all 3 of these confirmations wait for the current candle to form and close then open your short order with proper risk management lot sizes.
The company that I currently work for offers free signals/VIP signals $35 USD a month. Or a one time payment of $100 for lifetime signals.
I also do one on one live training for subscribers. I teach Advanced patterns, Support & Resistance wick zones scalping, price action, and fundamental analysis as well. I'll paste the link to our WhatsApp group below for free signals. And you can find me in the administrators section under the name MASHAKA MrFx. Good luck!
WhatsApp free signals and mentoring group link-
chat.whatsapp.com/G5NPXu5PRZDFQewuJ4m8RS

EURCHF LONG - GARTLEY - HARMONIC PATTERNGartley pattern completed on EURCHF . Expect price to move toward the targets, blue boxes, and move stop loss to breakeven after TP 1 is hit.

AUDCHF Hourly ButterflyThis chart has a really good divergence, shown by the purple lines. Targets 1 - 3 are the green lines 0.382, 0.618 , and 1.00. Stop loss is the red line. The price reversal zone or PRZ is the blue rectangle. Wait and watch price action in the PRZ and if there is a clear reversal in the PRZ then go long and the three green lines as target. Often it never hits the 1.00 so use your best judgement.
I spend hours daily finding tradable Harmonic Patterns and I post them to here because I want my work to help more than just myself. IF you like this then thumbs up it and follow me. When I am thinking about it I'll be posting all of my findings to tradingview.com.
