Hbar breaking upwar from fallingwedge/pennantAlso in a smaller double bottom setup here. *not financial advice*
Hashgraph

A linear Chart version of the current HBAR bull patternsIt just dawned on me that I had my chart on logarithmic for the previous 2 posts I amde about HBARUSD. As usual, the chart patterns on the log chart tend to have much higher breakout targets than the version of the chart patterns that appear on the linear chart. As soon as I realized this I went back in and adjusted the patterns to their linear chart erosions. The inverse head and shoulders remained mostly the same but the bullflag/desceding channel has now morphed into a falling wedge/bullish pennant. As you can see the breakout target for all 3 patterns is a much lower price than what the price targets were on the logarithmic chart. That’s not to say that the logarithmic targets are invalid, I think what will most likely occur Ike usually is both chart’s targets will be validated, it will likely just take much longer for the logarithmic chart’s targets to be reached as is how things usually pan out. *not financial advice*
Weekly timeframe version of previous HBARUSD postWanted to show my previous hbar idea which was on the daily time frame on the weekly as well so I could fit the pole of the bullflag in the frame here. I will put a link below to my daily time frame version of this post which goes into slight more detail about each pattern and also the Nvidia hbar news. *not financial advice*

HBARUSD has 3 bullish patterns stacked on top of eachotherThe inverse head and shoulders in the light blue, the light tan is the bull flag, and the pink is the double bottom. Currently price is above the Bullflag and the Inverse head and shoulders pattern. The bullflag also counts as a descending channel pattern as well. We just recently retested the neckline of the inverse head and shoulders as exact wick support which is a good sign. All 3 should provide eachother with the bullish confluence needed for them to be validated, but in addition to this technical bullishness we have some fundamental bullishness occurring just recently too as NVIDIA just announced their new Blackwell chips — claiming them to be the future backbone of AI infrastructure — which are integrating verifiable compute which has its fundamental trust layer built on Hedera. This also provides great bullish confluence and heightens the probability these 3 chart patterns will all be validated and reach their full targets. I will keep updating this post as they do so. *not financial advice*

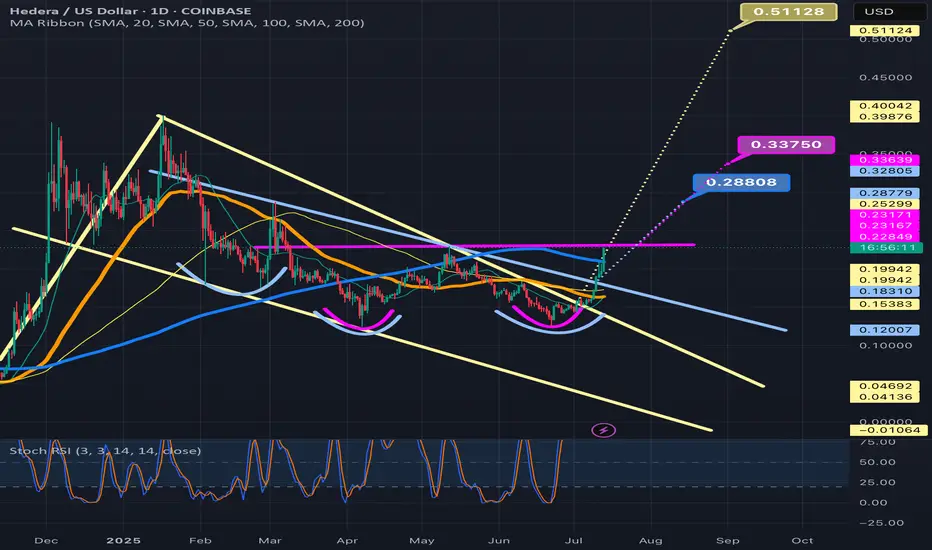
HBAR Falling Wedge / Bull Pennant + RSI breakout (1D)BINANCE:HBARUSDT has spent months correcting after a strong rally and is now compressing within a falling wedge — which could also be interpreted as a bull pennant.
Two Potential Scenarios
• Falling Wedge – A classic reversal setup with bullish RSI divergence and declining volume. Measured target: ~$0.335.*
• Bull Pennant – A continuation pattern formed after the late-2024 impulse. Measured target: ~$0.525.*
Early Bullish Signs
• Declining volume as the pattern developed could signal waning seller strength.
• RSI breaking out of a multi-month downtrend, and retesting the resistance as support, can be a leading signal of a subsequent price breakout.
Key Levels
• $0.050 – Multi-year demand zone.
• $0.120 – Current support + HVN* + previous S/R + 0.786 Fib.
• $0.180 – Resistance + HVN + previous S/R + 0.618 Fib.
• $0.280 – HVN + prior swing high + likely resistance.
• $0.320–$0.460 – Monthly supply zone (in place since March 2021).
• $0.335 – Falling wedge measured target (depending on breakout timing)**.
• $0.360–$0.400 – Daily sell-side order block, expect resistance.
• $0.525 – Bull pennant target (depending on breakout timing)**.
* Wedge and pennant targets are measured from the breakout point, so the actual target will vary the longer we spend within the pattern.
** HVN: High Volume Node — zones of concentrated past trading activity, reinforcing S/R relevance.
⚠️ Until a clean breakout occurs, CRYPTOCAP:HBAR remains in a compression phase and a No-Trade Zone.

39% Pump Incoming#HBAR is trading in a 2 month range. I'm expecting further continuation to the downside to the confluence levels below before reclaiming last months value area low and move to the top of the range 39% above.
Calculate Your Risk/Reward so you don't lose more than 1% of your account per trade.
Every day the charts provide new information. You have to adjust or get REKT.
Love it or hate it, hit that thumbs up and share your thoughts below!
This is not financial advice. This is for educational purposes only.

HBAR another opportunity to entryAll confirmations and pullback triggered with the following criteria..
- Touched Support channel
- Resistance turned into support
- Strong Fibo pullback level
- FVG level

GRT looks bullish (3D)From the point where we placed the yellow line on the chart, it seems that GRT has started forming a diametric pattern.
Currently, it appears we are at the end of wave D. In any case, as long as the green zone is maintained, it is poised for growth.
The target could be the red box.
The closure of a daily candle below the invalidation level will invalidate this analysis.
For risk management, please don't forget stop loss and capital management
Comment if you have any questions
Thank You

HBAR likely to break outta flag as it breaks stochrsi resistanceNotice the yellow descending trendline on the stoch rsi indicator, we can see this line held resistance fr quite some time but stochrsi is now finally braking above t while price action has simultaneously closed the previous candle with the body poking above the top trendline and now the current daily candle looks like it will hold that trendline as solid support and potential even act as the breakout confirmation candle. Probability is high the breakout will be confirmed in the next few days *not financial advice*

1day50ma likely to push hbarusd price up out of bullflagIn this HBARUSD chart update, we can see here the. Day 50 ma (in orange) is still providing solid support to hbarusd’s price action and probability is good that it will push price up out of the bull flag it has been consolidating in. *not financial advice*

HBAR gearing up for ATH: $0.80As said in my previous analysis, Hedera Hashgraph is the layer 1 in crypto to look out for and shortly after it did a 2.5x! Find the analysis below why Hedera is the superior layer 1 in all of crypto.
Now, ofcourse after a big run up, there's need for a consolidation and HBAR did just that. Currently its repeating November's fractal pretty perfectly. If(!) Ethereum doesn't correct today and keeps momentum, I expect HBAR to breakout. Key levels to break: 0.32 & 0.34. HBAR is currently sitting on a conflux of volume weithed support and the 4HR 50 EMA which (if the overall market stays bullish) will give support for a run up towards ATH.
I expect HBAR at ATH by the end of december if the market keeps momentum. DO NOT LEVERAGE TRADE, SPOT ONLY & DYOR.
Good luck and have fun! :)

Breaching upwards in a 1HR Candle-breakout is HBARUS
This Crypto is looking good lately and as traders turn to lesser known Crypto's that may have a better risk to reward ratio, I am talking about ones like Hedera Hashgraph that only recently got it daily 200ema to be just near price and preferably directly underneath price on a Daily chart.
Then price snaps upwards with ease because all of the EMA's are stacked correctly with 8ema at the top just below price, then directly underneath the 8 is the 13ema, directly under the 13 is the 21ema etc.
Let's look again at the breakout occurring right now on price.
Here is an historical look at price for HBARUS :

Hedera is about to leave its accumulation range and will fly!Most of you who follow me here for a while - if you're still around - know that we've bought the absolute bottom for Bitcoin and most altcoins after the FTX crash during nov/dec 2023. If you bought with me, congrats! If you didn't: there are still great opportunities!
One of them is Hedera (HBAR) - it's an U.S. based Layer 1 that uses hash graph technology. In short it's a new consensus system that's many many times more scalable than any blockchain - yes, also more scalable than Solana, Tron, Sui or any other project on the market. Next to that, they have fixed fees in USD, I.E. transaction fees are fixed at $0.0001. Making it the cheapest, most scalable (10,000 TPS) AND most energy efficient chain (they use about 50x less energy than BNB, the 2nd best on energy usage).
If that wasn't enough, they have a governing council consisting of many top corporations such as IBM, Google, LG, Boeing, Dell, Deutsche Telekom, Chainlink and many more. Making them the Layer 1 of choice for institutional adoption. They also did a whole leadership update with a new CEO, president and attracted key business talents next to their academic key figures such as dr. Leemon Baird, now serving as CTO.
Fact is, there's no other layer 1 that uses hash graphs in this way and has such institutional adoption. There are many big projects on the way with I.E. the Linux Foundation, RWA tokenization, US state dept, NASA and institutional stable coins with central banks (I.E. cross boarder payments with the Signapore Central Bank). There's also rumors of collaborations with Cardano on a new voting system and XRP for institutional grade stablecoins. Many of the XRP and Cardano fanbase are allocating capital to HBAR.
Lastly, Brian Brooks (part of the board of the HBAR Foundation) is one of the key candidates to take over from Gary Gensler at the SEC. One thing I anticipate is that the "new SEC" will drop the XRP case and give legal clarity for crypto. This means that institutions, governments and corporations can now actually build - instead of just buying bitcoin. Many of those will choose Hedera as their platform because of the predictable fees (low cost, high speed, low energy usage), any other chain uses crypto fees (I.E. ETH, SOL, TRON etc) and if those tokens pump, so do the fees - at Hedera, the price of HBAR doesn't matter for the fees. One other thing: Trump might cancel capital gains tax made with US based crypto companies, that's a huge catalyst by itself.
The chart is telling, Hedera was NOT on Coinbase, Kucoin or other big trading platforms apart from Binance. So this will be the first bull run its available across the board. We've pretty much follow the Wyckoff accumilation scheme 2 since the start of 2023 - when HBAR was listed on Coinbase. Current price action is very strong, especially if you check the long timeframe on the Binance chart.
Once we break 16 / 17 cents and retest it as support, I expect a next move towards 30 and the ATH of 50 cents. Long term targets should exceed $1 and depending on adoption and the (likely) new regulatory framework. Personally I see Hedera as the Apple of crypto, lagging on adoption from the start but making it up on the long run.
The current market cap of less than $6 billion and most dilution behind us with a $7.7 billion fully diluted valuation means there's so much more room to grow. For example: if Hedera has the current market cap of Solana, it would be trading at $3. Even if it does half from that, it does a 10x. Personally, I think a target between $2 and $3 is very reasonable.
In short, Hedera is in a really strong position to serve as a DLT for the future that will be preferred by the big corporations. Maybe memes are more popular now and Solana is one that benefits currently, but in tech, things never stay the same. Because if that was the case, (AOL) America Online would be part of the Mag 7 right now...
My investment thesis for crypto is to think ahead and not to be stuck in the current status quo. Hedera for the future.

GRT NEW UPDATE (12H)From where we entered "start" on the chart, it seems that the GRT correction has started.
This correction seems to be a diametric that is over. We are now at the end of the G wave.
A support range has been formed, which we marked with green color. By maintaining this range, it can move towards the red range
Closing a daily candle below the invalidation level will violate this analysis.
For risk management, please don't forget stop loss and capital management
Comment if you have any questions
Thank You

30% UP or 30% DOWN Incoming!Currently trading at demand. If we get some buying pressure and start breaking previous candle highs, a 30% move to the upside is likely.
If we flip demand into supply, an almost equal move to the downside to the next support will become the most probable outcome.
Calculate Your Risk/Reward so you don't lose more than 1% of your account per trade.
Every day the charts provide new information. You have to adjust or get REKT.
Love it or hate it, hit that thumbs up and share your thoughts below!
This is not financial advice. This is for educational purposes only.

HBAR/USDTIts good for spot on Mid/Long term!
HBAR is relate to a wonderful project!
2 step is logical for buying according to DCA !
stoploss will be activated if daily close seen under the last step

HBAR is All Adam & Eve Double-BottomsVery simple:
Two Adam & Eve double bottoms repeating leading into confirmation of one giant Adam & Eve double-bottom with a price target in the long-predicted 2-5 dollar range, presently measured at 3.78.

HBAR/USDT bullish turnaround from demand?💎 Paradisers, turn your attention to #HBARUSDT for a promising trading opportunity, signaling a potential bullish surge from a key demand level.
💎 In recent times, #HederaHashgraph has consistently adhered to a descending channel pattern. Currently, as the price nears the demand level of $0.0976, maintaining momentum here could significantly increase the likelihood of a bullish ascent, aiming to overcome the overhead strong supply zone.
💎 Should the momentum for CRYPTOCAP:HBAR begin to falter, we're prepared to seek a vigorous rebound from the crucial demand level located just before the demand zone at $0.0871.
💎 Falling beneath the critical demand level of $0.0871 would call for an in-depth reassessment of our trading approach. Such a development would indicate difficulties in sustaining bullish momentum, necessitating a strategic adjustment to align with the evolving market landscape.

HBAR triggering an inv h&s + golden cross?It certainly looks as though hbar is already validating the breakout from this inverse head and shoulders pattern…however with price action this far above the 50 and 200mas at the time of its golden cross, there’s always a likelihood it may dump back down to the MAs at the time of the cross or shortly thereafter, even dipping back below the neckline temporarily to shake some weak hands that long in this zone…of course it could validate and just continue up to the target from here as well…if it does try to dip back down to the MAs to test them for support and even dip back below the neckline, probability favors that it will likely break above the neckline once again before too long an d then validate at that point if it doesn’t already validate after this first break of the neckline. Of course if we see price flip the 200ma back to solid resistance, then probability will favor this pattern becoming a fakeout…but until then probability favors it validating. *not financial advice*

HBAR to Repeat its Prior Move?This is a simple theory that COINBASE:HBARUSD can be divided into two parallel uptrends on the weekly:
one that acts as support
another that acts as resistance
When it first broke out of parallel support, it made a 2.5x measured move up, and then dropped back down near the 1.5x measurement, forming what would become parallel resistance after making a higher set of highs, dropping back down to 1.5x, and then losing it to fall back into parallel support.
After falling into parallel support, it tested the top of it and failed to move above, causing it to drop down to the bottom. When it did this it moved below support's bottom, but when it failed to remain below, it saw a strong and fast move back to the top of parallel support for another attempt to move above. This also failed, leading to a move back down towards the bottom.
Now that it has made 3 attempts at bottom, each attempt weaker than the previous, it should be ready for a 3rd attempt at the top of parallel support.
I expect it will break above it, as it has already failed to break below.
TP 1 and 2 are likely targets if it does this, but we could also see a repeat of its prior move sending COINBASE:HBARUSD back into and towards the top of its parallel resistance.
An example of how they are similar:

Go to reverse zone(GRT)❤️❤️Thanks for boosting 🚀 and supporting us!
📈And in bull-tend come to reverse zone.
📊 (Entry) : 0.2052
🔴 Stop Loss : 0.2211
🎯 Take Profit : 0.1887-0.1778-0.1640-0.1467
🔗 For more communication with us, In the footnote and send a message in TradingView.
👨🎓 Experience and Education: Our trading team has five years of experience in financial markets, especially cryptocurrencies.

Long term buy on HFTHello guys,
We have a long-term bullish range in this cryptocurrency, which can be accompanied by a sharp growth
If the supply area ahead is broken, I expect growth to the upper red level

HBAR - This Quick Idea Could Yield A 100% Gain...Just scanning though the top 50 cryptos and looking for trading ideas.
This one here stuck out as a good timely opportunity..
Entry: At Market.
Stop: 0.07
Target: 0.19
Use your judgement, this is just an idea based on AriasWave.
A methodology I created to replace Elliott Wave because it simply does a better job.
