HBAR / BTC - Correlation of Pivot Points for HBARJust an observation showing correlation between pivot points on the way down before the previous big move, and in the downtrend that occurred after that move.
HBARBTC

HBAR ready for another Big PumpHedera Hashgraph breaks the daily downtrend and trading above it. HBAR is a good coin for the upcoming altseason. We will see a good rally in HBAR in the coming weeks.
Buy Zone: 175-190
Targets: 215-240-270-295-330-370
Stop Loss: 159


HBAR / USD - Weekly Chart potentially forming HSiHBAR / BTC pair has been in a downtrend for a good while now without any significant corrections. It feels due for a correction soon. The USD pair here shows potential for an inverse head and shoulders pattern forming, and we could be at or near the bottom of the right shoulder. Volume is starting to rise as well. If it plays out as suggested on the chart idea above, it should complete this pattern around mid to late December.
Keep an eye on this, but beware goings-on of BTC
- also be mindful that HBAR has a much lower USD bottom prior to the google news, and hasn't yet re-visited previous BTC pair bottom either (if it will get there, we're hovering around 185-190 sats, previous bottom was 114 sats).


HBAR/BTC🔥Hello dear friends!💋
While Bitcoin has been sideways for several days, altcoins are giving just excellent results.🔥🔥🔥
I would like to pay your attention to some of the cryptocurrencies that have been forming a falling wedge for several months.
Because the two levels are not parallel it’s considered a terminal pattern. This implies that it must eventually come to an end.
MY ADVICE to You , my dear💋
The price may not fall so low, that's why I always recommend splitting buy orders!!!Buy little now for don't miss entry point.If it goes lower, then you average the buying price - it will be great anyway!
Tell me, do you trade ALTCOINS / BITCOINS?
how are your results?
I try to be useful to You🧡
Always sincerely with You😊
Your Rocket Bomb🚀💣

HBAR / BTC - ReversalThere's a decent chance for a trend reversal occurring on HBAR / BTC pair right now:
1.) RSI is bottomed and turning upwards
2.) We've just barely broken above the triangle.
3.) Volume has been insanely low throughout the downtrend, any real volume coming in will pump this
Need to stay above 201 sats to continue. Good luck!

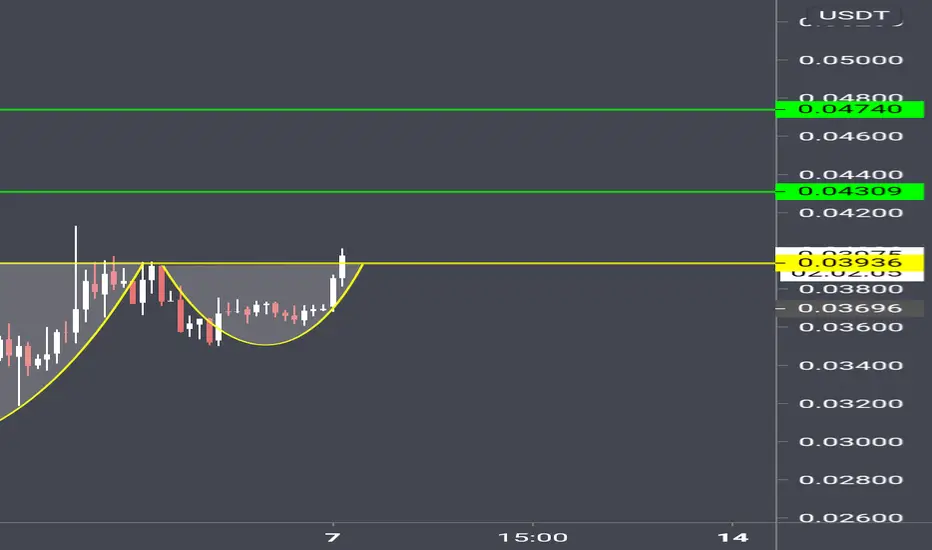
HBAR/BTC Main trend. Potential reversal zone. Past idea + 500%HBAR / BTC In this idea, I showed the main development trend of this cryptocurrency. It is a fairly new cryptocurrency. It is currently ranked 65th in terms of capitalization according to coinmarketcap.
On the charts, we see a descending channel, the removal of "passengers". Return through the concave bottom and, as a result, pumping up the price by + 500% of the average values of the 2nd phase of the concave bottom.
Then, after a partial reset of the position, a horizontal channel began to form with a step of 50% for 2 months while maintaining the 360 level zone. This horizontal channel is the zone ....... of the position of this coin. After 5 months of the existence of channel 13 09, this channel (support 360) was pierced to eliminate "stuck passengers". At the moment, there is a breakdown of the secondary trend of the downtrend. A fractal is forming. Possible price reversal zone.
For this trading pair, I have accompanied the price in updates to the trading idea published on December 4, 2019, right up to the pump itself. 2 days before the pump of this cryptocurrency, I made another trading idea, which is published on this site. I will attach these ideas under this trading idea.
False movement + 12% to the downtrend of the main trend.
A very large number of people believed in the pump. The price returned to support. Critical zone (red).
The potential to break it, like the bulk of the crowd, is aimed at quick and easy money. The crowd always loses.
Downstream channel. Removal of "passengers".
Downstream channel. Break of the downward trend line.
Return via "Dragon". The crowd's belief in growth has been killed. Believers in leave the ship before surfacing.
Forming the Cup. Ross Hooks are in phase 3 of this pattern.
+ 500% after 2 days
The previous trading idea for this coin gave a profit of about 400% 2 days after the publication of the idea, and whoever followed the updates of the first trading idea and idea with work in a downward channel could get much larger profit, as the entry point (Local Dragon) was shown at the lowest price values. From her, the first impulse-pump + 500%. Real profit from + 500%, depending on who trades how 200-300%. The liquidity to reset the position to + 300% was acceptable.
The main thing is to “kill faith below” and “give it above”. Faith is a terrible force. Depending on how you use it, it can either replenish your deposit or empty it. Think not like the main crowd of the market. Make your mind work for you.

HBAR/BTC 91% Potential from here with Tight Stop Loss#HBAR/BTC TA Update:-
#HBAR currently trading at 198 Satoshi
And low was 187 Satoshi.
And Very good strong support here.
So I am buying #HBAR also.
Entry:- 190-200 Satoshi
Targets:- 243/295/350 Satoshi
Stop loss:- 285 Satoshi
Please click LIKE button and Appreciate my hard work.
Must follow me for Latest crypto retime updates.
Thank you.

HBAR - Hedera Hashgraph, time to buyLooking at the HBARBTC and HBARUSD chart, I think 3x above the bottom is a fair valuation.
It also seems to move sideways and should break out on the next hit to the upper resistance.

HBAR / BTC - Should see an uptick soonHBAR is nearing the bottom of the channel on this downtrend. It may continue down for a bit to around 225 sats or slightly lower/higher, and then we should see some bullish movement, at least back to the mid-point of the channel. I expect this thing to turn around, but a break below the channel here invalidates the idea and confirms further downside.

HBAR/BTC (Next Support at 200s Sat?)💎Technical Analysis Summary💎
BINANCE: HBARBTC
-HBAR is still on a strong downtrend after breaking its support
-If you are looking for a potential buying area or support
-The range between 212-190s sat might hold some potential
-Though this zone is only a minor consolidation
-But it was the start of a strong pump last Feb 12, 2020
-Wait for any bullish reaction before entering your trade
A big Thanks for donating 💰 via Tradingview coins this week to CITIZENCAINE 🙏🎉
``````````````````````````````````````````````
Trading Involves High Risk ⚠️
Not Financial Advice 💸
Please Exercise Risk Management 💱
``````````````````````````````````````````````
Thank You All!🙏😊💖For Supporting My Channel 📺
Through Leaving A Thumbs Up, Comment & Follow 💬
Happy Trading!😊💕💖
``````````````````````````````````````````````

HBAR / BTC - Hedera Hashgraph at a turning pointWe've had a recent shift in movement in HBAR, chart suggests we'll reach somewhere just below 450.
Note - I actually expected this to go back to bottom again before moving up, which is still certainly possible, but if we break above this channel, the monthly does look like a giant bull flag and this thing could really see some movement. We've had quite a few extended fake breakdowns before seeing real movement in HBAR. The tech behind this coin is different than everything else out there and no matter what happens I feel like its worth following long-term.

HBAR/BTC (Trading Downtrend)💎Technical Analysis Summary💎
BINANCE: HBARBTC
-Hedera Hashgrap is perfectly trading on a downtrend channel
-If the Bears can keep the price going down
-The chances of testing the key area of support at 248 sat is high
-Please do not try to catch the bottom
-Wait for proper confirmation or reversal patterns
-Let the price come to you and patiently wait for the correct entry
``````````````````````````````````````````````
Trading Involves High Risk
Not Financial Advice
Please Exercise Risk Management
``````````````````````````````````````````````
If You Like My Daily Published Ideas
A little Help By Supporting My Channel
Through Leaving A Thumbs Up, Comment & Follow
Happy Trading! --> Thank You! :)
``````````````````````````````````````````````


HBAR / USD - Two Possible ScenariosBearish - a break below the wedge may head further down, and if we break below the horizontal line, we've confirmed a double-top and may revisit all time lows.
Bullish - if we stay within the wedge, above the area being tested now, a return to all-time highs or higher is possible
Side note - a triple top is another bearish scenario that could possibly play out if all-time high is reached again and strongly rejected.
The USD pair for HBAR has been easier to chart than the BTC pair, which is not typical for altcoins, outside of the top 5-10.


HBAR / BTC - Update: Make or Break Time for HBARHBAR has returned to major support area (between 350-380 sats roughly).
- If we break and close with a daily candle below the green box, HBAR is likely to move further down
- For it to be bullish, we need to get back above the bottom of the yellow triangle (approx 397-400 sats)
In the bearish scenario, it's possible a short-term bullish move occurs that takes us back up to 400 area to re-test the bottom of the yellow wedge.
In the bullish scenario, the same thing could occur, but we would need to break above the wedge, and then re-test it, or hit the bottom, go down, and on re-test break through.
NOTE - typically a wedge like this breaks down after multiple tests of the flat bottom (but there's also a possibility this is a symmetrical triangle, which is why i drew both)
NOTE 2 - our lowest low in this wedge was around 332 (near the beginning), it's also possible we hit that low again before breaking back up, so be careful, I prefer not going lower than 350.


HBAR / USD - **Update - Part II** Bullish Cup and HandleHBAR is re-testing the top of the long-term triangle here.
We need a big bounce here or this whole setup is invalidated.
Bearish idea - Take a look at the BTC pair, it ended at the top of a giant parallel channel that is in a downtrend, will update with a pic.
