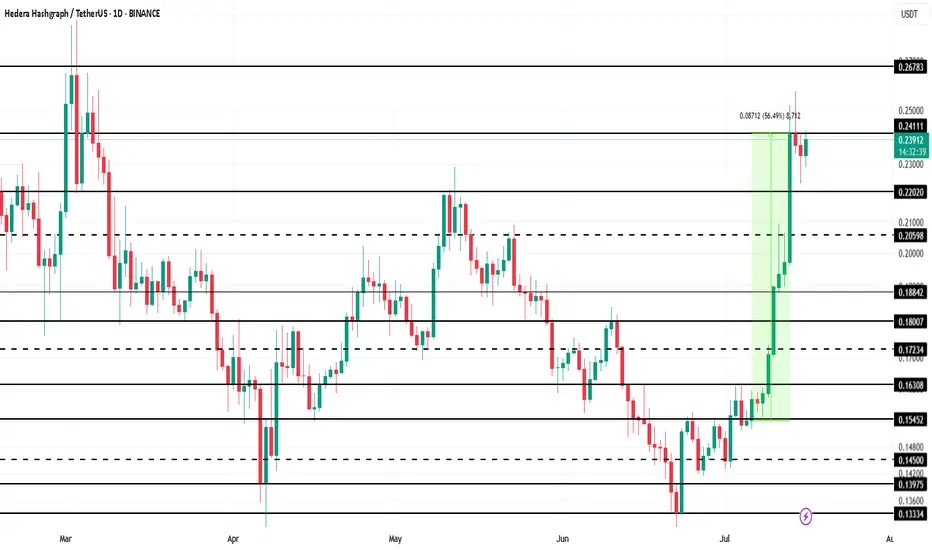
HBAR Price Drop To $0.20 Likely; $53 Million Liquidation AheadBINANCE:HBARUSDT price currently sits at $0.235, encountering resistance at $0.241. Despite its recent rally, the broader market conditions are pulling it down, and the next major support level is at $0.220 . If the altcoin fails to hold above this level, it could slide towards $0.200.
Looking at the liquidation map, there is a real possibility of significant losses for $BINANCE:HBARUSDTtraders. The map shows that if the price drops to $0.20 or lower, approximately $53 million worth of long positions would be liquidated . This would create a wave of selling pressure and potentially drive the price down further.
In the event of a surge in bearish sentiment or increased selling pressure, BINANCE:HBARUSDT could fall below $0.220 , hitting the psychological support level at $0.200. A drop below this critical level would likely trigger the $53 million worth of liquidations, further exacerbating the decline.
However, if BINANCE:HBARUSDT manages to hold above $0.220 and successfully breaches the $0.241 resistance, there could be an opportunity for a rally. A successful bounce off $0.220 could push HBAR towards $0.267 , providing some relief to traders and reinforcing its bullish outlook.
Hbarlong
HBARUSDT Forming Bullish BreakoutHBARUSDT is showing strong signs of a potential bullish trend as it pushes higher with increased momentum. The recent breakout on the daily chart confirms that buyers are stepping in with confidence, supported by a good surge in volume. This uptick in activity is drawing fresh attention from traders and investors who recognize Hedera Hashgraph’s long-term potential in the crypto market. With this breakout move, HBAR could be setting up for a 90% to 100% gain in the coming weeks if market conditions stay supportive.
Hedera’s fundamentals remain solid as it continues to expand partnerships and grow its ecosystem of decentralized applications. Many investors are seeing HBAR as a unique blockchain alternative thanks to its hashgraph consensus mechanism, which promises faster transactions and lower fees compared to traditional blockchains. This unique tech angle has strengthened investor interest, positioning HBAR as a promising long-term play in the altcoin space.
The technical setup on HBARUSDT suggests that further upside may be on the horizon. If the price holds above the breakout level and continues to build higher lows, the next resistance zones could be tested swiftly, potentially driving the pair to new highs. As always, traders should watch for sustained volume and healthy pullbacks, which can offer additional opportunities to join the trend.
✅ Show your support by hitting the like button and
✅ Leaving a comment below! (What is You opinion about this Coin)
Your feedback and engagement keep me inspired to share more insightful market analysis with you!

HBARUSDT 4H Chart Analysis |Volume & Fibonacci Reaction in FocusHBARUSDT 4H Chart Analysis | Volume & Fibonacci Reaction in Focus
🔍 Let’s break down the latest HBAR/USDT setup, highlighting a clear technical reaction and a new opportunity on the horizon.
⏳ 4-Hour Overview
HBAR has completed a strong impulsive leg after breaking above the RR2 of the key reversal trendline, supported by notable volume confirmation. This impressive surge was then followed by a corrective leg—a healthy sign for bulls, especially for those who missed the initial breakout.
📉 Corrective Phase & Fibonacci Support
- The current corrective leg is characterized by decreasing volume, suggesting profit-taking rather than heavy selling pressure.
- Notably, price has reacted firmly at the 0.236 Fibonacci retracement level, aligning with classic pullback zones for continuation setups.
- This volume pattern shows traders are waiting for the next major move rather than exiting positions.
🔺 Bullish Continuation Setup
- A strong candle close above the $0.255 level on either the 1H or 4H timeframe will serve as a clear bullish confirmation.
- Such a breakout may pave the way for another impulsive leg upward, with the first upside target identified near $0.30—roughly 19% higher from the recent candle close.
📊 Key Highlights:
- The prior trend reversal was validated by surge in volume and momentum.
- Volume decline during the correction favors further upside rather than distribution.
- Price is respecting key Fibonacci levels, hinting at trend continuity.
- A confirmed close above $0.255 unlocks the next target at $0.30, marking a potential 19% move.
🚨 Conclusion:
HBAR is showing textbook trend continuation signals. For those sidelined after the initial move, the current consolidation offers a safer re-entry point, with actionable confirmation above $0.255. Stay alert for a strong candle close and keep the $0.30 target in view as bullish momentum builds.

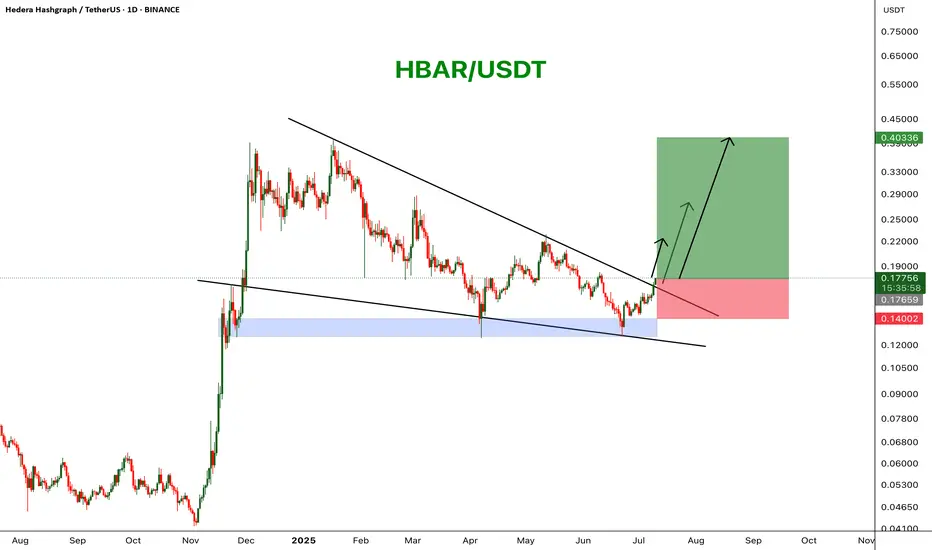
HBARUSDT Wedge BreakoutHBAR has broken out of a falling wedge pattern on the daily chart, signaling a potential bullish reversal. Price is trading above a key support zone and is pushing through descending resistance with strong momentum. A move toward higher targets seems likely if the breakout holds.
Resistance 1: $0.22
Resistance 2: $0.27
Resistance 3: $0.40
Stop Loss: $0.14
$HBAR Double breakout!!CRYPTOCAP:HBAR has officially broken out of the descending channel and completed a clean inverse head-and-shoulders pattern—one of technical analysis's most reliable bullish reversal signals!
Chart Pattern: Inverse Head & Shoulders
Trend Reversal Confirmed
🔹 Left Shoulder ✅
🔹 Head ✅
🔹 Right Shoulder ✅
🔹 Breakout + Retest Zone Holding Strong!
This bullish confirmation, paired with a reclaim above the 200-day EMA, sets the stage for a potential massive upside move, with the target pointing toward $0.40+.
Don’t ignore technicals — trade with clarity, not emotions.

#HBAR/USDT#HBAR
The price is moving within a descending channel on the 1-hour frame, adhering well to it, and is heading for a strong breakout and retest.
We are seeing a bounce from the lower boundary of the descending channel, which is support at 0.1870.
We have a downtrend on the RSI indicator that is about to be broken and retested, supporting the upward trend.
We are looking for stability above the 100 Moving Average.
Entry price: 0.19000
First target: 0.1935
Second target: 0.1970
Third target: 0.2001

HBARUSDT – Bull Flag Breakout Confirmed!The recent price action on HBARUSDT is showing a classic bull flag breakout — a powerful continuation pattern often seen in strong uptrends.
Bull Flag Breakdown:
Flagpole:
Prior to consolidation, HBAR saw a massive rally of over 780%, forming a steep vertical move — this sets the stage as the flagpole.
Flag Formation:
Price entered a downward sloping channel with clear lower highs and lower lows. This consolidation formed the flag, which indicates temporary cooling before the next leg up.
Breakout & Retest:
HBAR broke out of the flag’s resistance, followed by a successful retest of the breakout zone and a bounce off the 0.5 Fibonacci level — all signs of strong technical confirmation.
With this breakout, HBAR is likely to follow through with a measured move, aiming for key targets:
TP1 (Futures): 0.24985
TP2 (Futures): 0.28904
TP1 (Spot): 0.57177
TP2 (Spot): 1.23275+
These targets align with historical resistance and projected flagpole extensions.
If you find this analysis helpful, please hit the like button to support my content! Share your thoughts in the comments, and feel free to request any specific chart analysis you’d like to see.
Happy Trading!!

HBARUSDT 4DHBAR ~ 4D Analysis
#HBAR The next goal is very clear, this will re -test this support. buy gradually from here with a short -term target of at least 15%+

HBARUSDT Bull FlagHBARUSDT is currently forming a promising bull flag pattern on the daily chart.
Bullish Scenario:
If you're not in the trade yet, you can consider entering now for a potential long-term position, or wait for a confirmed breakout followed by a retest for added confirmation.
Bearish Scenario:
If the price breaks down from the bull flag, the next major support lies around the 800 SMA on the 8H, 12H, and daily timeframes.
!!! REMINDER !!!
Always pay attention to the signals when you're in a profitable trade. Secure your gains and consider re-entering on the next pullback.
Be Patient - Don't Panic - Trade Emotionless

HBAR ETF FILING WITH NASDAQ: SPOT LONG HBAR!For people who follow me for a while, know that I'm bullish on HBAR as it's simply the most secure, fastest, cheapest and most energy efficient Layer 1 in the crypto space.
The HBAR ETF has been in the air since december leading to roughly a 8x in price for HBAR. Now, we have an ammended filed (a few changes after comments from the SEC) and a listing proposal for the Nasdaq. So it's about to get real!
DO NOT USE LEVERAGE, YOU WILL GET REKT, JUST BUT ON SPOT - NFA
According to Bloomberg ETF analyst Eric Balchunas the HBAR and Litecoin ETF's will be listed this year. With the ammended filing, HBAR is now in pole position to be the first altcoin ETF after BTC & ETH. Tie that up with massive institutional backing HBAR has from the likes of Google, Tata, IBM, Dell and many more, you can expect some fireworks.
This is the part of the cycle where winners will be chosen, and I believe HBAR is one of them!
First target is $0.30, then $0.40, if $0.40 is broken, we can run to $1 or more...

#HBAR/USDT Ready to go up#HBAR
The price is moving in a descending channel on the 1-hour frame and is adhering to it well and is heading to break it strongly upwards
We have a bounce from the lower limit of the descending channel, this support is at a price of 0.29200
We have a downtrend on the RSI indicator that is about to be broken, which supports the rise
We have a trend to stabilize above the moving average 100
Entry price 0.3160
First target 0.3372
Second target 0.36075
Third target 0.38900

HBARUSD - Weekly forecast, Technical Analysis & Trading IdeasMidterm forecast:
While the price is below the resistance 0.40089, beginning of downtrend is expected.
We make sure when the support at 0.22979 breaks.
If the resistance at 0.40089 is broken, the short-term forecast -beginning of downtrend- will be invalid.
Technical analysis:
A peak is formed in daily chart at 0.40140 on 01/17/2025, so more losses to support(s) 0.29204, 0.26950, 0.24919 and minimum to Major Support (0.22979) is expected.
Take Profits:
0.29204
0.34000
0.37397
0.47800
0.57563
__________________________________________
❤️ If you find this helpful and want more FREE forecasts in TradingView,
. . . . . Please show your support back,
. . . . . . . . Hit the 👍 BOOST button,
. . . . . . . . . . . Drop some feedback below in the comment!
🙏 Your Support is appreciated!
Let us know how you see this opportunity and forecast.
Have a successful week,
ForecastCity Support Team
0.57563

Crypto TRUMP PUMP! - XRP BTC HBAR ADA - Have the stars aligned?Well the BIG DAY is FINALLY HERE!
Are you ready for TRUMP 2.0?
Regardless ready or not the world is about to get SPICY.
LOVE HIM OR HATE HIM One thing that 🟢SeekingPips🟢 is looking forward to is VOLATILIY. Well in the markets at least Currencies, Stocks, ETF's what ever tickles your fancy BUT I'M SOOOOOO looking forward to these CRYPTO MARKETS.
Oh YEAR & this HBAR TRIANGLE BREAKOUT still looks GREAT TO ME!
LET THE MAYHEM BEGIN.

HBAR Hedera BREAKOUT Still in Play? LONG Bulls Are Still Hungry!I'm getting a lot of messages and feedback regarding the heads up I posted earlier in the week with the
🟢 HBAR BIG TRIANGLE BREAKOUT POST 🟢
The BIG QUESTION is... "What Next for HBARUSD?"
&
The ANSWERi is SIMPLE..."We monitor VOLUME and RIDE THE WAVE"
👍Have A GREAT WEEKEND.
&
REMEMBER TO FOLLOW 🟢SeekingPips🟢 to stay AHEAD OF THE PACK.👌

HBAR Hedera *SeekingPips* Lets His CHART do the TALKING! HBARUSDSomedays are for trading and others are just to sit on your hands and RIDE THE WAVE.👌
✅️TODAY IS DEFINITELY ONE OF THOSE DAYS.✅️
🟢 I hope you took something from SeekingPips MAGIC this week. 😉
⚠️ FOLLOW NOW FOR THE LATEST ANALYSIS⚠️

#HBAR /USDT Ready to go higher#HBAR
The price is moving in a descending channel on the 1-hour frame and sticking to it well
We have a bounce from the lower limit of the descending channel, this support is at 0.2961
We have a downtrend on the RSI indicator that is about to be broken, which supports the rise
We have a trend to stabilize above the moving average 100
Entry price 0.3065
First target 0.3138
Second target 0.3250
Third target 0.3385

HBAR/USDT Approaches Apex: Bullish Breakout Ahead?HBAR/USDT is currently trading within a bull flag pattern and approaching the apex. A potential bullish breakout may be on the horizon.
The price has faced multiple rejections from the descending trendline but has consistently found strong support at the lower support zone. Keep an eye on the price action for a possible upward move.
DYOR, NFA
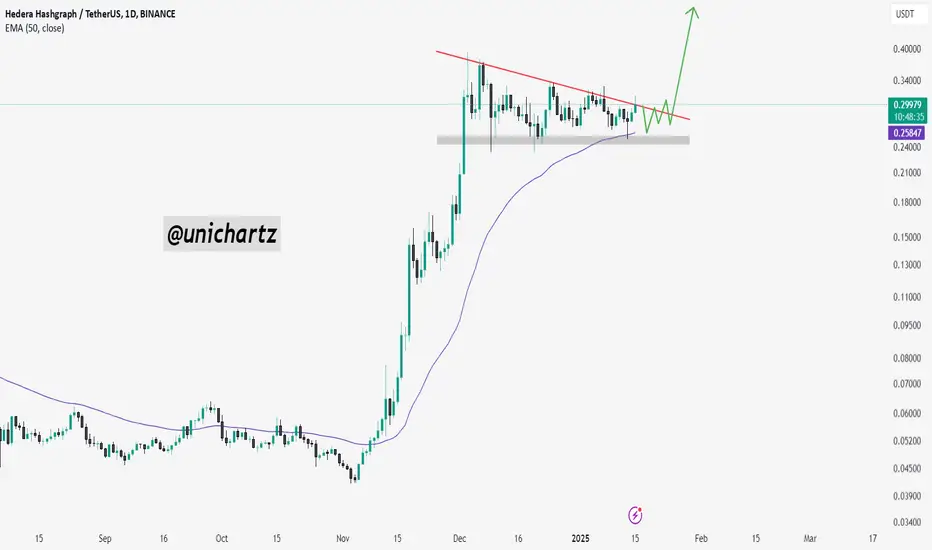
HBAR Hedera BIG Triangle BREAKOUT? HBARUSD Looking to EXPLODE!As we comb through a handful of Cryptos this morning HBAR is another one one SeekingPips RADAR.
ℹ️ A simple triangle formation will inevitably lead to a BREAKOUT.
STATISTICS tells us that there is a HIGHER PROBABILITY of a brekout to the UPSIDE as price will favour the TREND DIRECTION prior to the CONSOLIDATION.
As 2025 has barely begun it's not a bad idea to position yourself from now.
SUPER SECRET 🟢SEEKING-PIPS🟢 LESSON IS...
One of our TRADING 101 lessons it's BUY ABOVE the YEARLY OPEN.
It really is a great filter I have used for many years and one of the key filters I teach new traders.
SHHHH DON'T TELL ANYONE ELSE 😉
✅️I would appreciate your follow a BOOST OF THIS POST.
✅️I will continue to share my 20+ years of TRADING WISDOM as long as I have interaction on my posts.
HAVE AN GREAT DAY❕️

HBAR LONG SET UPTitle: BUY HBAR
Asset: Crypto
Symbol: HBAR/USD
Time Frame: 4hr
Platform: Coinbase
Entry Price 1: $0.28500
Entry Price 2: $0.23500
Stop Loss: $0.18500
Take Profit 1: $0.33500
Take Profit 2: $0.38500
Take Profit 3: $0.43500
Take Profit 4: $0.48500
Status: ACTIVE

HBAR BUY COMING SOONBuying HBAR around the weekly order book. A strong bounce around the 0.44-0.37 range is expected. Bids have been placed.

#HBAR/USDT Ready to go higher#HBAR
The price is moving in a descending channel on the 1-hour frame and sticking to it well
We have a bounce from the lower limit of the descending channel, this support is at 0.2750
We have a downtrend on the RSI indicator that is about to be broken, which supports the rise
We have a trend to stabilize above the moving average 100
Entry price 0.2900
First target 0.300
Second target 0.3145
Third target 0.3310

HBAR LONG SET UPHBAR LONG SET UP, RETEST OF RECENT HIGH
buy at $0.27
take profit 1 - $0.35
take profit 2 - $0.40
