Hbarlong


HBAR is close to bottoming.I think we'll see HBAR bottom out at the bottom trend line of the descending wedge pattern around the .0445 level. After this we will ascend to the top trend line hitting it somewhere around mid to the end of December. If HBAR price can break the upper wedge then hold on tight!


This currency is a bird! Learn to flyAfter exiting its downward channel, HBAR currency can be said to have formed a corner pattern, so there is a possibility of growth of up to 62% for this currency.
Two support ranges have been specified for this currency, one range is for daily time and the other is for 4-hour time.
Safe entry for this currency is after breaking the green range
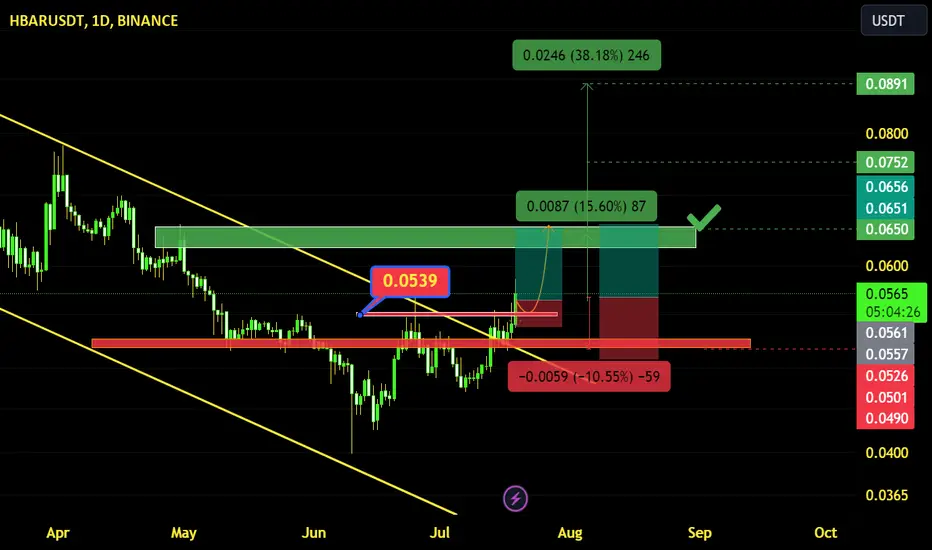
HBAR and the potential opportunity Hi Everyone;
today we have one of the best risk to reward Investment opportunity
it is almost 400 time the risk and the chart is look very promising.
I expect breaking the previous bear market key point will clear the way to the final target.
good luck everyone.

Trade Alert - Long Hedera HashgraphI know, I know. Very last post. The title of my video, “Now is not the time to be buying altcoins”. And I do stand by that statement for the most part. Because for the most part many of the larger cap alts (which is mainly what I trade in a bear market) do employ a variant of the PoS mechanism. And this is really what the SEC has been targeting at the moment, minus Ethereum for some unknown reason. Hedera is not a traditional blockchain and does not use either PoW or PoS. Hedera Hashgraph is a distributed ledger technology that aims to provide a secure, fast, and fair platform for decentralized applications. To accomplish this, Hedera Hashgraph employs a consensus algorithm called "hashgraph." This algorithm enables high transaction throughput by leveraging a directed acyclic graph (DAG) structure, where each transaction is represented as an event. These events are then asynchronously gossiped among network nodes, forming a shared history of all transactions. By utilizing a gossip protocol and virtual voting, hashgraph achieves consensus on the order and validity of transactions. Moreover, Hedera Hashgraph incorporates a governance model to ensure decentralization and fair decision-making. The technology offers potential benefits for applications requiring speed, security, and scalability, such as decentralized finance, supply chain management, and social networks.
Now, that I have touched a bit on the fundamentals in hopes of helping to justify my trade :-) let’s quickly look at the technicals.
Hedera has reached the end of a bullish descending wedge which also runs into some very solid support at .044. Should this break then, yes, we’ll probably drop down to that next level at .036. But odds are in our favor here that we go up instead. I’ll be shooting for that 200 day ma which, right now, sits at .058. My stop out will be right around .0415.
Let’s go!
Stew


HBAR | Getting ready to fly Hbarusdt
Higher Time-frame
Trying to break horizontal resistance.
If the price rejects from here, it will retest the trendline support, with a successful retest expecting a massive bullish move.
If you are trading now then it will be a foolish move, we should have to wait for breakout or retest.
This is just my opinion, God knows better.
Remember: We only give ldea's from our
experience and knowledge, it does not
mean that it will be 100% correct, the
market is always unpredictable, anything
can happen anytime.
Always trade with your own research and
knowledge. If You Are Satisfied With Our
Work Then Join.

HBAR CLEAN MOVE HERE Hbar breaking the Downtrend and now trading in PENNAT wait for Breakout and then open a long Trade and collect 50% move
HAPPY TRADING

HBAR LOOKING GOOD FOR A QUICK SCALPHBAR Double Bottom on 15 minutes time frame on 1 hour chart price is moving in descending channel

HBAR 3 White Soldiers + Bullish Divergence + Trend Line SupportTarget 50% retrace of recent top, Risk Reward 1:12, enter the trade after the double bottom is confirmed right after break of the $0.513.

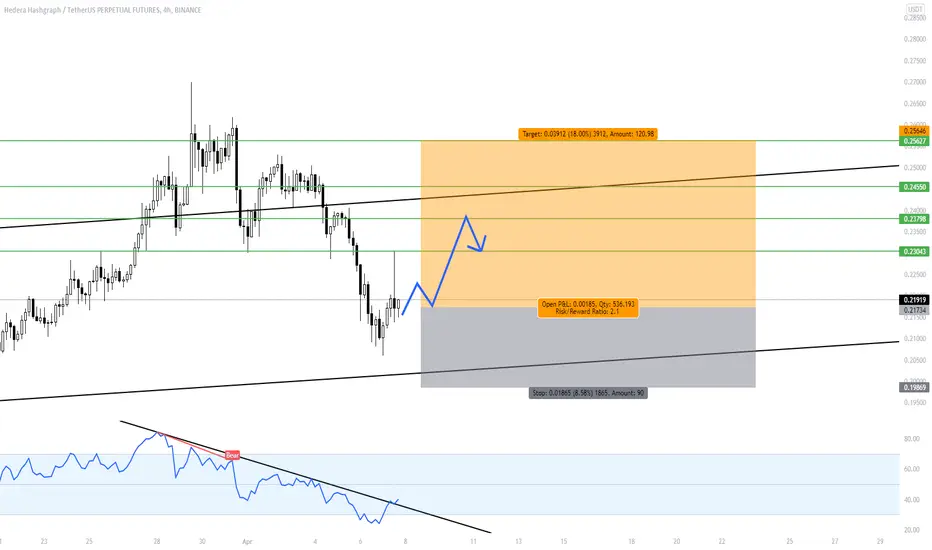
HBAR/USDT - LONG 12H TF----- Welcome, dear followers! -----
- Here is my trading methodology. I trade with a normal system and analysis of resistance and support, as well as price reversal patterns.
- For the record, I do not place a stop loss within my trades. So that I only risk 1.5% of my total capital in order to support the loss due to a price reversal against me.
- If a price reversed against my expectation and touched the drawn line r3, then I transferred targets to the entry point and waited for the price to close at it with a loss equal to almost zero.
- Today's deal is shown in the chart, and here are the entry and exit points below.
-- Support me with numbers and follow up on my account for other deals in the future. Thank you for coming to this part.
---------------------------------------------------------
⚡️⚡️ #HBAR/USDT ⚡️⚡️
Client: My-Binance Futures
Trade Type: Breakout (Long)
Leverage: Cross (2X)
Entry Targets:
1) 0.06305 - 100.0%
Take-Profit Targets:
1) 0.06644 - 20.0%
2) 0.06882 - 20.0%
3) 0.07274 - 20.0%
4) 0.07898 - 20.0%
5) 0.08381 - 20.0%
Trailing Configuration:
Entry: Percentage (0.0%)
Take-Profit: Percentage (0.75%)
Stop: Breakeven -
Trigger: Target (1)

HBAR Long set up HBAR is holding strong support in 1D time frame and it is the edge of the BO for the upper resistance trendline. It will be fruitful long after BO and in the coming few days. Add it to your list of observations or take partial entry.

🟢 HBARUSDT - 1D (06.10.2022)🟢 HBARUSDT
TF: 1D
Side: Long
SL: $0.054898
TP 1: $0.062470
TP 2: $0.066681
TP 3: $0.070084
TP 4: $0.073487
HBAR looks bottomed here and the only way is up. Buy and hold to end of the year.

HBAR Long Idea2020 Resistance has now become support, we like this area for a long as a non leveraged trade with an SL RISK of 4 to 5%.

HBARNot financial advice. The essence of investing & trading is the intelligent and patient preying on the greed, fear, impatience, addiction and ignorance of the majority. It's definitionally Darwinian.

HBAR USDT Close to breakout of the down trendBulls need to step in, Keep your eyes for blue and green Volumes bars. Trade is not yet active but alarm has been set to make the entry. gl

Hedera Hashgraph (HBAR) formed big Cypher for upto 2639% rallyHi, dear friends, hope you are well and welcome to the new trade setup of the Hedera Hashgraph (HBAR) coin.
Previously we had a nice trade of HBAR in the short term:
Now on a monthly time frame, HBAR has formed a bullish Cypher pattern.
Note: Above idea is for educational purpose only. It is advised to diversify and strictly follow the stop loss, and don't get stuck with trade.

HBARNot financial advice.
The essence of investing & trading is the intelligent and patient preying on the greed, fear, impatience, addiction and ignorance of the majority. It's definitionally Darwinian.

HBAR is ready for a good uptrend.In my opinion, the correction of this currency is over and it will move up in the next few days.
If the number of followers reaches 100 this week, I will put pure analysis every day.
Follow fractal_analysis98

HBAR trying to breakout & move up 4hrHBAR trying to breakout & move up on the 4hr.
Bullish harmonicss formed, RSI breaking out everything look perfect so far.
HBAR is Really good Altcoin to Buy...Hello friends...
hbar broke daily bear base and bear trend and now is bullish in Daily time frame.
there are several resistances as 3D bear base and curve trend.
i put a buy order where you see in the chart. R/R is 3.
please ask your questions in comments.
