HBAR Potentially in Expanding Flat CorrectionHBAR may be in an expanding flat correction now, if that's the case & we drop below the bright green box - expect the drop to continue short-term, and then stop around the 1.618 level of our trend-based fib. That would give us an area around 9.5-10 cents for considering new longs.
Pre-req: Bitcoin not dropping below it's previous lows last summer and completing a running flat correction.
HBARUSD

HBAR Falling Wedge SetupHBAR is not a project i like nor really trust or think is legit but im still willing to take a chance here for the sake of the chart but that's about it.
It's oversold at a Potential Falling Wedge Demand Line on a 5th wave.


HBARUSDT - what is not written in books on tradingWork not according to a template, using non-book trend ones(observation showed that you need to work in the past and a chart to form in the future), as long as you are all clear on paper - the result will be the same. Deviate from the generally accepted rules, come up with something new (or rather, something that has already been invented, but a small number of people know about it) that's why it works👀
in the replay you can see my HBAR idea and notice how clearly I built the schedule and how clearly it works out in the future and crossing the finobbach levels, which I highlighted with arrows, always point to the exact bottom/high of the instrument🦾

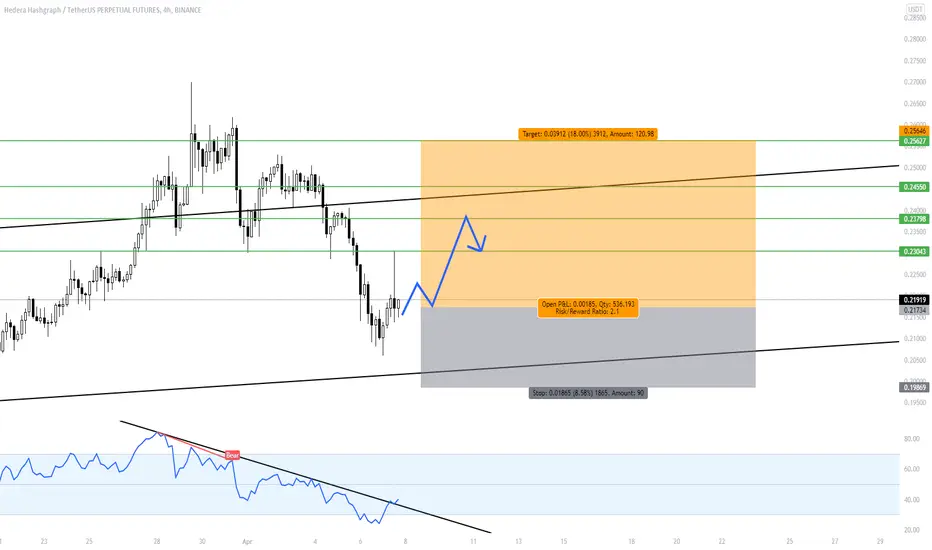
HBARUSDT, Is moving toward the analysisHello everybody
According to our last analysis of HBAR you can see after the price broke the support trendline the price was ready to start its their drop and exactly happend and now as you can see after the price re-test again the key point level and it has low power to break it it has ready to dump more to the prz level that we shown on chart and in there zone it can be supported and be ready to move more upwrds.
Draw plan, Do it exactly, Be your own hero
Good Luck
Abtin
Previous analysis :

Hedera (HBAR) - April 9hello?
Welcome, traders.
By "following", you can always get new information quickly.
Please also click "Like".
Have a nice day.
-------------------------------------
(HBARUSDT 1W Chart)
Above 0.16: Expected to create a new wave.
(1D chart)
(buy)
- After confirming that it is supported above 0.2160
- After confirming the support at 0.2361
(Stop Loss)
- When it falls below 0.2044 and receives resistance
(Sell)
- When resistance near 0.3
- When receiving resistance near 0.3627
A move above 0.3627 is expected to trigger a sharp move.
------------------------------------------------------------ -----------------------------------------------------
** All indicators are lagging indicators.
Therefore, it is important to be aware that the indicator will move accordingly as price and volume move.
However, for the sake of convenience, we are talking in reverse for the interpretation of the indicator.
** The MRHAB-O and MRHAB-B indicators used in the chart are indicators of our channel that have not been released yet.
(Since it was not disclosed, you can use this chart without any restrictions by sharing this chart and copying and pasting the indicators.)
** The wRSI_SR indicator is an indicator created by adding settings and options to the existing Stochastic RSI indicator.
Therefore, the interpretation is the same as the traditional Stochastic RSI indicator. (K, D line -> R, S line)
** The OBV indicator was re-created by applying a formula to the DepthHouse Trading indicator, an indicator disclosed by oh92. (Thanks for this.)
** Support or resistance is based on the closing price of the 1D chart.
** All descriptions are for reference only and do not guarantee a profit or loss in investment.
(Short-term Stop Loss can be said to be a point where profit and loss can be preserved or additional entry can be made through split trading. It is a short-term investment perspective.)
---------------------------------

HBAR trying to breakout & move up 4hrHBAR trying to breakout & move up on the 4hr.
Bullish harmonicss formed, RSI breaking out everything look perfect so far.
HBAR can reach 0.33$🌳HBAR was in a falling wedge pattern. This bullish pattern is already broken so this means it can increase further without any problems! The expected target is around 0.33$ which is also a resistance as well.
_ _ _ _ _ _ _ _ _ _ _ _ _ _ _ _ _ _ _ _ _ _ _ _ _ _ _ _ _ _ _ _ _
Thank you for seeing idea .
Have a nice day and Good luck

HBAR is Really good Altcoin to Buy...Hello friends...
hbar broke daily bear base and bear trend and now is bullish in Daily time frame.
there are several resistances as 3D bear base and curve trend.
i put a buy order where you see in the chart. R/R is 3.
please ask your questions in comments.

HBAR working on its 7th consecutive green candle. It is overdue for a red daily candle, but its pump thus far has been impressive. The yellow horizontal trendline represents the neckline of the double bottom pattern the price action is currently painting. Odds are good it will trigger this double bottom in the near future but I anticipate a slight pullback prior to that. Of course it could defy that probability and continue to just churn out more green candles but odds of an overdue pullback occurring are likely. In the medium term I think it will trigger this double bottom soon enough. First things first it needs to maintain the 1 day 50ma as solidified support. *not financial advice*

HBAR massively weekly falling wedgeHBAR has corrected from its high forming a falling wedge reversal pattern on the weekly chart with higher volume weekly candles forming as its come into a weekly demand zone. Price respecting higher high and higher low bullish structure on HTF and in the low of the leg. Id expect to see a reversal to form in the coming weeks and believe this is a bottom forming and waiting for a breakout to the upside out of the wedge. MADC on weekly showing signs of bullish momentum coming into the market as histogram and MAs converge. Another bullish looking alt coin I believe and may go for the highs on the next move

Hedera (HBAR) - March 22Hello?
Traders, welcome.
If you "follow", you can always get new information quickly.
Please also click "Like".
Have a good day.
-------------------------------------
(HBARUSD 1W Chart)
(Full: )
The move is deviating from the previous trend, but if it finds support near the 0.20491984 point, I would expect it to move above the 0.29992521 point.
Resistance section: 0.36030279-0.39589452
Support section: around 0.12789479
-------------------------------------
(HBARUSDT 1D Chart)
-------------------------------------
(HBARBTC 1W chart)
0.0000 0313 - 0.0000 0398 or higher: expected to continue uptrend
If the price is maintained above the volume profile section formed in the section 0.0000 0398 - 0.0000 0523, it is expected to create a new wave.
------------------------------------------------------------ -----------------------------------------------------
** All indicators are lagging indicators.
Therefore, it is important to be aware that the indicator will move accordingly as price and volume move.
However, for the sake of convenience, we are talking in reverse for the interpretation of the indicator.
** The MRHAB-O and MRHAB-B indicators used in the chart are indicators of our channel that have not been released yet.
(Since it was not disclosed, you can use this chart without any restrictions by sharing this chart and copying and pasting the indicators.)
** The wRSI_SR indicator is an indicator created by adding settings and options to the existing Stochastic RSI indicator.
Therefore, the interpretation is the same as the traditional Stochastic RSI indicator. (K, D line -> R, S line)
** The OBV indicator was re-created by applying a formula to the DepthHouse Trading indicator, an indicator disclosed by oh92. (Thanks for this.)
** Support or resistance is based on the closing price of the 1D chart.
** All descriptions are for reference only and do not guarantee a profit or loss in investment.
(Short-term Stop Loss can be said to be a point where profit and loss can be preserved or additional entry can be made through split trading. It is a short-term investment perspective.)
---------------------------------


Potential very large bull-flag on HBAR/USDAlthough I am a crypto-sceptic, I am very bullish on HBAR because I believe it is the only real contender with any potential in the crypto marketplace and it is very likely to displace the majority of it's competitors and become the dominant crypto of the future.
I held HBAR from 1 cent to 30 cents until I liquidated anticipating a pullback and a 2nd entry opportunity.
The pullback did indeed occur, however, it's looking likely that we will not ultimately dip that far below 20 cents.
We can see that HBAR during the 2021 dip-and-rally formed strong MACD convergence during a downmove.
This time, we have an even stronger MACD convergence combined with what appears to be a bull-flag formation within a falling wedge.
Although I haven't done a proper count, I also suspect this may constitute wave 4 which means we could see a substantial Wave 5 move over the Spring + Summer.
The last time this occurred, HBAR pumped by about 260%.
I suspect a similar range could be on offer this time around.

HBAR to break the resistanceThere seems to be a good chance for HBAR to break the resistance as shown if it does so on good volume we have a potential to the upside.

HBAR is also in a Running FlatSimilar to Bitcoin, HBAR is completing a running flat correction, in an uptrend, and should be expected to revisit ATHs; with a good chance of making higher ATHs.
We need our monthly lows to continue closing above 19.5 cents to confirm, and we need the overall market to hold up (BTC continuing in a running flat correction as well).
A couple of positive confirmations we can see that this is the case, now:
1.) Wave B retraced more than 100% of Wave A
2.) Wave C retraced less than 100% of Wave B, and stopped exactly at the 100% trend-based fib extension
3.) The most common relationship between waves A & C is 1:1, on the monthly we are less than 2% shy of exactly 1:1 (very good)
For more confluence, see the links to related ideas below. HBAR's BTC and ETH pairs look very bullish, and BTC's running flat looks quite similar to this one.

Hedera (HBAR) - February 17Hello?
Traders, welcome.
If you "follow", you can always get new information quickly.
Please also click "Like".
Have a nice day.
-------------------------------------
(HBARUSD 1W Chart)
(Full: )
It must rise above the 0.2999 2521 point to turn into an uptrend.
Expect resistance in the range 0.3603 0279 - 0.3968 9452.
If it falls from 0.2049 1984 point, you need Stop Loss to preserve profit and loss.
-------------------------------------
(HBARBTC 1W chart)
0.0000 0398 - 0.0000 0523 or higher: Expected to create a new wave.
------------------------------------------
We recommend that you trade with your average unit price.
This is because, if the price is below your average unit price, whether the price trend is in an upward trend or a downward trend, there is a high possibility that you will not be able to get a big profit due to the psychological burden.
The center of all trading starts with the average unit price at which you start trading.
If you ignore this, you may be trading in the wrong direction.
Therefore, it is important to find a way to lower the average unit price and adjust the proportion of the investment, ultimately allowing the funds corresponding to the profits to be able to regenerate themselves.
------------------------------------------------------------ -----------------------------------------------------
** All indicators are lagging indicators.
Therefore, it is important to be aware that the indicator moves accordingly with the movement of price and volume.
However, for convenience, we are talking in reverse for the interpretation of the indicator.
** The MRHAB-O and MRHAB-B indicators used in the chart are indicators of our channel that have not been released yet.
(Since it was not disclosed, you can use this chart without any restrictions by sharing this chart and copying and pasting the indicators.)
** The wRSI_SR indicator is an indicator created by adding settings and options to the existing Stochastic RSI indicator.
Therefore, the interpretation is the same as the traditional Stochastic RSI indicator. (K, D line -> R, S line)
** The OBV indicator was re-created by applying a formula to the DepthHouse Trading indicator, an indicator disclosed by oh92. (Thanks for this.)
** Support or resistance is based on the closing price of the 1D chart.
** All descriptions are for reference only and do not guarantee a profit or loss in investment.
(Short-term Stop Loss can be said to be a point where profit and loss can be preserved or additional entry can be made through split trading. It is a short-term investment perspective.)
---------------------------------

HBARUSDT, It can make new LLHello everybody
One of the most popular and powerful project in crypto is hedera hashgraph, You must be asking yourself, Why ?? Because ...
If you want to learn Fundamental & Technical analysis send us messages in private ---> Our id is in profile
According to the chart and our previous serial analysis, after the price broke that trendline support zone area the price its be ready to fall down and make new LL and this scenario happend and after some pullback we were made new LL and now the kind of last cycle can be happend and what kind of root that we shown on chart can be happen and make new LL.
If you wanna entrance in position and make profit from this maybe drop price you should observe your capital and put your stop loss at the end of the higher shadow of HL a little upper and sit and only manage your position, because the trend do everything we wanna need . :D :D :D ;D
Good Luck
Abtin
Previous analysis :

HBAR Breakout!!Hedera is looking very nice as talked about yesterday, we had a bullish breakout of our bullish triangle and another significant now support level at 0.254 cents (USD). Overall its looking like we could be in for a bit more of a run before cooling off for a healthy couple red days, keep in mind Bitcoin is the biggest factor aswell so we need to keep an eye on that for market direction. My thoughts are that we could possibly get up to the 0.2 FIB level before coming back down briefly but then again we could smash right through aswell. Heres why... the bollinger bands, our top band lays directly above our current price action we actually wicked too it today, but if we can get up and close ontop of this top band price action could get some big momentum. Most of the time when we see closes ontop of this top band price action goes for a significant run to the upside, the same applies with the downside. Now lets look at our wavetrend, this is where i start to feel like we could see this bullish wave coming to an end soon, but then again we still could have a long ways to go. We are just breaking through the midline and we are still pointing pretty vertical, we are seeing a slighyt tick down but we are still point up (good sign) the slight curl down makes me believe that the bullish steam is fading away. Now this will tell us more when we get here, but the white resistance line we got rejected at 2 times in a row, we are quickly approaching this level and if we can successfully breakthrough we are looking at a potential run to the top zone!! If we reject or start to curl heavier we could be coming down for brief downside. Now the MACD is looking decent, we are still seeing increasing green bars day after day but our current bar doesn't have much increase from yesterday, this could be a sign of momentum fading and the beginning of a decrease to come! Now i personally hope we see a little downside as i will be DCA more into this project as discussed yesterday! Not financial advice just my opinion!

$HBAR, 0.3$ seems not that hard from here...$HBAR
0.3$ seems not that hard from here...
UCTS 1D Buy in place
Volume starting to grow again on the daily
Worth a shot 👍
#HBAR

HBAR Analysis1W/1D Charts
HBAR price action on weekly looks nice here, big impulse moves up and corrective moves back into demand zones.
Had a nice reaction off weekly demand zone forming another reversal candlestick formation with a pinbar close on prior weekly candle.
Again, MACD converging and showing some signs of strength with bullish divergence on the daily.
Come into a daily supply zone, expecting a reactionand pullback into the weekly demand zone again.

HBAR possible drop zoneLooks to me HBAR still didn't find bottom. Have couple option what I watching atm. Small drop and reaction from there (all is again up to BTC what will happens) and if bulls manage to break that upper resistance I will consider new alternate count. If we see rejection from upper resistance or bulls not manage to hold this level just little bit lower where is price now watch for larger support bellow.
Also this is what I watching on HBARBTC .
HBARBTC is on very important support. If bulls don't hold and push we can see even larger drop.

HBAR Breakdowns. Your welcome. BINANCE:HBARUSD
I will add other TFs. Paint a better picture but right now I wouldn't even buy HBAR if you paid me. I'm going to get into level refinement on micro structure. Ill Also add weekly bias.
