HBAR: Big Guy PlayThe last idea for today, will not write a long read and will keep it short instead.
With BINANCE:HBARUSDT we're moving inside the long shallow uptrend, then formed the triangle with the descending wedge inside, which guided us to the lower zone of this long uptrend. We're not having other chance than to get some new liquidity in and break out of the wedge for probably the last leg of this uptrend before coming down into the possible autumn correction.
What else adds confidence to these words? I just LOVE how this Big Guy indicator plays out on HBAR showing the good moves everytime after the zones with big guys walking in. And we've just had another one pop up.
We're currently AT the resistance zone and we might either break out right about now, or will test out the liquidity zone again within next few hours and pump!
Consider short Stop Loss below the yellow trendline, or the longer one below the previous higher low.
Have a good buy in and a calm night
👁️ A.I.Vision
HBARUSDT

Hbar Decision time #Hbar is in higher high higher low trend. This trend will break if Hbar breaks the red trendline and price will go down to black lines.
If Hbar breake green trendline then it will pump again.
High chance for red trendline breakdown.

Hbar Decision time#Hbar, if it breaks any green trendline then it pump.
If it breaks any blue trendline then it will dump because a trend of higher high higher low will breakdown.
Decision time is coming soon.
HBAR setting up for a huge move north.HBAR has been playing the rollercoaster game lately - up, down, up, down, up, down.. ect. If the current momentum continues I fully expect HBAR to break out of the descending wedge pattern to the upside in the coming days.

HBAR/USDT Continue to Bullish Movement ?? Hedera HashHello Paradisers, One to Keep on Your Radar!
💎 HBAR continues to exhibit an upward trajectory, maintaining its position above the bullish trendline, which is a positive indicator.
💎Currently, HBAR is undergoing a retest in the demand zone, with the likelihood of resuming its ascent to challenge the resistance of the triangle pattern. Given the current market conditions, there's a good chance HBAR could break through this pattern to establish a new higher high.
💎The bullish outlook would be invalidated if HBAR closes below the resistance trendline and the green line.

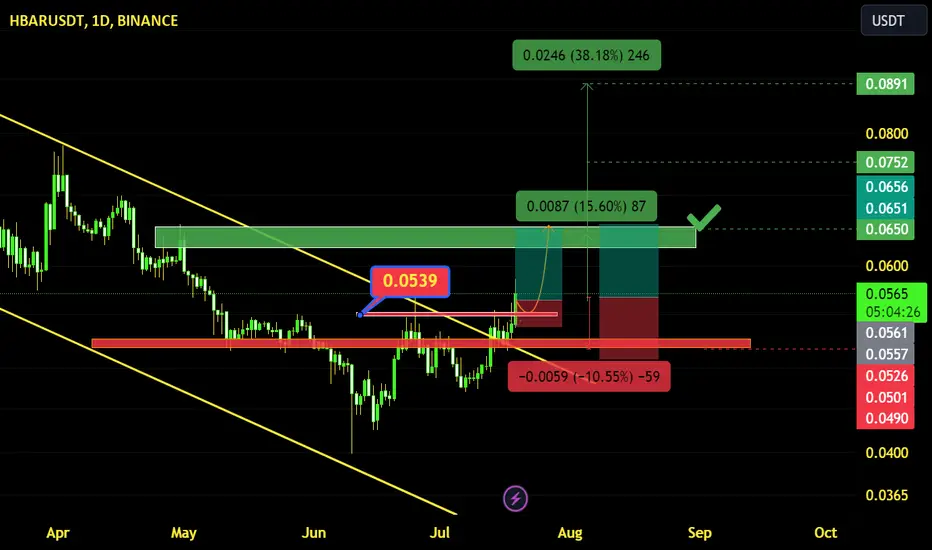
HBAR is stable in support zoneHBAR hashgraph currency analysis
In this analysis, the important support areas namely 0.055, 0.051 and 0.046 were determined and we have different reactions on each of them.
In the first support zone, it is possible to return to the resistance of 0.062, but in the second zone, 0.051 Yen, this zone is probably not very valid and will break, but it is one of the important zones that has been able to turn the trend upwards three times in the past, and also in the third zone. Support means 0.046, which can be very important, so keep it in mind.
On the other hand, for the resistance areas, the first area that we mentioned is 0.0652 and the next area is at 0.068, where the price can even be at the level of a pullback (if the trend is completely upward) and we can consider correction from these areas.

HBARUSDTHBARUSDT is trading in Symmetrical triangle.
Recently the price has retracing to 50% Fib level, which is the support level from inclining trendline. There are more chances that the bulls will strike back and took advantage from this bullish confluence.
What you guys think of this idea ?

HBARUSDTBINANCE:HBARUSDT SHORT IDEA
⚠️Note:
In this type of signals, only the entry point and trade direction are specified, and stop loss and target are not determined.
If you are interested in entering these signals, please provide a stop loss and a logical market-based target.
⛔"Daily crypto market analyses I provide are personal opinions & not financial advice. Trading carries risks, so do your own research & seek advisor's help.#DYOR"
Don't forget to like and comment

This currency is a bird! Learn to flyAfter exiting its downward channel, HBAR currency can be said to have formed a corner pattern, so there is a possibility of growth of up to 62% for this currency.
Two support ranges have been specified for this currency, one range is for daily time and the other is for 4-hour time.
Safe entry for this currency is after breaking the green range

Whether it can rise above 0.0731 is the keyHello?
Traders, welcome.
If you "Follow", you can always get new information quickly.
Please also click "Boost".
Have a good day.
-------------------------------------
(HBARUSDT 1M Chart)
The question is whether it can rise above 0.0731.
(1W chart)
If price holds above 0.0731, it will enter a sharp volatility zone with few support and resistance zones.
Therefore, the key is whether it can receive support around 0.0613 and rise.
(1D chart)
Whatever the picture, the full-fledged rise is expected to begin when it rises above 0.1037.
Therefore, it is important to check the support around 0.0613-0.0731.
-------------------------------------------------- -------------------------------------------
** All descriptions are for reference only and do not guarantee profit or loss in investment.
** The trading volume indicator is displayed as a candle body based on 10EMA.
Display method (in order of boldest)
More than 3x 10EMA trading volume > 2.5x > 2.0x > 1.25x > trading volume below 10EMA
** Even if you know other people's know-how, it takes a considerable period of time to make it your own.
** This is a chart created with my know-how.
---------------------------------

HBAR: Rising Wedge BreakoutHedera Hashgraph (HBAR) technical analysis:
Trade setup : Breakout from a Rising Wedge pattern and in an Uptrend. Notably higher volumes on up days recently, which is also positive. Upside to $0.08 resistance or even $0.10.
Trend : Uptrend on Short- and Medium-Term basis and Neutral on Long-Term basis.
Momentum is Bullish (MACD Line is above MACD Signal Line and RSI is above 55).
Support and Resistance : Nearest Support Zone is $0.050 (previous resistance), then $0.035. The nearest Resistance Zone is $0.060, which it broke, then $0.080 and $0.100.

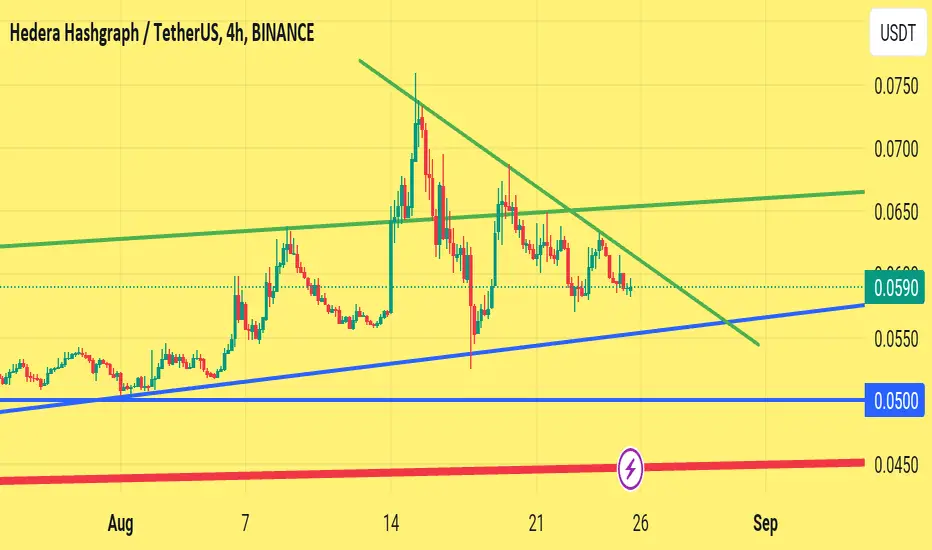
The Liquidity Lever: How #HBARUSDT Could Utilize Buying Area💎 Let's take a closer look at #HBARUSDT, which has been on a steady climb within a wedge pattern over the last two months. In early August, the price found support at the significant psychological level of $0.05. This level coincides with the mid-term demand zone and also aligns with the 200 Simple Moving Average, reinforcing $0.05 as a crucial area to monitor.
💎 After bouncing off this support zone, #HederaHashgraph ascended, only to be halted at the wedge's upper boundary, effectively bouncing off the resistance trendline. This could suggest two potential bullish scenarios: a more substantial correction downward, possibly to the wedge's bottom, or a brief break below the uptrend trendline to gather fresh buying liquidity before continuing upward.
💎 At the same time, a break above the wedge could lead to a rapid rise towards the $0.076 double Fibonacci resistance, and we must be prepared for both of these bullish possibilities.
💎 The less likely scenario is a trend reversal to the downside, which would only occur if #HBARUSDT breaks below demand zone, 200SMA and the $0.045 support. Such a move would undoubtedly tip the scales in favor of the bears. Stay tuned, Ladies and Gentlemen of ParadiseClub, as we continue to navigate the dynamic world of crypto!

HBARUSDTBINANCE:HBARUSDT SHORT
⚠️Note:
In this type of signals, only the entry point and trade direction are specified, and stop loss and target are not determined.
If you are interested in entering these signals, please provide a stop loss and a logical market-based target.
⛔"Daily crypto market analyses I provide are personal opinions & not financial advice. Trading carries risks, so do your own research & seek advisor's help.#DYOR"
Don't forget to like and comment

HBAR: Rising WedgeHedera Hashgraph (HBAR) technical analysis:
Trade setup : Trading in a Rising Wedge pattern and in an Uptrend. Notably higher volumes on up days recently, which is also positive. Trend Traders: wait for a breakout. Swing Traders: can trade between the wedge trendlines.
Patterns : Rising Wedge It usually forms after an uptrend and suggests a potential bearish reversal in the original uptrend. When price breaks the lower trend line the price is expected to trend lower. Emerging patterns (before a breakout occurs) can be traded by swing traders between the convergence lines; however, most traders should wait for a completed pattern with a breakout.
Trend : Uptrend on Short- and Medium-Term basis and Neutral on Long-Term basis.
Momentum is Bullish (MACD Line is above MACD Signal Line and RSI is above 55).
Support and Resistance : Nearest Support Zone is $0.050 (previous resistance), then $0.035. The nearest Resistance Zone is $0.060, which it broke, then $0.080.

HEDERA HBAR price tries to change the trend to growthThe HBARUSDT price is trying to break through and gain a foothold above the strong mirror level of $0.58.
If buyers manage to do this, the next HBAR price target will likely be $0.75.
Then, a retest of $0.58. If the HEDERA token price doesn't drop lower, great.
You can buy HBAR in your investment portfolio with a clear conscience and wait for it to grow to at least $1.70
_____________________
Did you like our analysis? Leave a comment, like, and follow to get more

Two scenarios for this rangeDaily Chart
BINANCE:HBARUSDT has Break of Structure after reached to 0.099 then HBAR's downed to 0.04 (786 Fib Re)
So HBAR has two scenarios right now
#1 - Price break down ascending trend line acts the support and down to 0.4 again
#2 - Price goes up along ascending trend line and test the resistance at 0.065
I more likely #1 because BTC can down a little bit
Wait for a next move

HBAR/USDT Confirms its Bullish Move, Hedera Hashgraph Analysis Hello Paradisers, Time to get into action!!
💎 HBARUSDT is gearing up for a potential rise and anchored above the 21 EMA, signaling bullish vibes.
💎 Underpinning this optimistic view is the Demand Zone lying just below, which will definitely boost the bullish drive.
💎 Beyond this zone, we've spotted a bullish nod on a smaller timeframe, hinting that the price might circle back to this level.
💎 On the flip side, if the price drifts into the invalidation zone and slips through, we might witness a bearish turn.
💎 Stay connected for more updates and savor your trading journey with #MyCryptoParadise!

HBAR Grabbing Buyside Liquidity and finding its HTF Range Top TP Profits clearly laid out corresponding to Premium PD arrays. I don't believe its going to a big bull run. Reversal Level to look out for would be at TP2. If it does take liquidity level at 0.09 cents and consolidates for more than a week or moves strongly past, Hbar to the moon.
Likely ranging on the weekly.

HBAR/USDT Analysis: Massive 800% Gains Expected!HBAR/USDT Technical Analysis: Potential 800% Gains Expected in Next Bull Run
Introduction:
In this technical analysis, we will be examining the current state of HBAR/USDT, a popular cryptocurrency pair, and exploring potential entry points and price targets for long-term holders. Please note that this analysis is solely for informational purposes and not financial advice. Always conduct your own research before making any investment decisions.
Current Market Overview:
As of the latest data, CRYPTOCAP:HBAR is trading at $0.0519. The overall market trend for altcoins is not bullish at the moment, suggesting the possibility of further corrections in HBAR/USDT.
Entry Levels for Long-Term Holders:
For long-term holders, the green box represents the best entry zone. Consider initiating positions at the following levels:
Entry 1: $0.037
Entry 2: $0.028
It's important to be prepared to buy within this zone, as it may present an excellent opportunity for substantial profits.
Price Targets and Resistance Levels:
Once the entry points are hit, it's essential to plan potential exit strategies based on resistance levels. The following price targets are observed on the chart:
Resistance 1: $0.083
Resistance 2: $0.17
Resistance 3: $0.25
Expectations for Next Bull Run :
With the current analysis and the potential for a bullish trend, it is reasonable to anticipate a significant increase in value during the next bull run. An estimated 800% growth from the entry zone is projected.
Support Levels:
In case of any downturns, the following support levels can be considered:
Support 1: $0.037
Support 2: $0.028

HBAR and the potential opportunity Hi Everyone;
today we have one of the best risk to reward Investment opportunity
it is almost 400 time the risk and the chart is look very promising.
I expect breaking the previous bear market key point will clear the way to the final target.
good luck everyone.

Hbar Building For Breakout Finally Hbar Building Up For Massive Breakout Formed Falling Wedge In 3 days tf Incase Of Successful Breakout Expecting 250%+ bullish Rally

HBAR: sleeping giantMy favorite buy zone is the BUY ZONE #2 because it correlates with the trend line.
A drop below the trend line is expected followed by the creation of support and then who knows where is the moon.
Is this financial advice? Who knows...
