HBARUSD: Daily VCPVCP: 2W 24/3 3T
The posted chart contains a VCP (volatility contraction pattern). The first label "W" stands for weekly and shows the duration of the entire consolidation. In the middle label, the percentage of contractions is indicated (for example, "15/4"), with 15 representing the -15% depth of the base and 4 representing -4% of the last contraction. The last part "T" represents the number of contractions. The light blue lines in the chart correspond to the contractions. A more detailed description can be found in Mark Minervini's books.
RS stands for relative strength and measures the strength of the stock compared to the overall market. The value range is 1-99 with 99 being the highest value. The rank was generated by fyntrade.
HBARUSDT


Has not been able to cross this resistance yetHBAR had a range trend last week. Its price, which had hit the resistance of 0.070 to 0.073 dollars, has not been able to cross this resistance yet. Because the resistance of the roof of the main descending channel is also in this range. Therefore, the strong upward trend has been ranged by reducing demand and saving profits of some short-term buyers. Support in the $0.0583 range is evident on the chart, and the short-term trend is more likely to continue between these two levels.

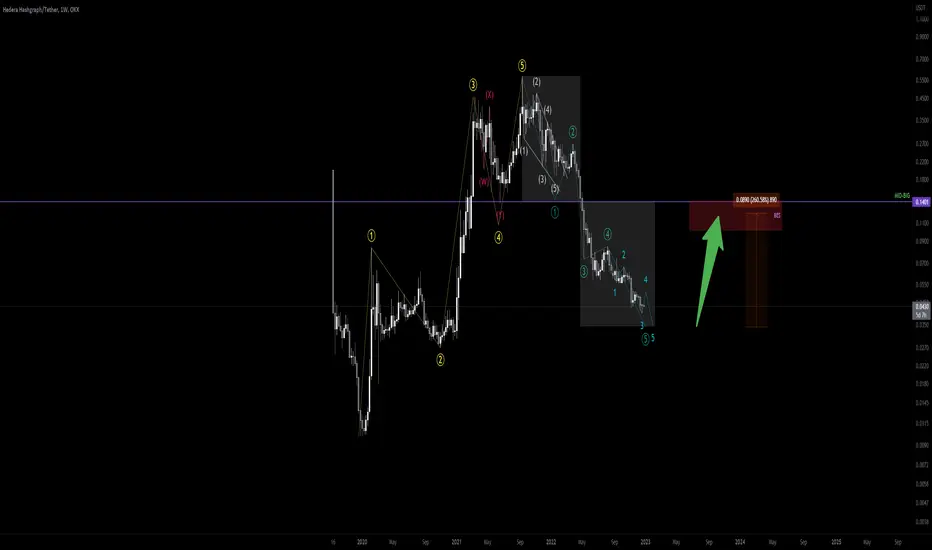
HBAR Signal Jan 2023: Layer1/Layer2/Layer0 Portfolio ReviewPosting this up to see where it is in the future. . .
I know its not technically an L1,L2,L0 but it does have its own ecosystem so.. yeah

$HBAR - where does this dip? What a beautiful chart. Can easily see red getting tagged.
Where do you think this dips to?

Bullish wave can resumeHBAR continued its upward trend last week, and a sharp break into the $0.070 - $0.073 resistance range has been seen. The daily candle has not yet closed above this level, and the breaks that have been recorded are fake. In the 4-hour timeframe, the price of HBAR is inside a narrow ascending channel, the ceiling of this channel was fake broken in the past days, and due to encountering a strong resistance, this reaction has caused the price to return to the channel. So, according to this reaction, there is a possibility that the price trend will be below this range for some time. But further, because the potential for a trend change has been created in the daily timeframe, and the bullish wave can resume by correcting to the support range of $0.0605 - $0.0550, we expect the current resistance to be broken for the next week.

HBAR/USD - Looking for an Entry if Support fails.Limited Support at current price- Anticipating Dip
Might be worth considering if support is lost and entry at the original break price becomes an option 0.0470USD
Preferred Entry 0.0375USD
If entering at current- Consider tight stop loss and target 20% (but personally it's a no for me)
As Always,
Just my thoughts and TA
Feedback welcomed.
Bingaz.

HBAR/ USDT Idea✅ ✅ Risk warning, disclaimer: the above is a personal market judgment and analysis based on published information and historical chart data on The trading view,
And only some of these analyzes are my actual real trades.
I hope Traders consider I am Not responsible for your trades and investment decision.

We expect to see the range trend of this HBARThe first support is at the price of $0.050, which was the first encounter with a positive reaction, and the second support is considered in the $0.044-0.046. With this strong reversal, we expect to see the range trend of this HBAR between the specified levels this week. After that, we can expect higher targets in the $0.070 range to be available to buyers after the upcoming resistance is broken.

HBAR | Will History Repeat itself?#HBAR Pretty Solid Downtrend Breakout ✅
Will History Repeat itself ?
Please like the idea for Support & Subscribe for More ideas like this and share your ideas and charts in Comments Section..!!
Thanks for Your Love & Support..!!

HBAR CAN FALL AGAINHi, dear traders. how are you ? Today we have a viewpoint to SELL/SHORT the HBAR symbol.
For risk management, please don't forget stop loss and capital management
When we reach the first target, save some profit and then change the stop to entry
Comment if you have any questions
Thank You

HBAR - Range & Continuation Hey, very nice setup (with simple invalidation) for HBAR... what do u think?

HBAR 3 White Soldiers + Bullish Divergence + Trend Line SupportTarget 50% retrace of recent top, Risk Reward 1:12, enter the trade after the double bottom is confirmed right after break of the $0.513.

$HBARUSDT UPDATE!!!Hi Snipers,
Please refer to the recording for the next price levels and scenarios.
Thanks
MS


HBARInteresting if this happens on Hbar. looks good. Accumulation manipulation expansion. THIS IS NOT A TIME ANALYSIS IT ALSO CAN GO LOWER. NFA

$HBAR is Currently Forming Falling Wedge Pattern at 1D Timeframe$HBAR
HBAR is currently forming Falling Wedge pattern and is trading at $0.05 region, price is expected to go up if there is strong rejection at current support. If the current support broken, it is expected for the price to revisit $0.04 region again. In that case, I think that is a good price to stock some $HBAR.

#HBAR/USDT Sideways Channel Trade setup: Trading in a Sideways Channel ($0.06-$0.08), with $0.06 support having recently received big buying volumes interest. (set a price alert).
Pattern: Price is trading in a Sideways Channel , which is a neutral pattern (indication of market indecision). Trend Traders ought to wait for a breakout in either direction, although typically it breaks in the direction of the existing trend. Swing Traders can trade the range – Buy near Support and Sell near Resistance.
Trend: Downtrend across all time horizons (Short- Medium- and Long-Term).
Momentum is Mixed as MACD Line is above MACD Signal Line (Bullish) but RSI ~ 50 (Neutral).
OBV (On Balance Volume): is rising, indicating that volume on Up days is greater than volume on Down days. Hence, demand (buyers) exceeds supply (sellers).
Support and Resistance: Nearest Support Zone is $0.060. The nearest Resistance Zone is $0.080, then $0.100.

HBAR/USDT - LONG 12H TF----- Welcome, dear followers! -----
- Here is my trading methodology. I trade with a normal system and analysis of resistance and support, as well as price reversal patterns.
- For the record, I do not place a stop loss within my trades. So that I only risk 1.5% of my total capital in order to support the loss due to a price reversal against me.
- If a price reversed against my expectation and touched the drawn line r3, then I transferred targets to the entry point and waited for the price to close at it with a loss equal to almost zero.
- Today's deal is shown in the chart, and here are the entry and exit points below.
-- Support me with numbers and follow up on my account for other deals in the future. Thank you for coming to this part.
---------------------------------------------------------
⚡️⚡️ #HBAR/USDT ⚡️⚡️
Client: My-Binance Futures
Trade Type: Breakout (Long)
Leverage: Cross (2X)
Entry Targets:
1) 0.06305 - 100.0%
Take-Profit Targets:
1) 0.06644 - 20.0%
2) 0.06882 - 20.0%
3) 0.07274 - 20.0%
4) 0.07898 - 20.0%
5) 0.08381 - 20.0%
Trailing Configuration:
Entry: Percentage (0.0%)
Take-Profit: Percentage (0.75%)
Stop: Breakeven -
Trigger: Target (1)


HBAR 3 day chart looks promising.HBAR 3 day candle must break out
BULLISH of this white circle to show
strength, which is also in between the
Red and Green lines and that indicates
the BULL MARKET SUPPORT BAND. HBAR
has been listed as an ISO-20020 token which
facilitates the creation of all new services and
enhanced straight-through processing.
mainstream worldwide adoption of these type
of tokens will be huge in the near future.
