HBARUSDT

HBAR Short Wait for Good EntryLike & Follow me for more details
HBAR Short,
BTC will break upward trend soon.
Will reach 103k

HBAR CONSOLIDATION - When Breakout?CRYPTOCAP:HBAR has been seen to range within the box on the 1hr timeframe chart since 10th May and it’s still within the box.
What do you expect - upward or downward breakout?
Please support this idea with a LIKE👍 if you find it useful🥳
Happy Trading💰🥳🤗

HBARUSDT: Critical Zone Alert! HBARUSDT: Critical Zone Alert! 🚨
Folks, the blue box on HBARUSDT is a key area —absolutely critical from multiple angles. This zone could deliver some strong reactions, but let me remind you, this is a 1-hour chart . Don’t go in expecting massive percentage moves; instead, focus on disciplined, calculated entries.
Why the Blue Box Matters:
High-Precision Level: Carefully chosen using advanced tools—CDV, liquidity heatmaps, volume profiles, and volume footprints.
High Probability Area: A spot where buyers have historically stepped in.
Smart Trading Opportunity: If conditions align, this could be a strong setup for tactical traders.
Pro Tip: Set your alarms for this zone—it’s worth your attention, but always manage your expectations and risks carefully.
Want to trade smarter? DM me to learn how I use CDV, liquidity heatmaps, volume profiles, and volume footprints to find these precise zones.
If you find this helpful, don’t forget to boost, comment, and follow! Let’s elevate your trading game together. 🌟
Let me tell you, folks, this is amazing. Nobody does analysis like I do. Believe me. If this helps you, don't forget to boost and comment! It’s a big deal, motivates me to share even more winning insights with you. Tremendous insights.
I keep my charts the best, clean, simple, and clear. You know it, I know it, clarity leads to better decisions. No question about it. My approach? Built on years of tremendous experience. Incredible track record. I don’t claim to know it all, but I spot high-probability setups like nobody else. Trust me.
Want to learn how to use the heatmap, cumulative volume delta, and volume footprint techniques I use to determine demand regions with stunning accuracy? Send me a private message—totally free, folks. That’s right. I help anyone who wants it, absolutely no charge. Unbelievable value.
Here’s the list, long list, great list, of some of my previous incredible analyses. Each one, a winner:
🎯 ZENUSDT.P: Patience & Profitability | %230 Reaction from the Sniper Entry
🐶 DOGEUSDT.P: Next Move
🎨 RENDERUSDT.P: Opportunity of the Month
💎 ETHUSDT.P: Where to Retrace
🟢 BNBUSDT.P: Potential Surge
📊 BTC Dominance: Reaction Zone
🌊 WAVESUSDT.P: Demand Zone Potential
🟣 UNIUSDT.P: Long-Term Trade
🔵 XRPUSDT.P: Entry Zones
🔗 LINKUSDT.P: Follow The River
📈 BTCUSDT.P: Two Key Demand Zones
🟩 POLUSDT: Bullish Momentum
🌟 PENDLEUSDT.P: Where Opportunity Meets Precision
🔥 BTCUSDT.P: Liquidation of Highly Leveraged Longs
🌊 SOLUSDT.P: SOL's Dip - Your Opportunity
🐸 1000PEPEUSDT.P: Prime Bounce Zone Unlocked
🚀 ETHUSDT.P: Set to Explode - Don't Miss This Game Changer
🤖 IQUSDT: Smart Plan
⚡️ PONDUSDT: A Trade Not Taken Is Better Than a Losing One
💼 STMXUSDT: 2 Buying Areas
🐢 TURBOUSDT: Buy Zones and Buyer Presence
🌍 ICPUSDT.P: Massive Upside Potential | Check the Trade Update For Seeing Results
🟠 IDEXUSDT: Spot Buy Area | %26 Profit if You Trade with MSB
📌 USUALUSDT: Buyers Are Active + %70 Profit in Total
🌟 FORTHUSDT: Sniper Entry +%26 Reaction
🐳 QKCUSDT: Sniper Entry +%57 Reaction
📊 BTC.D: Retest of Key Area Highly Likely
And that’s just the start. The list goes on and on, folks. It’s a tremendous list, the best. I stopped adding because, frankly, it’s tiring. So many wins. People are amazed. You can check my profile and see for yourself, winning moves, all the time. Believe me, nobody does it better.

$HBAR Double breakout!!CRYPTOCAP:HBAR has officially broken out of the descending channel and completed a clean inverse head-and-shoulders pattern—one of technical analysis's most reliable bullish reversal signals!
Chart Pattern: Inverse Head & Shoulders
Trend Reversal Confirmed
🔹 Left Shoulder ✅
🔹 Head ✅
🔹 Right Shoulder ✅
🔹 Breakout + Retest Zone Holding Strong!
This bullish confirmation, paired with a reclaim above the 200-day EMA, sets the stage for a potential massive upside move, with the target pointing toward $0.40+.
Don’t ignore technicals — trade with clarity, not emotions.

#HBAR/USDT#HBAR
The price is moving within a descending channel on the 1-hour frame, adhering well to it, and is heading for a strong breakout and retest.
We are seeing a bounce from the lower boundary of the descending channel, which is support at 0.1870.
We have a downtrend on the RSI indicator that is about to be broken and retested, supporting the upward trend.
We are looking for stability above the 100 Moving Average.
Entry price: 0.19000
First target: 0.1935
Second target: 0.1970
Third target: 0.2001

HBARUSDT – Bull Flag Breakout Confirmed!The recent price action on HBARUSDT is showing a classic bull flag breakout — a powerful continuation pattern often seen in strong uptrends.
Bull Flag Breakdown:
Flagpole:
Prior to consolidation, HBAR saw a massive rally of over 780%, forming a steep vertical move — this sets the stage as the flagpole.
Flag Formation:
Price entered a downward sloping channel with clear lower highs and lower lows. This consolidation formed the flag, which indicates temporary cooling before the next leg up.
Breakout & Retest:
HBAR broke out of the flag’s resistance, followed by a successful retest of the breakout zone and a bounce off the 0.5 Fibonacci level — all signs of strong technical confirmation.
With this breakout, HBAR is likely to follow through with a measured move, aiming for key targets:
TP1 (Futures): 0.24985
TP2 (Futures): 0.28904
TP1 (Spot): 0.57177
TP2 (Spot): 1.23275+
These targets align with historical resistance and projected flagpole extensions.
If you find this analysis helpful, please hit the like button to support my content! Share your thoughts in the comments, and feel free to request any specific chart analysis you’d like to see.
Happy Trading!!

Price Takes a Breath Before the Next RunBINANCE:HBARUSDT has been moving in a smooth uptrend, followed by a brief consolidation — forming a classic bullish pennant pattern. This indicates a temporary pause before a potential continuation toward the main target zone at 0.21182 – 0.21855.
A breakout above 0.19195 confirms the validity of the pennant pattern, especially after the price successfully held above the demand zone at 0.18907 – 0.18633. The next key level to watch is the prior high of the pennant (highlighted with a red arrow).
For a solid bullish continuation, ensure the breakout is clean — no fakeouts or re-entries back into the pennant. If a false breakout occurs, it's wise to either trim your position or set a break-even stop to protect your capital.
Note: Manage risk with proper stop loss just below the demand zone.

HBAR is one of the most important cryptos to own long term.Hedera's technology is leaps and bounds ahead of nearly every other crypto in the space, both in terms of current capabilities and future potential. If you own crypto, you'd be crazy, in my opinion, not to hold HBAR.
Good luck, and always use a stop-loss!

HBAR/USDT HEAD AND SHOULDER PATTERN [BULLISH]Chart pattern HBAR/USDT showing head and shoulder pattern which mean bullish pattern. currently now on going for retest.

#HBAR Current Setup Showing Warning Signs | What's Next?Yello Paradisers! Is #HBAR teasing one last move up before everything collapses? Let’s break down what this suspicious structure on #Hedera is telling us:
💎#HBAR is currently trading at $0.183, sitting just beneath a heavy resistance zone around $0.190–$0.200. Price has been unfolding inside a clear Ending Diagonal structure—one of the most deceptive patterns in technical analysis. Wave 5 is still technically in play, but momentum indicators and volume behavior are telling a different story.
💎Volume has been steadily declining even as the price has been climbing, which is never a good sign this deep into a wedge pattern. On top of that, the RSI is pushing into overbought territory, showing that buyers are pushing the market higher, but with weakening strength behind them.
💎The resistance zone above current price is absolutely key. If #HBARUSD manages to break above the red zone and sustain momentum above $0.200, this would invalidate the current bearish setup and could open the door for an impulsive extension toward $0.220 and even higher. However, that scenario currently remains the less likely one unless we see a clear and strong breakout above the zone backed by volume.
💎Until then, bears are in control of the probabilities. The market structure favors a reversal from the Ending Diagonal, and if that plays out, the move could unfold quickly. First, we’ll be watching how price reacts at $0.142, which is the first major support and likely target if the wedge breaks down. A confirmed close below that level would likely lead to a continuation of the drop, with the next strong support zone near $0.125. This area has acted as a solid demand level previously and is also the region where the Volume Profile starts to spike again.
Play it safe, respect the structure, and let the market come to you!
MyCryptoParadise
iFeel the success🌴

HBAR Analysis (April 17, 2025)HBAR Analysis (April 17, 2025)
Current Price:
As of April 17, 2025, Hedera Hashgraph (HBAR) is trading at approximately $0.1617, reflecting a 1.76% increase over the past 24 hours.
⸻
📊 Technical Analysis
Price Action & Patterns:
• HBAR recently tested a key support level at $0.12516 on April 7 and has since rebounded, indicating potential bullish momentum.
• The emergence of a bullish engulfing pattern on the weekly chart suggests a possible trend reversal after a correction period.
Indicators:
• Moving Averages: Price is currently moving within a falling trend channel, signaling caution for medium-term traders.
• MACD & RSI: Improving momentum is likely, but traders should monitor these indicators closely for confirmation.
⸻
🧭 Fundamental Analysis
Adoption & Ecosystem:
• HBAR continues to gain adoption in enterprise applications, thanks to its high throughput and low fees.
Institutional Interest:
• A recent Nasdaq filing for a Spot HBAR ETF could attract institutional investment and increase liquidity.
⸻
📈 2025 Price Forecast
• Short-Term (Apr–Jun): Expected to trade between $0.13829 – $0.2073, with an average of $0.149652.
• Mid–Long Term: Projections vary from $0.25 up to $0.78, depending on adoption and market sentiment.
⸻
✅ Summary
HBAR shows early signs of a bullish reversal supported by price action and growing institutional interest. However, caution is advised due to the ongoing medium-term downtrend. Key resistance and support levels should be monitored.

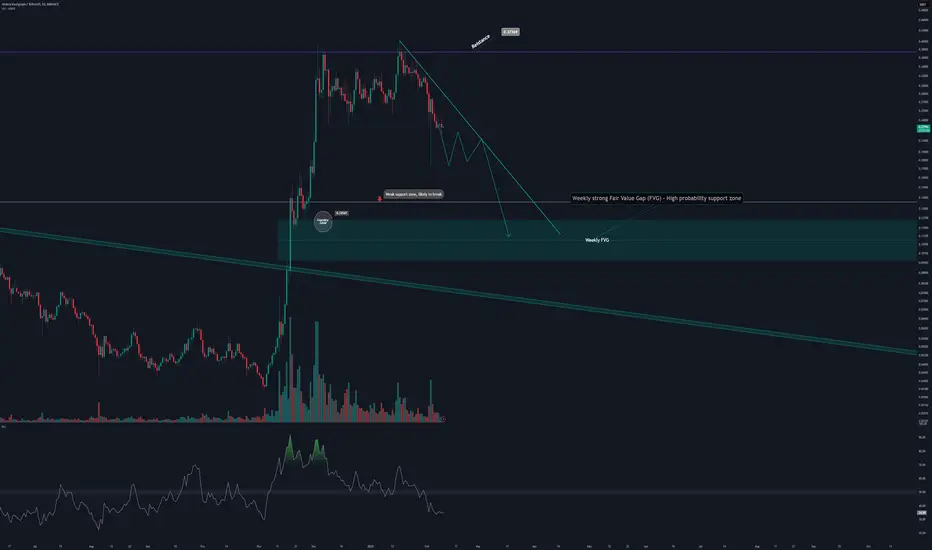
HBARUSDT Approaching Key Weekly Zone with Potential Reversal SetBINANCE:HBARUSDT HBARUSDT is approaching a weak support zone, which shows a higher probability of breaking due to insufficient strength. Below this lies a weekly strong Fair Value Gap (FVG), which is a critical level for potential price reversal and continuation of the bullish trend.
If the price enters this weekly FVG zone, it could signal a high-probability buying opportunity for traders anticipating a rebound. On the other hand, failure to hold this zone could lead to further downside.
Keep an eye on price action near the key levels for confirmation of potential entries. Always ensure to have clear stop-loss levels and realistic profit targets in place.
Best regards,
Happy trading!
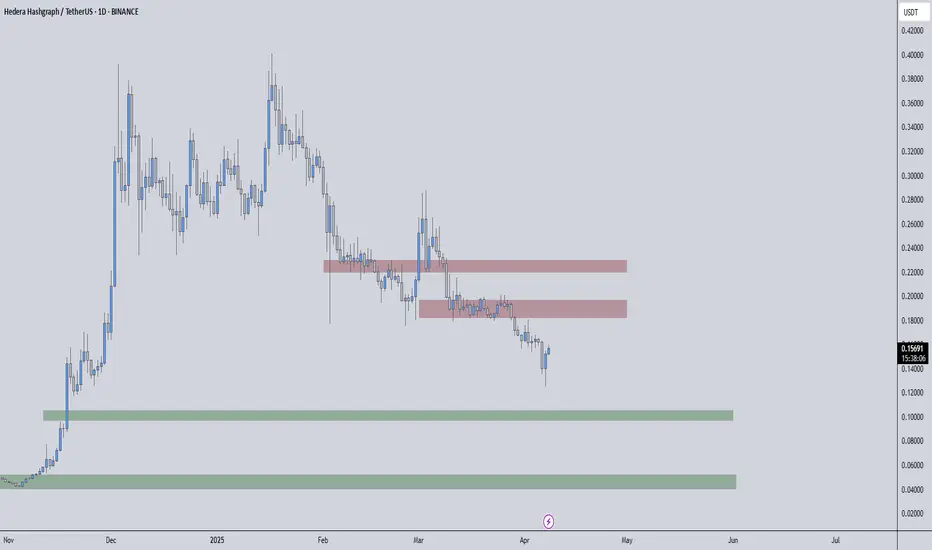
Strategic Key Zones – Trade with Confidence and PrecisionHBARUSDT is currently in a crucial setup where the red boxes represent solid resistance zones. These areas have historically proven to be significant barriers for upward moves, marking where selling pressure intensifies.
Key Market Observations
• Red Boxes as Resistance:
• These levels are where the market traditionally sees strong selling pressure, setting clear ceilings on price advances.
• Green Boxes as Support Indicators:
• The first green box tends to provide temporary support, offering a cushion in case of pullbacks.
• The second green box, however, holds the potential to be a game changer—if the price retests and holds here, it could signal a strong base for a bullish reversal.
Trading Approach
• Confirmation is Crucial:
• Always wait for lower time frame signals along with clear confirmation—through volume patterns and CDV indicators—before making any entries.
• This disciplined method ensures that you trade only when the market validates the setup.
• Risk Management is Key:
• Trade with precision and protect your capital by acting on confirmed signals rather than emotions.
• Adjust your positions based on whether the resistance holds or if a breakout occurs, and never overexpose your portfolio to any single move.
Why Follow This Analysis?
I operate with a level of expertise and professionalism that sets me apart in this market. Every level is carefully analyzed, and my high success rate is a direct result of these proven strategies. Most traders struggle because they act on guesses, but my approach is built on decades of refined experience and data-driven confirmation. If you’re serious about trading, you need to follow insights that work—insights that have been time-tested and consistently deliver results.
Trust the process, stay disciplined, and always trade with precision. Follow these updates closely and trade smartly to ensure that you stay ahead of the market trends.
📌I keep my charts clean and simple because I believe clarity leads to better decisions.
📌My approach is built on years of experience and a solid track record. I don’t claim to know it all but I’m confident in my ability to spot high-probability setups.
📌If you would like to learn how to use the heatmap, cumulative volume delta and volume footprint techniques that I use below to determine very accurate demand regions, you can send me a private message. I help anyone who wants it completely free of charge.
🔑I have a long list of my proven technique below:
🎯 ZENUSDT.P: Patience & Profitability | %230 Reaction from the Sniper Entry
🐶 DOGEUSDT.P: Next Move
🎨 RENDERUSDT.P: Opportunity of the Month
💎 ETHUSDT.P: Where to Retrace
🟢 BNBUSDT.P: Potential Surge
📊 BTC Dominance: Reaction Zone
🌊 WAVESUSDT.P: Demand Zone Potential
🟣 UNIUSDT.P: Long-Term Trade
🔵 XRPUSDT.P: Entry Zones
🔗 LINKUSDT.P: Follow The River
📈 BTCUSDT.P: Two Key Demand Zones
🟩 POLUSDT: Bullish Momentum
🌟 PENDLEUSDT.P: Where Opportunity Meets Precision
🔥 BTCUSDT.P: Liquidation of Highly Leveraged Longs
🌊 SOLUSDT.P: SOL's Dip - Your Opportunity
🐸 1000PEPEUSDT.P: Prime Bounce Zone Unlocked
🚀 ETHUSDT.P: Set to Explode - Don't Miss This Game Changer
🤖 IQUSDT: Smart Plan
⚡️ PONDUSDT: A Trade Not Taken Is Better Than a Losing One
💼 STMXUSDT: 2 Buying Areas
🐢 TURBOUSDT: Buy Zones and Buyer Presence
🌍 ICPUSDT.P: Massive Upside Potential | Check the Trade Update For Seeing Results
🟠 IDEXUSDT: Spot Buy Area | %26 Profit if You Trade with MSB
📌 USUALUSDT: Buyers Are Active + %70 Profit in Total
🌟 FORTHUSDT: Sniper Entry +%26 Reaction
🐳 QKCUSDT: Sniper Entry +%57 Reaction
📊 BTC.D: Retest of Key Area Highly Likely
📊 XNOUSDT %80 Reaction with a Simple Blue Box!
📊 BELUSDT Amazing %120 Reaction!
I stopped adding to the list because it's kinda tiring to add 5-10 charts in every move but you can check my profile and see that it goes on..
HBAR Analysis (12H)After the bearish CH, supply zones have formed on the chart.
Currently, the price is consuming an OB. Each time this OB has been consumed, lower highs have been formed. Additionally, the number of touches on this OB has been high, meaning many orders from this OB have been absorbed.
It is expected that the price will eventually reach the lower demand zone and then react strongly to the upside.
The closure of a daily candle below the invalidation level will invalidate this analysis.
For risk management, please don't forget stop loss and capital management
When we reach the first target, save some profit and then change the stop to entry
Comment if you have any questions
Thank You

Hedera Hashgraph: 23% Drop to Monthly Support, Target 0.15Hello and greetings to all the crypto enthusiasts, ✌
All previous targets were nailed ✅! Now, let’s dive into a full analysis of the upcoming price potential for Hedera Hashgraph 🔍📈.
Hedera Hashgraph is forming a new parallel channel, with an expected decline of at least 23%, bringing the price to the monthly support level. A retest of this support is likely, providing a potential entry point. My price target is set at 0.15 following this phase.📚🙌
🧨 Our team's main opinion is: 🧨
Hedera Hashgraph is set to drop 23%, reaching monthly support, with a potential retest and a target of 0.15.📚🎇
Give me some energy !!
✨We invest hours crafting valuable ideas, and your support means everything—feel free to ask questions in the comments! 😊💬
Cheers, Mad Whale. 🐋

HBARUSDT 4DHBAR ~ 4D Analysis
#HBAR The next goal is very clear, this will re -test this support. buy gradually from here with a short -term target of at least 15%+

HBAR Bulls Nowhere in Sight – Where’s the Bottom?HBAR had an incredible bull run from November 2024 to mid-January 2025, rallying for 74 days and gaining +865%, moving from $0.0416 to a high of $0.40139. However, since then, the market has reversed, entering a 73 day downtrend and dropping -58% from its peak.
Now, the big question is: where is HBAR heading next? Let’s break down the key resistance and support levels and map out potential high-probability trade setups.
Current Market Structure – Bears in Control
HBAR is trading at $0.16765, just below a key low at $0.17721, which it must reclaim to show any bullish strength. Several critical resistance levels lie ahead:
🔴 $0.18 - $0.20 Zone: Previously strong support, now acting as resistance
🔴 Weekly Level at $0.18375 – A significant resistance zone
🔴 Monthly Open at $0.21352 – Bulls must reclaim this to regain momentum
🔴 Weekly 21 EMA at $0.20 & 21 SMA at $0.2348 – Price is trading below both, a bearish sign
🔴 200 EMA/SMA Lost – Another bearish indicator
🔴 0.618 Fibonacci Retracement at $0.17904 – This level was lost, further confirming the bearish trend
📉 Conclusion: As long as price remains under $0.18-$0.20, the trend remains bearish, and there is no sign of reversal yet.
Where Could HBAR Go Next? Finding the Next Support Levels
If HBAR fails to reclaim the key resistance levels, price could continue dropping toward the next major support zone. Here’s where the next support zone is:
🟢 0.786 Fibonacci Retracement at $0.1186 – A key potential target
🟢 Weekly Support at $0.1259 – Close to the 0.786 Fib level, adding confluence
🟢 Monthly Support at $0.1145 – Further strengthening this zone
🟢 Log Scale 0.5 Fib Retracement at $0.12923 – From the full bull run, adding another layer of support
🟢 21 Monthly EMA at $0.132 & 21 Monthly SMA at $0.1079 – These levels align perfectly with the other supports
🟢 Fib Channel Lower Support (April 4th - 9th) – If price drops to $0.12 during this time window, it aligns with the lower channel support line
📉 Conclusion: A strong support zone lies between $0.132 - $0.1079, where buyers could step in for a potential bounce.
Potential Trade Setups
📌 Long Setup (High Probability Reversal Zone)
Entry: DCA around $0.12
Stop Loss: Below $0.098
Target: $0.166
Potential Gain: +40%
R:R Ratio: 2:1 or better
🔹 If price regains $0.18-$0.20, we can look for long opportunities.
📌 Short Setup (For Those Already Shorting from Higher Levels)
Take Profit Target: Between $0.14 - $0.12
Stop Loss: Above $0.20
Market Outlook
With HBAR currently in a bearish trend, we have clearly defined key support and resistance zones and potential trade setups. The next few weeks will be crucial, as price either reclaims $0.18-$0.20 (bullish case) or drops further toward $0.12 (where a strong bounce could happen).
📢 Patience is key! Let the setup come to you and don’t force trades. Always manage risk properly.
What are your thoughts on HBAR’s next move? Leave a comment below! 🚀

HBARHBAR
March 26, 2025
7:35 AM
From a tech perspective, looks like we’re heading into the final leg ( W5 ) targeting around $0.7795, if we’re measuring it through W3 + W4. Also spotting some bullish divergence showing up on the HTF, which adds to the bias.
A couple of solid confluences here too: on the D1 TF, HBAR just bounced off the 200 MA, which is a pretty key support, and it’s also sitting right inside a daily OB. Looks like buyers are stepping in.
Q: So is it good for buying on spot?
Yeah, HBAR is a solid crypto project. I actually shared my thesis on it — you can check it out on my channel, just scroll up a bit.
Q: Is it good to long on futures?
That really depends on your style. If you're a swing trader, then maybe — but personally, I don't think HBAR is ideal for swing longs or even day trades right now. The price action on LTF is pretty choppy, and it’s not the kind of setup that suits everyone. We all have different risk tolerance levels, so make sure it aligns with yours.

HBAR next impulse down The overall chart leans bearish with no signs of a reversal yet.
Momentum analysis indicates that HBAR is likely to continue its downtrend.
TP 0.11584
SL 0.19912

HBARUSDT Bull FlagHBARUSDT is currently forming a promising bull flag pattern on the daily chart.
Bullish Scenario:
If you're not in the trade yet, you can consider entering now for a potential long-term position, or wait for a confirmed breakout followed by a retest for added confirmation.
Bearish Scenario:
If the price breaks down from the bull flag, the next major support lies around the 800 SMA on the 8H, 12H, and daily timeframes.
!!! REMINDER !!!
Always pay attention to the signals when you're in a profitable trade. Secure your gains and consider re-entering on the next pullback.
Be Patient - Don't Panic - Trade Emotionless

HBAR ANALYSIS📊 #HBAR Analysis
✅There is a formation of Descending triangle pattern on weekly chart. Also #HBAR is trading around its low level. If the price sustains here and give a bullish move then we could expect a bullish move otherwise we would see more dip.
👀Current Price: $0.18230
⚡️What to do ?
👀Keep an eye on #HBAR price action and volume. We can trade according to the chart and make some profits⚡️⚡️
#HBAR #Cryptocurrency #TechnicalAnalysis #DYOR

Hedera - The Sleeping Giant is ready to break outHedera Hashgraph (HBAR) is one of the most fundamentally strong and technically advanced blockchain networks in the market today. With its unique consensus mechanism, strong enterprise partnerships, and increasing adoption, Hedera is positioning itself as a leader in the decentralized economy. As the broader crypto market regains momentum, HBAR presents a compelling opportunity for a long position.
Unmatched Transaction Speed and EfficiencyUnlike traditional blockchains, Hedera uses a Directed Acyclic Graph (DAG) structure, enabling lightning-fast transactions with finality in seconds and minimal fees—far outperforming most Layer 1 blockchains.
Enterprise-Grade AdoptionHedera is backed by the Hedera Governing Council, which includes industry giants like Google, IBM, Boeing, and LG. These partnerships ensure stability, real-world use cases, and continuous ecosystem development.
Sustainable and Green BlockchainWith its energy-efficient consensus mechanism, Hedera is one of the most environmentally friendly blockchain networks, aligning perfectly with global sustainability goals and attracting ESG-conscious investors.
Growing DeFi and NFT EcosystemThe Hedera ecosystem is rapidly expanding, with an increasing number of DeFi projects, NFT platforms, and tokenized assets utilizing the network’s speed and efficiency.
