The most BULLISH Chart in CRYPTO!This is just my thoughts on the most bullish chart in crypto. HBAR will probably be listed on coinbase and many other major exchanges once they complete their Rosetta Integration. The token has been asleep for now and anything under .04 is a great long term accumulation in my opinion. The targets posted in the chart are conservative and only represent the first impulse, HBAR can and will go much higher and I personally believe HBAR will a top 10 coin by the end of 2021. The token is unlike any other in the industry.
The targets listed top out at 45 cents USD per HBAR with BTC @ $30k
Looking at the broader crypto market, at the end of the cycle, I believe BTC will be down to 15% market dominance and top out around $80k USD (1.4T marketcap). Given those figures, I project the crypto market as a whole to be between 9 and 10 trillion USD. I believe ETH will hit 20k per coin and also top 2.4T market cap. When you remove the ETH and BTC marketcap from the total market cap, there's about 5T left over of marketcap spread among the rest of the coins. When you compare the remaining 8 coins in the top 10 to the rest of the market historically you'll notice that those coins consume about 81% of the remaining market cap. If I'm correct and there's roughly 5T of marketcap left over when you remove BTC and ETH, the remaining 8 coins should account for about $4T (80% of $5T). Even on the low end of the top 10, HBAR could have a marketcap well north of 300 billion USD. Given the amount of tokens that will be in circulation by then (roughly 9 billion), that would create a token price of HBAR north of $30 USD. From these prices, that would represent an 877 times return on your investment.
I realize this is sheer conjecture but, it IS in the realm of possibility. HBAR has the best partnerships in the community, better technology then any other crypto and the THE ONLY A-byzantine fault tolerant crypto on the market. There is a tremendous amount of development being done on HBAR too. Hedara currently ranks #2 for enterprise crypto projects by Blocknomy blocknomy.net and also rank as the 6th best project overall! Enterprise solutions are where the major adoption will take place, BTC is a store of value and ETH has scaling issues (both have flaws) HBAR seems to solve all of those issues and more.
Obviously this is only MY thoughts on the market and NOT financial advice, please do your own research.
Please take a moment and let me know your thoughts on the crypto market and where you see things going at the end of this cycle. How high do you think HBAR will get?
HBARUSDT

HBAR_Daily Great Fundamentals!Price: 0.03 USDT
Entry Level: 0.03 USDT
TP_LVL I: 0.048 USDT
TP_LVL II: 0.06 USDT
TP_LVL II: 0.08 USDT
SL: 0.02 USDT
Expected Return: 26% - 62%
Reward/Risk: 2.68

HBAR / BTC - 4H Beautiful Triple Bottom FormingBeautiful bottom forming on HBAR / BTC pair right now. These things don't always play out as planned, but a triple bottom is a really strong pattern if confirmed w/ a break above 163 sats. The bottom forming here could also be called an Adam and Eve pattern, which is interesting because the USD chart is printing an Eve and Adam pattern (both bullish).
For the sake of publishing this - I drew a couple of very short term targets if this occurs, but I think it has room to go much higher. I feel like we'll revisit 497-517 sats, and potentially revisit previous highs around 7-800s or exceed it. Bitcoin can ruin everything as usual, so keep an eye on it, and keep an eye on BTC dominance.
The weekly candlestick chart shows a double bottom forming - the last two weekly candles on the chart.
The USD pair looks incredible as well:
Full disclosure - I've been wrong more times than correct in attempting to chart HBAR; where my other charts have had a lot more success. That said, HBAR is my longest term bet because I personally believe in the project / team. Any movement down has been accumulation for me, so I'm happy either way it goes.


Hedera Hashgraph vs TetherUS Goes BullishHere we have a clear ascending channel taking place for HBARUSDT... Strong indicators and increasing volume support this move.
The black line on the chart stands for MA200, a very important level when are charting cryptocurrency.
Notice that today HBARUSDT is moving above this level while also showing the highest volume since August 2020.
What these signals are telling us is that the HBARUSDT price can continue to grow.
There will be red candles in between the growth, but the bottom line is that we get higher highs and higher lows.
Additional details on the chart.
Namaste.

HBAR / USD - Reversal after long DowntrendAn uptrend is forming within the channel shown on the chart. If we can get above the red box (resistance), we may test the top of the channel again soon.
If we break above the channel, we could revisit 0.55-0.6 cents, or higher.
BTC pair also looks good for a reversal.

HBAR / USD - Weekly Chart potentially forming HSiHBAR / BTC pair has been in a downtrend for a good while now without any significant corrections. It feels due for a correction soon. The USD pair here shows potential for an inverse head and shoulders pattern forming, and we could be at or near the bottom of the right shoulder. Volume is starting to rise as well. If it plays out as suggested on the chart idea above, it should complete this pattern around mid to late December.
Keep an eye on this, but beware goings-on of BTC
- also be mindful that HBAR has a much lower USD bottom prior to the google news, and hasn't yet re-visited previous BTC pair bottom either (if it will get there, we're hovering around 185-190 sats, previous bottom was 114 sats).

HBAR / USD - HBAR may continue upwardsHBAR USD pair has formed an inverted head and shoulders, we are right at the neckline, let's see if it breaks up


HBAR/USDT- Potential entry on Supported TestHBAR- Another one to keep an eye on.
I like the way HBAR is setting up at present.
Quick break then dip back to expected support- now waiting to see what the PA is going to do.
HBAR has some interesting partnerships and some sound potential on the horizon.
-Caution advised as ALTS are volatile as BTC lumbers it's way North.
-Stop Losses in place as a rug pull may be just around the corner.
As always not financial advice.
Just my thoughts and TA.
Bingaz.

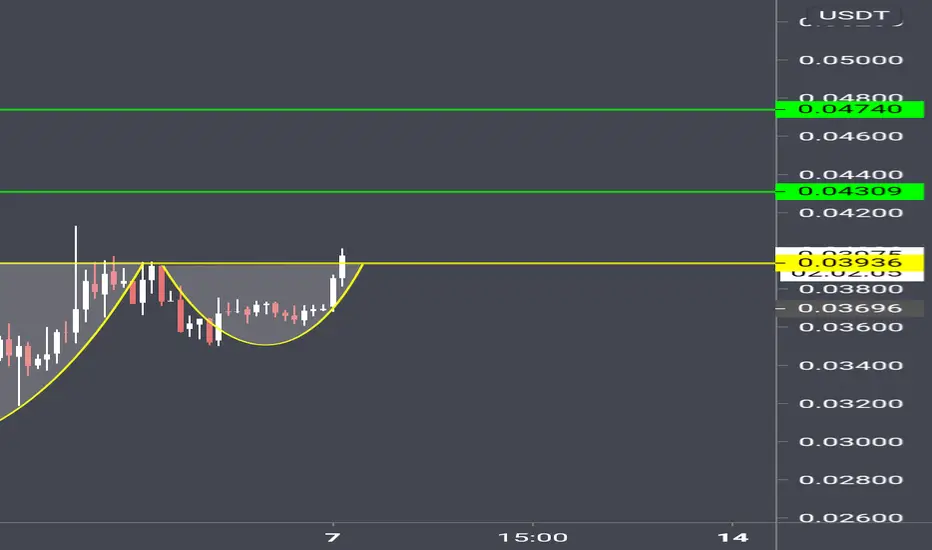
✳️Hedera Hashgraph/USDT (2/11) #HBAR $HBAR #HBARUSDTHBAR is at its lowest price since March, at 0.029-0.03$, so we should continue to believe in this zone, because if HBAR can rise from here, it will be pushed up very strongly with Double Bottom pattern. And the highest achievable target is at 0.0475$.
However, if the 1D candle closes below this support, HBAR will quickly fall back to the 0.02$ zone
📈BUY- LONG Strategy
- Buy: 0.029-0.03$. Stoploss if B
- Buy close to 0.034-0.035$ for more if A. Stoploss if B
📉SELL-SHORT Strategy
- Sell: 0.034-0.035$. Stoploss if A
- Sell: 0.038-0.039$. Stoploss if A
- Sell: 0.047-0.048$. Stoploss if A
♻️BACK-UP Plan
- Sell close to 0.029-0.03$ if B. Stoploss if A
- Buy: 0.018-0.02$. Stoploss if B
❓Details:
Condition A : "If 1D candle closes ABOVE this zone"
Condition B : "If 1D candle closes BELOW this zone"

HBAR/BTC 91% Potential from here with Tight Stop Loss#HBAR/BTC TA Update:-
#HBAR currently trading at 198 Satoshi
And low was 187 Satoshi.
And Very good strong support here.
So I am buying #HBAR also.
Entry:- 190-200 Satoshi
Targets:- 243/295/350 Satoshi
Stop loss:- 285 Satoshi
Please click LIKE button and Appreciate my hard work.
Must follow me for Latest crypto retime updates.
Thank you.

HBAR/BTC (Next Support at 200s Sat?)💎Technical Analysis Summary💎
BINANCE: HBARBTC
-HBAR is still on a strong downtrend after breaking its support
-If you are looking for a potential buying area or support
-The range between 212-190s sat might hold some potential
-Though this zone is only a minor consolidation
-But it was the start of a strong pump last Feb 12, 2020
-Wait for any bullish reaction before entering your trade
A big Thanks for donating 💰 via Tradingview coins this week to CITIZENCAINE 🙏🎉
``````````````````````````````````````````````
Trading Involves High Risk ⚠️
Not Financial Advice 💸
Please Exercise Risk Management 💱
``````````````````````````````````````````````
Thank You All!🙏😊💖For Supporting My Channel 📺
Through Leaving A Thumbs Up, Comment & Follow 💬
Happy Trading!😊💕💖
``````````````````````````````````````````````

HBARUSDT AnalysisEngineeringRobo and I are currently bullish about HBAR.
If you are holding HBAR at the moment, you should likely continue to hold. If the candles continue down, sell is advisable if the candles break down below the 0.02 support level.
If you are interested in buying HBAR your options are:
- Buy with EngineeringRobo buy signals
- Buy at the 0.029 support level.
- You can also buy at the downtrend line.
If buying with EngineeringRobo buy signals, pay close attention to EngineeringRobo sell signals.
If you are interested in using EngineeringRobo, DM me!

HBAR/BTC (Trading Downtrend)💎Technical Analysis Summary💎
BINANCE: HBARBTC
-Hedera Hashgrap is perfectly trading on a downtrend channel
-If the Bears can keep the price going down
-The chances of testing the key area of support at 248 sat is high
-Please do not try to catch the bottom
-Wait for proper confirmation or reversal patterns
-Let the price come to you and patiently wait for the correct entry
``````````````````````````````````````````````
Trading Involves High Risk
Not Financial Advice
Please Exercise Risk Management
``````````````````````````````````````````````
If You Like My Daily Published Ideas
A little Help By Supporting My Channel
Through Leaving A Thumbs Up, Comment & Follow
Happy Trading! --> Thank You! :)
``````````````````````````````````````````````

HBAR / USD - Two Possible ScenariosBearish - a break below the wedge may head further down, and if we break below the horizontal line, we've confirmed a double-top and may revisit all time lows.
Bullish - if we stay within the wedge, above the area being tested now, a return to all-time highs or higher is possible
Side note - a triple top is another bearish scenario that could possibly play out if all-time high is reached again and strongly rejected.
The USD pair for HBAR has been easier to chart than the BTC pair, which is not typical for altcoins, outside of the top 5-10.


HBAR / USD - Bullish Scenario with TargetsProvided a bullish scenario plays out, I think it moves up from here and targets listed on the chart TP1, 2, 3.

HBARUSDT AnalysisAs of now, since there are 3 BUY signals present, I'm BULLISH.
If you are holding HBAR, do not hurry to sell. There are 3 buy signals present, and yet, no sell signals.
If you want, you can take profit at the resistance level (0.069) or wait for EngineeringRobo's sell signals to sell.
Also, if you want to buy HBAR, the risk-reward ratio is higher than 1, and 3 buy signals present. So, if you want, you can buy right now but please watch out for EngineeringRobo's sell signals afterwards.

