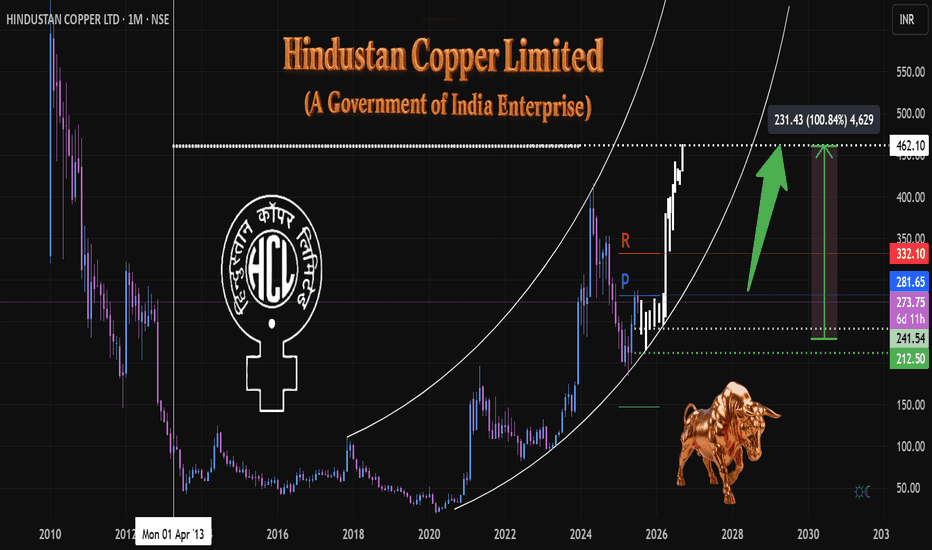
HCL Copper 1M, TF Anticipating Growth & Key Levels ⚙️ Materials: Commodity Cycle Turnaround
(Green energy metals, China recovery)
Government of India Enterprise
Hindustan Copper Limited (HCL)
The company is undergoing a significant mine expansion, projecting a 5x increase in output. This positive development is already reflected in institutional interest, with DIIs increasing their exposure by 8.2% in Q1.
At the time of this analysis, the price stood at 273.
We've observed a volume climax at the bottom, suggesting a potential exhaustion of selling pressure and a base formation.
The white ghost candles pattern illustrate an anticipated future price path, which I project based on current market dynamics and patterns. This projection outlines a potential trajectory we will monitor closely as price develops.
A strong engulfing bullish candle formation above the 281 pivot (🔵) would signal significant bull strength and confirm a strong upward momentum.
A confirmed breakout above the monthly resistance level (🔴) would be a critical bullish signal. initiating further long positions upon a successful retest of this breakout level.
My primary accumulation zone for potential entries is identified in green (🟢 dotted), ranging between 241 and 212. This range represents an area where I anticipate favorable risk-reward for entry.
Target & Time Horizon:
While precise timing is always challenging, I estimate the projected target up to 100% ( above in the white dotted line) could be reached around Q2 2026 or before as markets perform.
Disclaimer:
This analysis represents a personal projection
based on current market observations.
Trade Safely,
Always DYOR
#हिन्दुस्तान कॉपर लिमिटेड
#indianeconomygrowth
HCL
HCL Tech Bullish V-shape head & Shoulder Pattern!If Giant IT company HCL tech come to retest its strong support near 1600 it would be best buying opportunity, I don't know it will come or not but the trade initiation 1600-1653 between 20 and 50 moving averages could become good opportunity to go long for short to medium term.
Buying Below -1653
Stop loss -1605
First target -1741
Second Target -1818
Risk Reward -1:3
levels to watch There are no exceptions and HCL is also part of the game. As corrections were expected, and the stock has the potential to create substantial wealth in the long run if approached with proper timing. Rather than focusing on short-term speculation, investors should shift their focus towards wealth creation by strategically building a well-rounded portfolio.
The levels mentioned here represent optimal entry points for gradually accumulating HCL shares, with the expectation that the markets will rally past previous highs in the coming months.
This approach hinges on the belief that, with patience and a long-term outlook, investors can benefit from the stock's potential upside as market conditions improve and HCL's performance strengthens.
HCL is heading to 1000 againHCL is maintaining support of 784
Its resistance is 917 and after breaking
it could move to 1050, 1214 and 1450
levels.
Note: This is not a buy/sell call
use stop loss.
HCL Breakout, go longHello guys , the market seems to have made a bottom so now lets go for longs, do your own analysis also.
HCL made a H&S pattern
Broke counter trend-line
Gave a symmetrical triangle breakout
IT sector is strong
Wipro already running like black horse
Buy near 1200
Targets mentioned in the chart.
RSI looks bullish
MACD is above signal line
HCL TECH near to rectangle breakout - Very Bullish - Level#HCLTECH is moving under rectangle box and near to upper breakout. Today stock gain Volume more then 20VMA. Stock is moving above 200SMA and 200EMA both.
Showing Bullish in all indicator:
Increase in Relative strength - Benchmark Index
CCI above +100
RSI is trending UP
MFI is trending UP
ROC is trending UP
Stoch in overbought
MACD crossed above signal line
Aggresive New Long
Making Higher High since 3 day
----------------------------------------------------------
Support : 570 and 546
Breakdown : 580
CMP : 592
Breakout : 600
Short Target : 614 and 623
----------------------------------------------------------
(Disclaimer: This is only for educational purpose.)


