HDFC
HDFC - Hourly Chart HDFC - Hourly Chart - Completed the Inverted H&S Pattern on Hourly Charts. Breakout of Neckline today. Expecting price to move upwards now.
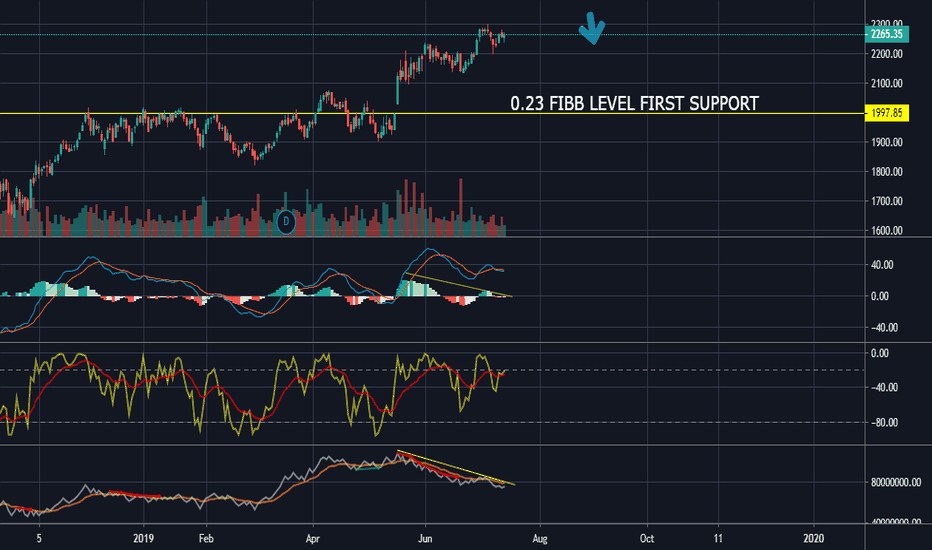
HDFC bearishHDFC is lossing momentum and I see a gap which probably will get filled soon. Also the smart money is getting out as we can see it from OBV. So look for a bearish candlestick attern to take short entry. First target will be 0.2 fibb support level.
HDFC Bullish Flag and Consolidation of PriceHDFC is about to break out to new ATH reasons:
MACD is getting flatter and flatter meaning low volatility
ATR is getting very Lower again indicating low volatility
Bull Flag in 1H range
HDFC Intraday BiasShort term trend of HDFC is bullish, The top line of the parallel channel will act as an immediate support, if the price breaks it, then it can retrace to 1950 levels otherwise the first target will be at 2000 and second at 2010. SL should be below the upper channel level
HDFC Long termLong term trend of HDFC is getting steeper. Wait for it to retrace to the long term trend line before adding more to it.
HDFC Long term Bullish trendTrend is getting steeper, the violet trendline represents the previous slope of the trend which is the long term trend, the orange trend line shows the current slope which is much steeper.
HDFCHDFC Trades using Blue Sky Plus Indicator.No need to spend time in doing analysis. Just plain follow the indicator. Message or Comment to get a free trial of the indicator.
HDFCYesterday's Performance check here - t.me
====================================
Longed above 1956 targets were 1965/75/83. with SL 1932
All target achived. 2000 possible NSE:HDFC
HDFC - SHORT SELL IN SHORT TERM - TARGET OF 1645FOLLOWING ARE THE OBSERVATIONS IN HDFC.
1. THE DOWNMOVE FROM 2050 SEEMS TO BE AN IMPULSE WHICH SHOULD BE WAVE A.
2. IF THAT IS THE CASE, WAVE B SHOULD NOT RETRACE MORE THAN 61.8% OF WAVE A, WHICH GIVES THE MAXIMUM PRICE TO BE 1900
3. THE C WAVE IN ABC UPMOVE IN A SMALLER TIMEFRAME, WHICH IS A PART OF THE BIGGER B WAVE SEEMS TO BE MAKING AN ENDING DIAGONAL, WHICH RESTRICTS THE 5TH WAVE OF THIS C WAVE TO A MAXIMUM OF 1897
CONCLUSION
HDFC CAN BE SOLD WITH A STOPLOSS OF 1900 FOR A TARGET OF 1645. A RR OF 1:18, :-)


