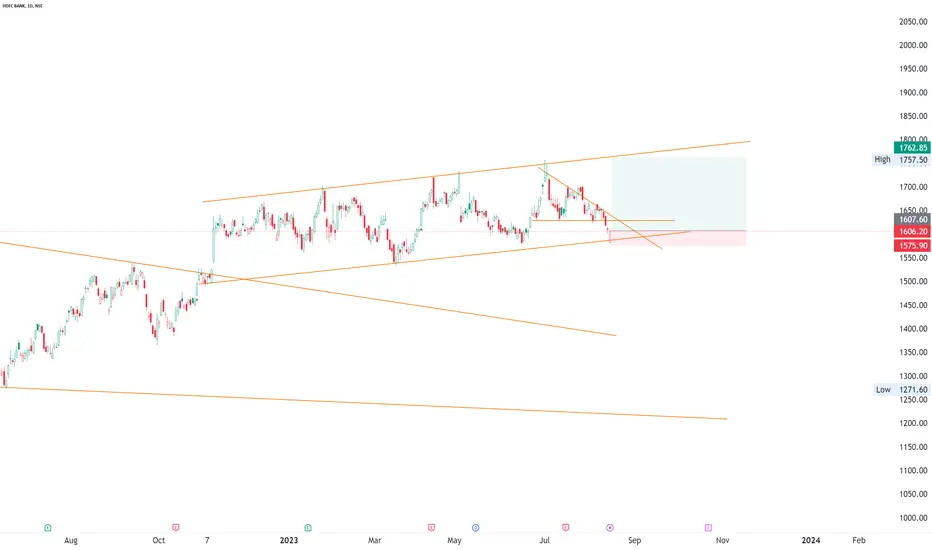
HDFC BANK SELLHi, According to my analysis of HDFC Bank stock, there is a high probability of a downturn. The price bounced from a very strong area, which is the resistance at 1720. Two very negative candles were formed, as shown in the analysis. We also notice that the stock is trying to break the flat pattern. Finally, good luck to everyone .Note: If you like this analysis, please give your opinion on it. in the comments. I will be happy to share ideas. Like and click to get free content. Thank you
HDFCBANK

HDFC Bank - Elliott wave countHDFC bank Elliott Wave Count
HDFC Bank - The market appears to be ready for the next impulsive wave. 1484 level to be safe for the bullish view, if that breaks below then the view is considered invalid.
Please exercise caution when trading as this information is for educational purposes only.
NSE:HDFCBANK NSE:HDFCBANK1! BSE:HDBK1!

HDFC Weekly AnalysisSharing HDFC Bank Chart Which Multiple Level With Feb , channel Ichum Cloud .
.
.
.
.
.
.
Please share your thought

#OMAXE 48.80 Buy TGT 61 23% upside recommended - Rachit Sethia OMAXE 48.80
TGT 61
SL 42
RR ~2
Return > 23%
TF < 6M
NSE:OMAXE
Factors: BULLISH WEDGE BREAKOUT Trend Following Rising Volume with rising Prices. Flag pattern breakout. Pennant Pattern Breakout with Bullish Candle. Retest Successful. Higher Highs & Higher Lows. Broken above RESISTANCE levels Trading at SUPPORT levels Earnings are strong. Bullish Wedge Breakout Risk Return Ratio is healthy. And Rising from Double Bottom Pattern to Flag Pattern forming. If you like my work KINDLY LIKE SHARE & FOLLOW this page for free Stock Recommendations. With 💚 from Rachit Sethia

HDFCBANKNSE:HDFCBANK
One Can Enter Now !
Or Wait for Retest of the Trendline (BO) !
Or wait For better R:R ratio !
Note :
1.One Can Go long with a Strict SL below the Trendline or Swing Low.
2. R:R ratio should be 1 :2 minimum
3. Plan as per your RISK appetite and Money Management.
Disclaimer : You are responsible for your Profits and loss, Shared for Educational purpose

HDFCBANK--End Of Bearishness ??The stock is Near its demand zone,, it indicates that there is potential buying interest at that price level, and it could be a strategic point to consider for investing or trade.
find long opportunity in this area....

Buy HDFCBANK 1565 TGT 2200/2650 sl Below 1230Hdfcbank has given a meaning full correction on intraday basis and is taking the support on major levels, It has been in deep consolidation from last 2years and now looks like operators gave a false news for the fall and bought it in a block deal on lower levels which is generally the trick to buy on lows.

Top Indian Bank Stocks Analysis Publishing the TrapZone Pro charts on the daily timeframe for the Top 4 Indian Banks.
They all look Bullish except Kotak Mahindra Bank at the moment.
Will keep this Idea Up dated every few days for reference.

#HDFCBANK #HDFC #Rangebound#HDFCBANK #HDFC showing weakness, its been range bound and it will be good short 1640 is the area of invalidation if flipped into support

HDFCBANKNSE:HDFCBANK
One Can Enter Now !
Or Wait for Retest of the Trendline (BO) !
Or wait For better R:R ratio !
Note :
1.One Can Go long with a Strict SL below the Trendline or Swing Low.
2. R:R ratio should be 1 :2 minimum
3. Plan as per your RISK appetite and Money Management.
Disclaimer : You are responsible for your Profits and loss, Shared for Educational purpose

When will you get Gains on HDFC Bank? In how many days?I can see that HDFC Bank has touch this level so many times and it had gained a lot around 10%-15% in 30 to 40 days as I have drawn in the chart.
From this point I have clear vision of making around 20% gain.
It may show good upward move as the Nifty and Sensex stabilize.

HDFCBANK--Inverse H&S ??This stock is in inverse Head and shoulders pattern
indicating that bullishness in the stock...
Enter long on break of neckline and retest...

HDFBANKNSE:HDFCBANK
One Can Enter Now !
Or Wait for Retest of the Trendline (BO) !
Or wait For better R:R ratio !
Note :
1.One Can Go long with a Strict SL below the Trendline or Swing Low.
2. R:R ratio should be 1 :2 minimum
3. Plan as per your RISK appetite and Money Management.
Disclaimer : You are responsible for your Profits and loss, Shared for Educational purpose
HDFC--Near to Support??The stock is trending downwards....
In Higher time frames price is in channel....
price is at support + trendline.
If it is a bullish turn price breaks the trendline and retest will look for buy side....
If no break is detected and again falls will be on short side....
most chances of fall again...it has to clear the liquidity @1600 levels...
Keep safe...

HDFCBANK HDFCBANK - The stock has a bearish wave downwards and could continue to further lower levels. A consolidation below the trendline is a possibility. However, the moves are quite strong when in wave 3.
This idea is based on the Elliott Wave theory. Manage your own trade/Investment with proper risk management.

HDFC BANK pattern breakdown?A rising wedge type of pattern can be observed in the weekly chart of HDFC Bank. Price has failed to breakout above the 1750 level 4 times in the past 2 years. Price seems to have broken down on the weekly chart from the pattern.
Supports at 1580, 1530.
Good medium to long term buying opportunity if it reaches around 1410 which is the 200 EMA on the weekly.

HDFCBANK--Trading in a channel??the stock is trendnig upwards...
previously a strongfall is observed from the zone 1740.
price again broken this zone and failed to close above that zone...
and again a strong fall is observed...
now price is trading near to its previous resistances...
keep an eye on these levels...

#MUTHOOTFIN... Looking good 25/07/23#MUTHOOTFIN...
Intraday as well as swing trade
All levels given in charts ...
IF good potential seen then we work in options also
if activate then possible a good movement Keep eye on this ...
We take trade only when it activates...
Possible to give good target
TRADING FACTS

STBT/SWING BEARISH TRADE CONDITION Refer chart for all level.
Short on hourly close below Friday's low.

#IDFCFIRSTBANK... Looking good in upcoming sessionlong term inverstment call
🧲🧲🧲🧲🧲🧲🧲🧲🧲🧲🧲
IDFCFIRST BANK
BUYING RANGE - 83-85
STOPLOSS 80
TARGET 100/123/138/150/200++++

HDFC bank target 2175 Strategy- Cup with handle pattern
CMP- 1688.75
Target- 2175
Approx Gain -30%
Largest bank of Bharat with high net profits and in a consolidation state from past 2 years. Best buy both for short term and long term.

HDFC - Almost nearning demand zoneHDFC is nearing demand zone.
Good buy on the Banknifty and HDFC for short term once it touched the demand zone.
Note: This is for educational purpose.

HDFC about 40%-50% over a period of next one year.The largest merger agreement in India to date, between HDFC and HDFC bank, has piqued the interest of Indian investors. Whenever there is news about a merger, prices peak in the near term and then recover. So, for the time being, it is extremely possible to halt current progress and retrace to 1600 before rising to 2600-2800 during the next year.
