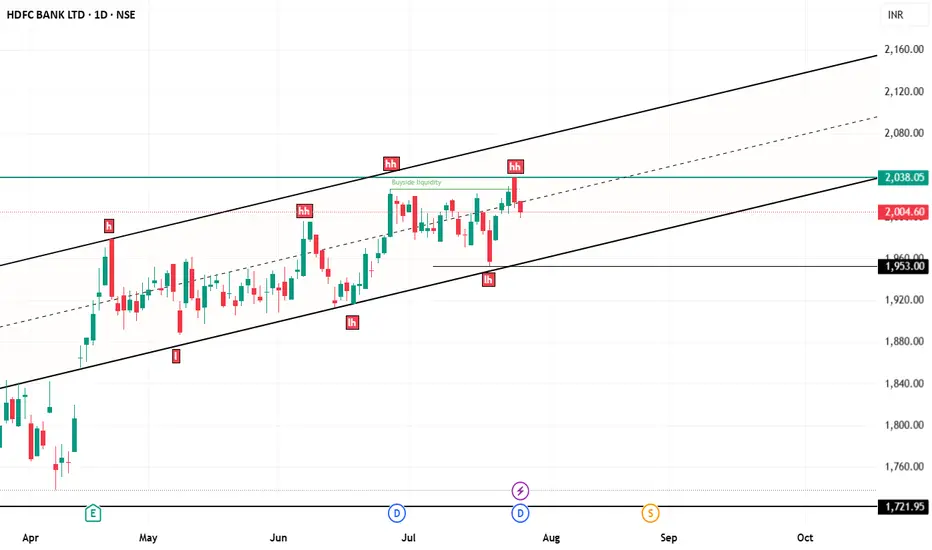
hdfc bank chart analysishdfc bank chart here in your screen
price working in parallel channel and 2038 is most important level for upside rise...
if 2038 break out with powerful vollume and candle then again we can see rally.
but a pattern here that is higer high and lower low...
Hdfcbankforecast
Low risk Zone near 1550Multiple long term support cross near 1550 (Trendline Support with 200 week SMA ). So we consider 1550 as a low risk zone for HDFC BANK .

BUY HDFC BANK ABOVE 1906HDFC Banks is bullish and will give a fresh breakout above 1906.
Buy HDFC Bank if closes above 1906 on daily time frame for the Targets of 1974 and 2047 until 1824 is intact on downside.
To motivate us, Please like the idea If you agree with the analysis.
Happy Trading!
InvestPro India

HDFCBANK : Approaching Key Breakout ZoneOverview: HDFC Bank Ltd. is showing a series of breakout attempts, suggesting a build-up of buying pressure. The stock has repeatedly tested a resistance zone, indicating a potential for a breakout if this level is breached with strong momentum.
Key Levels and Zones:
Resistance Zone (Multiple Breakout Attempts):
The stock has faced resistance around the ₹1,750 - ₹1,760 level on multiple occasions, marking this area as a critical breakout point.
A sustained breakout above this level, particularly on a weekly basis, would signal bullish strength and could lead to a strong upward move.
First Resistance for Retest (₹1,881):
Once the breakout is confirmed, the stock may face initial resistance around ₹1,881, where some consolidation or a retest of the breakout could occur.
Second Resistance for Consolidation (₹1,992):
If the stock sustains above ₹1,881, the next significant resistance level is around ₹1,992. Consolidation at this level could provide additional momentum for further upside.
Target Zone (₹2,231):
Upon clearing the earlier resistance levels, the stock has potential to reach the target zone at ₹2,231, representing a new high and a possible long-term target for investors.
Technical Indicators:
The stock is trading near its 200-week moving average, suggesting it is above a strong long-term support level.
The formation of higher lows indicates an uptrend, adding to the bullish sentiment.

Hdfc bank technical analysis for tomorrow (09/Dec/2024)Hdfc bank moments for option and future trading 09/Dec/2024
follow us for more updates information.
message us for any stocks related information

Hdfcbank moments for intraday, option future trading 02/Dec/2024Hdfcbank moments for intraday, option future trading 02/Dec/2024
follow us for more updates information.
message us for any stocks related information
WELCOME TO ARROWINDEX
We're dedicated to providing you the best of Finance stock market , with a focus on dependability and Investment. We're working to turn our passion for Finance stock market into a booming online.We analyze Live Market and try to Provide learning information Content. All the Live Market views and charts .We hope you enjoy our Finance stock market as much as we enjoy offering them to you.Support and offering
Effective online education modules for all segments of traders
Customized portfolio tracker Online research & trading guidance
Entry and Exit support for:-
Intraday trading,Swing trading,Scalping,Position trading
Future & Delivery trading
Technical analysis
Fundamentals analysis
Fii & Dii data and reports

HDFCBANK // Go Longwww.tradingview.com
HDFCBANK: Without describing so much, lets jump into levels.
Here are the levels for HDFCBANK.
Support : 1690 / 1625 / 1570
Target :
Short term : 1900 / 2000 / 2120
Long term: 1950 / 2550

Hdfcbank moments for intraday and option trading 25/Nov/2024Hdfcbank moments for intraday and option trading 25/Nov/2024
follow us for more updates and information.

HDFC BANK BULLISH IN 1HOUR CHARTNSE:HDFCBANK
HDFCBANK Looking bullish in 1 hour chart.
Buy Price 1550-1560
Sl 1500
Target 1650,1735+

HDFC BANK 15m TIMEFRAME PROJECTION5-Minute Timeframe has a strong order block area.
The last 1h candle is supportive and fat bullish candle.
The overall trend is bullish.

HDFC Bank 1D Timeframe ProjectionHDFC Bank 1D Timeframe Projection
Allover Market is Bullish It's just a retracement.
The 1D timeframe projection for HDFC bank indicates a bullish trend in the market that is currently undergoing a retracement. This presents an opportunity for long-term traders or investors who seek to capitalize on the prevailing market conditions. The current trend suggests that the market may experience an upswing in the near future, making it an ideal time for potential investors to consider long-term positions. The current market conditions present a favorable climate for investors seeking to establish long-term positions in HDFC Bank.

HDFCBANK LONG Target 1700The chart in weekly timeframe clearly shows a deformed inverse H&S with a target of 1700 in 2 to 3 months time from now

HDFCBANK--Drop Base Drop??This stock is now at resistance zone.
price previously a strong fall is noticed from top side @ATH Levels,
price is now in consolidation at support levels...
This is the place again we have to look for continuation or reversal again to test the bottom side demand at 1240 zone of support.
keep an eye on these levels.

HDFCBANK--This stock is now in consolidation.
we have a chance of manipulation below support levels...
keep look for buy side from this demand zone...
if price breaks the demand will look for short side continuation...OR Reversal again by bear trap.

HDFCBANK Analysisprice broken the bearish trendline, while breaking the trendline price leaves a demand zone on bottom side.
so wait until price test the demand zone and go for long entry in HDFCBANK.
Mark the targets on topside every intersection points to the trendline.
If price breaks the bottom side demand zones, by consolidating between the demand and support zone price will breaks the support.
so until it breaks the demand zone look for long side.

HDFCBANK--Drop base Drop?? I am sharing the important levels of Support and Resistance. These levels plays a crucial role in trading decisions, as they act as reliable markers of price movements.
------>>Support levels are price points where an asset tends to find buying interest, preventing it from falling further.
---->Resistance levels, on the other hand, are points where selling pressure typically prevents the asset from rising higher.
Take a look at these levels and trade accordingly. Recognizing and respecting these support and resistance levels can help traders make informed decisions and manage risk effectively. They serve as key reference points for technical analysis and are vital tools in successful trading strategies.
Trade safe...Thank you guys for your support

Great buying opportunity in HDFC BANKPrice is undergoing expanded flat correction.
Good to accumulate around 1200-1300 levels for a target of around 2600 in medium to long term.
Price is heading towards pre covid levels while the revenue & net profit have almost doubled.
Do your own due diligence before taking any action.
Peace!!

HDFCBANK--Trendline Holds or Breaks??This stock is currently trading near its trendline...
a strong fall is observed from the previous resistance levels...
this is a good opportunity for us to enter long side....
If trendline breaks and retest will go for short side....
look for buying opportunities in this stock.

HDFC BANK SELLHi, According to my analysis of HDFC Bank stock, there is a high probability of a downturn. The price bounced from a very strong area, which is the resistance at 1720. Two very negative candles were formed, as shown in the analysis. We also notice that the stock is trying to break the flat pattern. Finally, good luck to everyone .Note: If you like this analysis, please give your opinion on it. in the comments. I will be happy to share ideas. Like and click to get free content. Thank you

HDFCBANK--End Of Bearishness ??The stock is Near its demand zone,, it indicates that there is potential buying interest at that price level, and it could be a strategic point to consider for investing or trade.
find long opportunity in this area....

Buy HDFCBANK 1565 TGT 2200/2650 sl Below 1230Hdfcbank has given a meaning full correction on intraday basis and is taking the support on major levels, It has been in deep consolidation from last 2years and now looks like operators gave a false news for the fall and bought it in a block deal on lower levels which is generally the trick to buy on lows.

HDFCBANK--Inverse H&S ??This stock is in inverse Head and shoulders pattern
indicating that bullishness in the stock...
Enter long on break of neckline and retest...

HDFC--Near to Support??The stock is trending downwards....
In Higher time frames price is in channel....
price is at support + trendline.
If it is a bullish turn price breaks the trendline and retest will look for buy side....
If no break is detected and again falls will be on short side....
most chances of fall again...it has to clear the liquidity @1600 levels...
Keep safe...
