HDFCLIFE: Elliott Wave Signals Reversal or Breakdown? Understanding the Current Setup
The chart reflects a corrective Elliott Wave structure (ABC pattern):
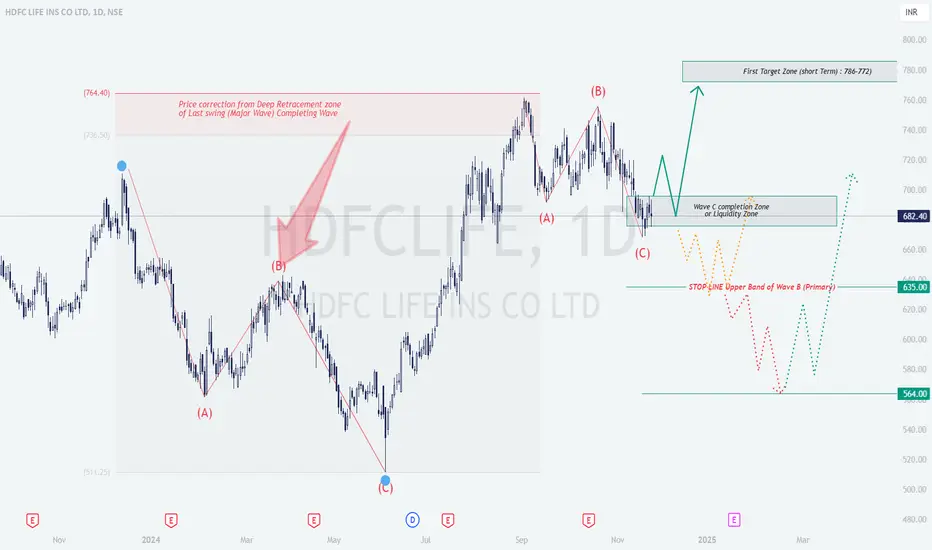
Wave A: Initial decline from the peak of ₹764.40.
Wave B: Pullback to a resistance zone after Wave A.
Wave C: Continuation of the downtrend, nearing a potential completion zone or liquidity zone around ₹670-680.
The stock is currently consolidating near this Wave C completion zone, signaling a possible reversal to the upside.
Trade Setup Explanation
Bullish Setup:
Logic: If Wave C concludes within the Liquidity Zone (~₹670-682), an upward reversal is anticipated toward the first target zone at ₹772-786.
Entry Point: Enter after a clear breakout or reversal signal (e.g., bullish candlestick, trendline breakout, or volume spike).
Targets:
- Target 1: ₹772-786.
- Target 2: Further upside based on price action.
Stop Loss: Below the Wave C lower boundary (~₹635).
Bearish Setup (Alternate Scenario):
Logic: A breakdown below ₹635 suggests further downside.
Entry Point: Short on confirmation of a breach below ₹635.
Target: Next support zone at ₹564.
Stop Loss: Above the Liquidity Zone (~₹680).
Technical Analysis Insights
Fibonacci Levels: Wave B retraced deeply (likely 61.8%-78.6% of Wave A). Wave C aligns with extensions (1x or 1.618x of Wave A).
Liquidity Zone: The ₹670-682 zone is a demand area where institutional buying might occur. Look for bullish candlestick patterns for confirmation.
Target Zone: ₹772-786 is a key resistance area, ideal for profit-taking in a bullish scenario.
Stop-Loss Placement: Logical stops are set below the invalidation levels (~₹635 for bulls, ~₹680 for bears).
Prediction and Plan
Primary Scenario (Bullish): Wave C completes in the Liquidity Zone, leading to a reversal targeting ₹772-786.
Alternate Scenario (Bearish): Breakdown below ₹635 invalidates the bullish outlook, with potential downside to ₹564.
Educational Takeaway
Elliott Wave Application: Highlights an ABC correction and potential reversal.
Risk Management: Use stop losses at key invalidation levels to minimize risks.
Confirmation Tools: Enhance reliability using indicators like RSI divergence, MACD crossovers, or volume spikes.
Patience: Wait for price action confirmation before entering trades.
This structured plan ensures adaptability to both bullish and bearish scenarios while maintaining disciplined risk management.
Hdfclifeanalysis
Buy HDFCLIFE 593 TGT 720/940/1204 avg @ 505 Sl Below 418The Stock had been in consolidation and starting to show divergence on RSI and price. Also the increase in volume at lower levels suggesting that stock is in accumulation phase and is ready for the breakout for the above mentioned targets.

HdfcLife Last Downwave before the Reversal
These are the Fresh Source Monthly Supply and its destination Monthly Demand,
After reacting to the Source Supply Price has headed downward to the Demand,
This is how Price has been coming towards the Monthly Demand and this is the last
Fresh Daily Supply, after reacting to this Price should continue the downtrend till it reaches its Destination of Monthly Demand and then Shoot up.

HDFCLIFE TOWARDS 800-840 levels
HDFCLIFE Ltd is trading in an up-sloping channel, and within this channel, there is a probability of a Shark Pattern, which if unfolds can take stock towards 800- 840 levels in the coming weeks and months.
Can't comment on how smooth is movement is going to be, but any dip in the stock would be an opportunity to go long in the stock, as long as the stock is trading above the 590-600 levels.
Positional Trade timeline: 3-4 months.
The upside of approx 25%, more if bought in the dip.

HDFCLIFE--Bullish or Bearish ??------>> the stock is trending upwards.
-------->> now the price is at resistance facing some difficulty to move upwards,
---------->>broken the trendline and trading in a range, waiting for retest of supply and continue to fall down or take the help of demand zone and will again move upwards.
----------->> track this stock price from demand to go upside or breaks below sell on retracement to bottom demands.
we have demand @ 520 range.
supply @ 590 range.
keep track this instrument.

HDFC Life Insurance easy 15% gainsNSE:HDFCLIFE
Gains: 15%
Duration: 80-90 days
*Not a financial advice.
My charts speaks louder than words.
I'm a chartist and I paint charts.


HDFCLIFE - BREAKOUT TRADEHDFCLIFE has been struggling to get past 600 levels since the start of 2022, every time prices reach there, it corrects all the way down.
Currently, prices are again at 600 levels and now price action is giving positive signs, that breakout might happen this time.
Price should sustain above 550 levels.
Above 600, it might test 650 levels very fast.
Wait for a breakout or buy on dip with strict stop loss.

Inverted Flag, May see further correction important levels, forming an Inverted HnS pattern and stock looking weak.

HDFCLIFE LONG (INTRADAT NOV 9)Hello TradingView community and my followers, please if you like the ideas, don't forget to support them with likes and comments, thank you very much and here we go.
.
HDFCLIFE on daily it is trying to start uptrend from daily support zone and in 1 hour chart it has made ascending channel and currently it has come at the demand area so from this zone buying pressure could step in.Watch patiently. Thank You !

HDFCLIFE Pullback ViewAs per my analysis NSE:HDFCLIFE can take pullback.
I can take entry if price come back to level of 524 and hold till target of 556 & 561.
Will exit from trade if price trade below 495.
Note: This is my personal analysis, only for learning.
Thanks

hdfc life breakout HDFC LIFE is gonna give a huge breakout here keep in watchlist or 520 is the right price to enter here preps in order cmp is 523
NSE:HDFCLIFE

HDFCLIFE - POSITIONAL CALLHDFC LIFE looks good, on all the timeframes.
We could see it closed well in the last week, forming a bull candle, that closed near its highs.
Now sustaining 560 levels, it could move towards 670 levels in the coming weeks.

HDFCLIFE - Long viewThe stock has created a good base at the level range of 509 levels.
As you can see the stock has taken support around this area and moved upwards.
It reached a high of 775 levels before crumbling to huge selling pressures.
The stock is trying to make its way back to the top.
I have presented my views on the chart with levels that can help you take your trades.
Thanks & Regards,
If you feel you can make use of my views and put them to good use, request you to kindly revert with feedback/suggestion/improvement

HDFCLIFE - Long view for Educational purpose onlyThe stock has moved above its major support area and is trading above the next support area of 674 levels.
We have a strong bullish candle on the daily time frame.
Kindly refer below mentioned trade details for study only.
BUY
ENTRY 700
STOP LOSS 691
TARGET 723
PROFIT 2556
LOSS 1000
QUANTITY 111
On the lower side
SELL
ENTRY 670
STOP LOSS 680
TARGET 639
PROFIT 3100
LOSS 1000
QUANTITY 100

HDFC trend analysis for November monthHDFC bank and AXIS bank are struggling to move higher from February's high where the SBIN and ICICI made 20-30% higher from February high.
As there is no recent events and could expect the stock move sideways for next two months.
Range - 1370 ~ 1620
Support - 1350-1400
Resistance - 1550-1630

HDFCLIFE - Stock for tomorrowHDFC Life recovery from 690 levels, is quite interesting and the stock looks good on most of the timeframes.
For tomorrow, if it sustains above 700 levels, it would be mostly moving towards 715 levels and above.
SL around 697 levels.

HDFCLIFE support and resistance trend line since 2018Analysis on HDFCLIFE.
Testing its trend support and resitance line around 5 times.
Taking the resistance line (range btw March to August) as support line.

Channel Breakout and retest done.Stock Analysis: HDFCLife has broken the channal and retest done with reversal pinbar it is good buy on current level with below demand zone as stop loss level for the given target on the chart.
Lets' see
Happy Investing!

Hdfc life insurance Hdfc life insurance, this stock seems to have completed wave (II) of 3, as macd in weekly turned positive above zero line, as per price action this stock has given breakout with good intensity of volume in both weekly and daily time frame, wave structure suggests that now the stock is in wave (III) of 3, as wave (III) unfolds that can possibly push stock higher price zones near 958, one can go long at these levels or in dips (if any) with stop loss of 655, all the key levels are mentioned in chart with stop-loss and targets.
Key levels are mentioned on chart
Breakout in weekly with good intensity of volume
Breakout in daily with good intensity of volume
Wave Structure in Weekly
Macd in weekly positive crossover and Uptick and also above zero line
Rsi in weekly uptick and also above 60
Rsi in daily above 60 but waiting for uptick
Dmi adx also positive with ungali setup in weekly
Price above Upper bollinger band in weekly
Disclaimer
I am not sebi registered analyst.
My studies are Educational purpose only
Consult with your Financial advisor before trading or investing.


HDFC LIFE : Pullback tradeThe stock looks great, we could see a trendline breakout with a decisive candle with good volume.
Though the stock did not see a good momentum movement post-breakout.
Now if it sustains 660 levels, chances are that it might be moving towards 720 initially and then towards 750 levels.
Trade type: Positional

HDFCLIFE Head and Shoulders NSE Setupprice make huge head and Shoulder's pattern on weekly time frame
Neckline breakout done
Support Buy 635 - 650
Stop : 550
Target : 700 , 750 , 835 , 900 , 1000
