Potential ETH IH&S Continuation (4H)BINANCE:ETHUSDT might be forming an Inverse Head & Shoulders on the 4H chart.
• A right shoulder around ~$2400 would complete the pattern
• Confirmation comes with a breakout above the $2730 neckline
• Measured move target: ~$3130
Keep an eye on ~$2800 – it's a key daily/weekly S/R that could provide strong resistance and possibly stall the breakout.
In a No-Trade Zone until either a bounce from $2400 or a break above $2730.
HEAD

Injective Short-Term Inverse Head & Shoulders Bottom ReversalBITGET:INJUSDT successfully completed an IH&S Bottom Reversal pattern.
The measured target is $15.20, reinforced by the 200-day EMA.
If you missed the entry, watch the $10.80 neckline for a potential retest as support.

1INCH Inverse Head & Shoulders (1H)BINANCE:1INCHUSDT completed an Inverse Head & Shoulders pattern, clearly visible on the hourly timeframe.
Key Levels
• Left Shoulder: $0.223
• Head: $0.218
• Right Shoulder: $0.223
• Neckline: $0.232
• Measured Target: $0.245 (aligned with local high)
Status
Breakout has already occurred, activating the target.
Next Steps
It may be too late to chase, but a retest of the neckline as support (~$0.232) could offer a compelling long entry.
Invalidation Levels
• Early Invalidation: Break below $0.232
• Full Invalidation: Break below the right shoulder at $0.223

Potential NEO 1H ScalpBITGET:NEOUSDT is currently testing resistance around $6.66 with RSI in overbought territory, which could trigger a short-term pullback.
A 0.5–0.618 retracement into the unmitigated hourly FVG ($6.39–$6.47) could provide a compelling long entry, while allowing an RSI reset and potentially forming an IH&S pattern.
The measured target for a breakout above ~$6.66 would be ~7.00 (still valid in case of a direct breakout without a pullback).
Setup 1
• Trigger: Pullback to $6.39–$6.47 and reversal
• Invalidation: Sustained break below $6.39
Setup 2
• Trigger: Break above $6.66 with volume
• Invalidation: Failure to hold $6.66 after breakout

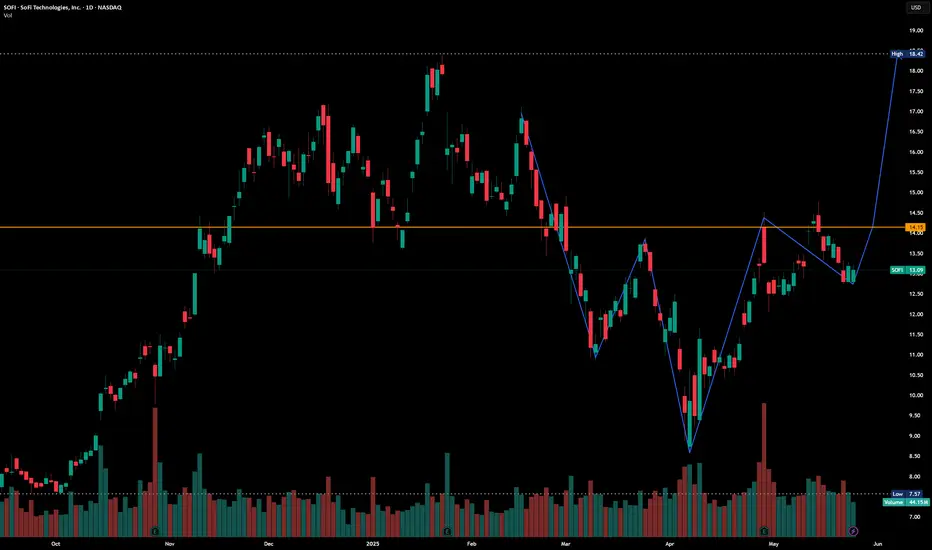
SOFI Charts are interesting.. SOFI is in making of Inverted head and Shoulder pattern. Current market Price is nearly $13. If cross $14.90 and sustain , it may got to $18 and $20.
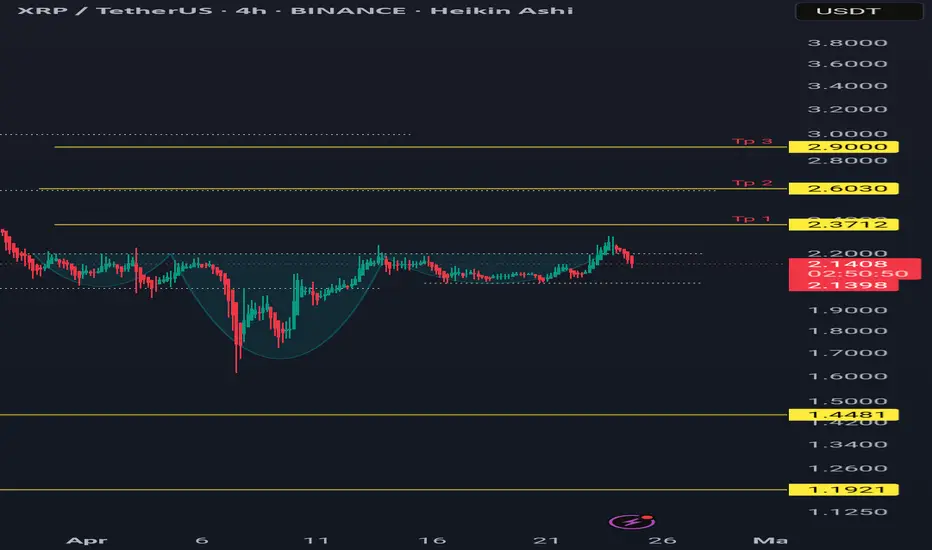
Xrpusdt formed a ihead and shoulder patternXrpusdt formed a ihead and shoulder pattern
Buy area
2.2-2.05
Targets are 2.37 tp 20%
2.6 tp 50% then move to breakeven
2.9 100%
Invalidation bellow the right shoulder
2.02
Stellar (XLM) Falling Wedge + Inverse Head & ShouldersBINANCE:XLMUSDT has recently broken out of two major bullish patterns:
• Falling Wedge: The breakout above the descending resistance (orange) confirms the wedge setup, with a measured target around $0.70.
• Inverse Head & Shoulders: Breakout confirmed with a measured target around $0.40.
Key Levels to Watch
• $0.30 – 0.618 Fib level. IH&S neckline and current support. A break below it would invalidate the IH&S setup and potentially lead to a retest of the wedge's resistance as support.
• $0.36 – 0.5 Fib level and previous S/R.
• $0.40 – IH&S measured move target.
• $0.50 – 0.236 Fib level and previous resistance / swing high.
• $0.70 – Wedge measured move target.
Volume Analysis
Breakout volume is not as strong as expected, suggesting the need for further confirmation. A continuation with increasing volume would strengthen the bullish case.

VeChain Range & Structure AnalysisBINANCE:VETUSDT has been range-bound since November 2023, with very clear levels.
Key Zones
• Weekly Demand Zone: $0.019–$0.022 — major support with multiple rebounds.
• Weekly Supply Zone: $0.045–$0.055 — strong resistance dating back to early 2024.
• Midrange / HVN: ~$0.037 — heavy volume area and likely resistance if tested.
• Local Resistance: $0.027 — recent swing high + S/R since December 2023. A daily close above could mark a change of character and a shift to a bullish bias.
Possible Scenario
• With a daily close above $0.027, VET may revisit the $0.055 range high — with potential resistance at the midline along the way.
• If $0.055 is reached and followed by a sharp rejection, we might start seeing the formation of a macro Head & Shoulders — with $0.019 as a key neckline.
• Breakdown below $0.019 would activate a target near $0.0045.*
• Break above $0.055 would invalidate the H&S idea and could open the door toward $0.1150.*
* H&S scenario is purely hypothetical and would require structure confirmation.

Who knows ?SUZB3 is in an uptrend channel on the monthly chart, specifically at the lower edge of this channel, in a region that would indicate a buy, however, at this position on the 2-hour chart it presents a head and shoulders pattern at the end of a downtrend line. Meanwhile, the RSI shows divergence indicating a reversal to an uptrend.

Bitcoin Breakdown Head & Shoulders Pattern Death Cross in Play?This daily BTC/USD chart is showing a potential Head & Shoulders pattern, which is a classic bearish reversal structure. But that’s not all Bitcoin is also at risk of forming a Death Cross, signaling deeper downside potential. Here’s what stands out:
🛑 Key Bearish Signals:
🔻 Head & Shoulders Formation: The pattern consists of a peak (head) with two lower peaks (shoulders) on either side, indicating a loss of bullish momentum.
🔻 Neckline Breakdown: BTC is testing the neckline support around $76,000—a break below this level could trigger further downside.
🔻 Death Cross Forming: The 50 SMA (yellow) is sloping downward, getting dangerously close to crossing below the 200 SMA (blue)—a well-known bearish signal that could accelerate selling pressure.
📉 Bearish Targets if Breakdown Confirmed:
If BTC breaks below $76,000, the measured move projection suggests a possible drop toward $50,000-$52,000, aligning with previous structure support.
🚀 Bullish Case – Can BTC Recover?
For bulls to regain control, Bitcoin must reclaim $88,000+, invalidate the breakdown, and push above key moving averages. Otherwise, downside pressure remains strong.
⚠️ Final Thought: Death Cross + Head & Shoulders = Bearish Storm?
A Death Cross happening alongside a Head & Shoulders breakdown is a dangerous combination for bulls:
- A Death Cross occurs when the 50-day moving average crosses below the 200-day moving average, signaling a long-term trend shift to the downside.
- Historically, BTC has seen major sell-offs after this formation, especially when combined with bearish structures like we see now.
- If BTC loses $76,000, the next stop could be $50,000-$52,000—but if bulls defend this level and reclaim FWB:88K +, they can avoid disaster.
Verdict : Bitcoin is at a make-or-break moment—either bulls step in now, or we could see a steep drop ahead. Will you short, or do you think this is a bear trap? Let’s discuss! 🧐🔥

ETH - Super bullish inverse H&SCould we be looking at a super bullish scenario of an inverse head and shoulders for ETH? It looks ugly, but could work if the neckline is decisively breached. If it is, we could be looking at some serious gains for ETH. This isn't meant to be fake news or an attempt to gain followers, it's all on the pile of possibles until made improbable. So, we'll keep our fingers crossed and look for higher highs. Until then, follow for more.

SOL/USDT: Are We Gearing Up for a Big Move?Take a step back and look at the big picture for SOL/USDT. There's a long-term head and shoulders pattern forming that could redefine where Solana is headed. Pair that with the Hurst cycles, and we have a cocktail of signals that just… works.
If this plays out, we might see a week-long breach of the upper trend line in the next 18 months—a move that would confirm higher highs are on the horizon.
This is the kind of setup that rewards patience. Do you see it breaking out, or is this just wishful thinking? Follow and share your thoughts below—let’s see how this one plays out. 🚀

ETHUSD - I still believe (on the H&S pattern)While I'm not an hyper fan of H&S pattern but this one forming is already so beautiful that I want it to happens to illustrate my futures arguments,
saw a lot of ppl talk about h&s pattern the past days on BTC, the leg would have started on November and bring us to 80k, something like this. Not a pro but I learnt that the pattern has to be kinda well drawn to be called an H&S, forming proper top and lows with proper neckline, and be well timed.
that is/was absolutely not the case for BTC and that why I remain bullish for now (yes, I risk it a bit saying that here and now)
even in the case where BTC goes under 90k, we can't call this an H&S, by respect of all the real H&S out there. That's also why most of the times it looks like ppl fail using this pattern, they use it on everything
BUT in this case for ETH this looking really juicy atm, I don"t have specific target for now I dont think eth will pass above 12K for this year but lets see
Cheers, have a good day

Why is BTC down today?Stocks and crypto both down the last couple of days. BTC often levers the remainder of the cryptosphere up and down based on it's own direction. Very much like a teacher and a group of students. Most will do what they're told, but there will also sometimes be a couple of rogues that don't follow the pack. With regards to BTC, we could be looking at a head and shoulders top. We've seen a piercing of the neckline today, only to rebound back above it. I'd say that if we see a decisive open and close below the neckline on a 4HR timeframe (minimum) H&S will be confirmed and we'll be down to the long purple box where there lies good resistance. Fear not! This is normal, natural and if you're an investor don't go chopping and changing. Just enjoy your weel and look out for the next few posts where we could leverage a great buy back with some extra cash. So, if you're going to do anything - raise some capital to add in! Follow and share for more.

BTC, clear H&S top - more down to comeIt looks as though we have a head and shoulders top in play with BTC. Left, head and right are clearly marked on the diagram. If, the red neckline should be broken then we go down to the 70s which will present a wonderful buying opportunity for those who are not in or want to buy a little more. Long-term, we're still very much on the upward trend but be careful if you have any day trades for longs as the most likely probable outcome is down. Follow for more.

Binance stalled, but will go higherBinance coin is stalled undertaking a long-term inverted head and shoulders pattern. There is likely to be a bit more down, before busting through the upper trend line on to new all time highs. Keep a close eye on it, as it's buffeting nicely. I'd take a long trade once there's confirmation of the upper trend line being decisively breached. Else, we might see a failed head and shoulders. Keep a close eye and follow for more.

BEML breaking out of bullish HEAD & SHOULDER patternBEML is breaking out on daily charts
previously it has broken out of bullish head and shoulder pattern.

Usdchf bearish with big movement
*We have head & shoulders pattern on 4H
*price rejected from resistance then rebounded from 1H FVG
Enter after breaking 1H trend, and then re enter after retest pattern neck

$BTC 1D looking good boys! Possible Head?I’m not sure but if it is a head for the second shoulder instead and this is the half way point in this last end of the Bull Run maybe months left but it’s coming to the MAIN part then it will slow up and go sideways if not down A LOT.
Just be prepared for it and know a plan or strategy to get out with profit even to a stable coin or flipping coins that profit at different times and flip them when one coin pumps the other dumps and vice versus some ppl have done this virally and got Insta famous and rich.
Don’t not experiment here. Buy something you wouldn’t think you would but be sure it’s a good bag first due diligence is always needed.
This chart and my talk IS NOT FINACIAL ADVICE AS I AM NOT ONE .

BTC: Oops!tober Just Getting StartedFrom the previous chart of BTC the correlation of down trend in this bull market is a norm matter. Just watch how the market would create decision for more interest rate cut revival.
If BTC is doing its Head and Shoulders pattern. It would attract more buyers at the bottom.
The Diamond Shape in blue color is a Mini Diamond in the previous Big Diamond drafted.

Head&shoulder pattern in BSEHead & shoulder pattern breakout will be possible in it keep eye on it .
Buy bse only above 2660 (closing)
Target 2761 2885 3112 3252
Sl 2490

Bitcoin's Inverse Head & Shoulders Playing Out As ForecastedFive weeks ago I made my first analysis on this pattern where I argued that the dotted purple support was my ideal target for an inverse H&S reversal pattern.
Once we were there it was a moment of truth for the bulls. My initial trade had a stop that was too tight. Nevertheless the overall idea was a success since we've now successfully reversed from my purple support area.
The daily RSI hitting oversold for the first time in almost a year was a great entry signal for crypto as a whole.
I'm expecting the bullish trend to continue at least for the next few weeks towards the top resistance (neckline) of the H&S.
Keep in mind, the inverse H&S is not completed yet. Once we hit the neckline (and ideally break through it) we can see a new all-time high coming soon.
Are you bullish or bearish? Share your thoughts.

BTCUSD - Inverse H&S ?Previously attempt has failed so im gonna try this one in a bigger picture
we are currently sitting on the daily 100 MA and an Inv H&S is in the making, if we go above 63K I think it will be in play
target same as before ATH+++
if we break 100 MA Daily, 60k
if we break 60K, 55555 for the fun then prob 50k
cheers and good luck
