Huge volume spike on zrx takes priceaction over neckline of ih&sI assume the hype about zrx soon coming to coinbase is the big culprit for why zrx has seen such a massive spike in bull volume that has brought it well above the neckline of its inverted head and shoulder pattern. However to trigger the breakout I think we will need the current 1 day candle to also close above the neckline...if so you can likely expect the price action to reach the green target posted here on the 1 day chart. A fakeout is still a potential possibility so tread carefully.
Head-shoulder

Head and Shoulder This don't need explanation every things is visible clearly, it can breakout upward but usually a normal H&S must break down.
Let see which way it will choose.

Slight chance @ both a C&H on 1hr btc chart & an inv h&s patternKeeping this idea neutral now because although both patterns are in play I don't have that high of confidence either will actually get triggered...the main one I'm gonna show first is this Cup & handle pattern that is forming on the 1 hr chart. We can see that the 1hr 50ma and 200ma are very close to completing a golden cross here and that the 200ma on the 1hr chart is so far holding support fairly well....the 200ma on the 1hr chart and the 200ma on the 4hr chart are sort of overlapping right now and acting as a kind of double reinforced support and the 4hr chart is also on the brink of a golden cross as well. If the 4hr charts 200ma can maintain support as well as the 50ma when it comes up above the 200ma if it maintains support I think these 2 patterns triggering can very much so become a reality but for now I'm not that confident in them only wanted to mention that they were worth keeping an eye on....below this in a follow up update I will post the inverted head and shoulder I decided to post it separately so you can more clearly see the cup and handle pattern but essentially the cup is the 2nd shoulder of the inv head and shoulder pattern.
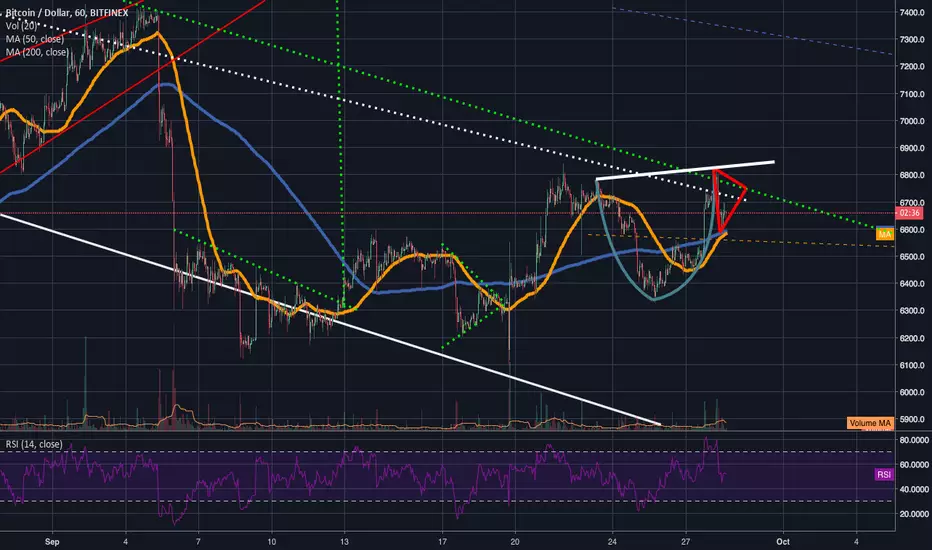

SHS Posibble! Trade Smart! Trade Careful!Posibble Shoulder Head Shoulder Pattern BTC/USDT.
Low Volume, RSI doesn´t break resistence.
Be Smart!

BTCUSD - 4H - Will it Shoulder Again, or Just Tank?Interesting pattern on the 4H.. will there be a brief reversal this afternoon before night traders beat it up? Or have the day traders had enough hucking & hoping?

NEO :- Potential Inverse Head and Shoulder Neo seems to be in a potential inverse head and shoulder pattern and seems to be respecting it for the moment.
Keep in mind that a downtrend line within the right shoulder has been drawn and this resides within the right shoulder.In order to see the right shoulder play its part that would require a breakout from the downtrend line.
A potential target for the IHS is placed at 95+ levels and keep in mind a nice breakout to the upside would be possible as soon as we see the trendline on RSI breaking out.
A major move could be in the offing at any moment.

Bitcoin funny Inverted Head n Shoulder behaviour...Hi,
This is my first Trading View trading idea attemp and this is more a question than an idea...
Didn't we manage to finish the inverted head and shoulder pattern? Shouldn't it go up instead of going down... :/ ?!
I guess that we miss a candle close above the neck line, right?
Cheers and enjoy my 1st crappy trading idea :D !!
Ad

head and shoulder pattern formationHi! Today we see the end of the formation, a head and shoulder, i expect that the price will stop at 8300-8500 (8300, on the trendline), to come back 6500. And after, you know the story

Head and shoulder Possible head and shoulder, i think that the third blu triangle will be completed, so for now the idea is going short till violet line. Reached this line, in my opinion MCDONALDS will follow the down trend (under blu line) with second target fix to orange rectangle (zone 113.36)


GBPUSD: Possible Head and Shoulder formationGBPUSD: Possible Head and Shoulder formation. Buying at right shoulder. SL is ATR.

EURGBP: Possible Bull Head & Shoulder. Buying at Right ShoulderEURGBP: Possible Bull Head & Shoulder. Buying at Right Shoulder

EURUSD: Bear H&S or Continue uptrend? IDK!EURUSD: Bear H&S or Continue uptrend? IDK! So my setup is trying to catch if one of the moves. SL is ATR.

EURUSD: Possible Head formation. Preparing to sell at topEURUSD: Possible Head formation. Preparing to sell at top of right shoulder. Entry is at 61.8% fibonacci level which also confluence with long period Ichimoku base line and long period middle bollinger bands line.

AUDJPY: possible head and shouldersselling at right shoulder. one on top right shoulder, one below SR level. SL is ATR


EURUSD: Possible head and shoulders formationEURUSD: Possible head and shoulders formation. I'm selling at top of right shoulder and SL is ATR

Bearish SPY Head 'n' Shoulders FormingThis head and shoulders pattern is almost text book so far in its present development. Volume is up on the advance of the left shoulder and lower on the advance of the head. We're missing that extra warning of the increase in volume on the decline of the head. There is, however, very weak rise in volume on the decline of the right shoulder. Combined with weakening breadth I'm fully taking it as a bearish turn.
We still have to see that neckline support break convincingly with a nice rise in volume for the pattern to complete.
The "rough guide" price target is ~195.
Let's see what happens.
