Head-shoulders

GU 1H, BEARISH HEAD & SHOULDERS, TP1Bearish H&S pattern forming a retracement at the TP1 of the Daily bullish Gartley.


GU 1H BULLISH, HEAD & SHOULDERS, CONFIRMATION Entry at 1.29076, Stop loss at 1.28849, Target at 1.29494

Potential 4hr chart falling wedge confluence w/ h&s drop targetThe current price action is starting to form a potential falling wedge on the 4hr chart...interestingly enough the apex of that potential falling wedge is at the exact same point as the drop target from the 4 hour chart head and shoulders pattern we recently broke down from. I find that confluence very interesting and something that gives more credence to this four hour wedge being legitimate. However with such a big support line as the weekly 200ma just below I'm not gonna be trying to do any limit sells or even shorts here because that support could easily bust us up out of this pattern logn before it reaches the wedge apex/h&s drop target. For this reason this idea will be left neutral.

XRP Triggers 1hr IH&S pattern breaks up out of Falling WedgeAs expected XRP has busted upward form its inverted head and shoulder pattern on the 1 hour chart. The breakout target of that should have been right at the top trendline of the 4hr chart falling wedge but the price action has exploded well above that and seems like it will very likely trigger the falling wedge breakout as well. So now the price target we are looking for next is 39 cents. We are quite overextended on the stochrsi though so we may consolidate sideways in a bull flag first before continuing upward to the 39 cent target. The current 4hr volume candle is absolutely massive which is a great sign for the bulls. Expect exciting fundamental developments from xrp in the coming days/weeks.

Smells like a fakeout…Looks like a fakeout…Is that the fakeout?Here on the XRPUSD 1day chart we have a pattern of a massive head and shoulders on xrp formed conveniently during a downward trend with a breakdown target of negative 20 cents. The Stoch RSI also bottomed out and is ready to travel upward again so there's not enough bearish momentum available to warrant such a breakdown. The downtrend makes it very unlikely a good head and shoulders because the h&s chart patterns that get validated are usually ones that act as reversal patterns at the top of trends not continuation patterns.Sure there are rare exceptions of when a continuation h&s happens but in reality those are just failed patterns that didnt trigger in my eyes. Still with it looking so obviously like a fakeout it makes one wonder if the whales are trying to fake us out with a fake fakeout...thats the only way I see something like this triggering. On the bitfinex chart this pattern is invalid but It appears to be valid for now on bitstamp,coinbase,and kraken. Its for this fake fakeout fakeout reason that I leave this idea neutral....but with a breakdown target of negative 20 cents, it seems like a ridiculous notion to believe it ever could be anything other than a fakeout.

4hr inverted h&s breaking up target $4585Tread carefully here because we are still within fakeout range but if I wasn't already long now is a wise time to start at least laddering in...can set smart stop losses a few pips below the neckline to be safe as well but even if it dips I anticipate the neckline should hold support.

XRPUSD Pair about to trigger a gldncross on the 1 day & inv h&sTake a look at this picture perfect inverted head and shoulder setup on xrpusd's 1 day chart. Also take a look at how close the 50ma(in orange) is to rising above the 200ma(in blue) for a 1 day golden cross. Now factor in how the stoch rsi indicator has plenty of room to head upwards and is already suggesting its ready to do so. Lastly, factor in that we have already triggered a golden cross and inverted head and shoulder breakout on the xrpbtc pair...the golden cross on the xrpbtc pair has been sustained and didnt become a fakeout which is leading to huuuge leaps and gains over ethereum and btc...all this considered means the golden cross on the xrpusd pair should be sustained with similar results as well. While the rest of the crypto market has been in a free fall..XRP hs held steady making those gains against btc. Yet it hasn't been able to break out of the 48 cents-50cent range yet...once it sustains the golden cross on the usd pairing however we will definitely see it start to make 50-100% gains. First resistance will be back at the inv h&s neckline at 54-55 cents....once we break up from there the next target is the 75 cents range. This is of course just my opinion though so don't take it as financial advice for a financial advisor I am not. Thanks for reading!!

XRP breaks well above inv h&s neckline forms higher highYou can see here on the 1 day chart that price has broken well above the neckline but is seeing resistance right at this blue horizontal line...what you cant see here is that the candle has already thrown a tiny wick above that line thus forming a higher high over the green candle where the horizontal line starts...in doing so XRP has broken the inside bar consolidation of that candlestick and now has a very high probability of going higher than that line and thus triggering and confirming the breakout from the head and shoulders pattern...We have also reached the small symmetrical triangle hidden in the right shoulders breakout target like I said we would do in the last video. So probability highly favors we trigger this head and shoulder pattern if so the target will be close to the black box near the top of the chart. Thanks for reading *not financial advice**

A look at the XRPUSD pair almost at golden cross!Normally my xrp charts are looking at the XRPBTC pair...but with more and more exchanges now enabling the XRPUSD fiat pair I think it's important to factor that in as well. We are currently right around 49 cents but will likely be heading upward soon...you can see the price action has been consolidating in a falling wedge which most of the times break upwards...you can also see here that if we were to break up from the falling wedge at this point where we are now testing its top trendline...the breakout target price would conveniently be right at the neckline of the inverted head and shoulders pattern now forming on the chart as well..We seemed destined to trigger the inv head and shoulder pattern on the xrpbtc pair so I think the xrpusd pair will inevitably trigger its inverted head and shoulder in the near future as well. So I think probability favors XRP breaking bullishly upward from this falling wedge fairly soon as well as a golden cross happening as soon as the next day candle to 3 days from now. Overall very bullish looking indeed.

XRP Bullish during btc bear dip, #2 in market cap!XRP is looking very bullish now as it appears to have potentially flipped this yellow line it was struggling to get above from resistance to support after finally breaking above it and up and above the inside bar consolidation it was trapped in. This is a very bullish sign as it will now likely close abov this symmetrical triangle and trigger a nice bull break which will then put it above the top red line I have here on ym chart which is the neckline of the big inverted head and shoulder pattern it's currently forming. A bullish breakout of that inverted head and shoulder pattern will bring yet even more bullishness to xrp and if all of this continues to occur while the rest of the market heads downward then XRP could essentially cement itself permanently above ethereum as the number 2 crypto...One downside to xrps bull run happening now during a big bear dip in btc is that it could go parabolic here and reach its former peak against btc but not hit the $3.50 range if btc is this low...if it does go parabolic int hose conditions that would not be good because parabolic bull runs tend to usually retrace about 80%. Instead what would be preferred is for XRP to trigger this inverted head and shoulder pattern reach that target and then plateau and consolidate for awhile until the rest of the market flips bullish and has a chance to start catching back up a bit. That will ensure we still have room to continue up from there if it takes the time to consolidate and correct itself. Seeing as how both XRP and Stellar have recently had 1 day golden crosses I anticipate those 2 coins continuing to have bullish action while the majority of the rest of the market crashes. Of course this is just my opinion and not financial advice however so trust your own instincts. Thanks for reading.

Huge bullish volume on XEM 1 day chart; Testing inv h&s necklineHard not to jump in on this with that giant volume bar on XEM I say wait until we have a confirmed break above the h&s neckline though that flips the neckkline from resistance to support and solidifies it with either 2 1 day candle closes above it or another huge influx of bull volume once it crosses above the neckline...it's already done a fake out once it could attempt a second and even third fakeout. Be vigilant.

Inverse Head & Shoulders PatternI only posted this because many of you are posting incorrect charts. The inverse head and shoulders pattern is a bullish reversal pattern of a downtrend. It is NOT a bearish pattern as some of you have suggested.

Potential inv h&s breakout to consider on xlm.If this inverted head and shoulder pattern is valid, price action should climb to this price target seen here. However with the confluence of xlm haviong a golden cross on both the 1 day and 4hr charts it would probably reach this target even without a valid inverted head and shoulder pattern. just my hypotheticsl thoughts could be wrong so no financial advice.


GBP/USD Break down @weeklyThe GBP/USD break down and you can get sell @now till TP 1.15669. This TP is calculated by fibonatchi@1.618.
Any comment please put. thank you

INTU Short Setup PossiblePossible breakdown on INTU if SPY continues its downtrend. May fall below neckline and if the bounce back is weak there is a good short setup.

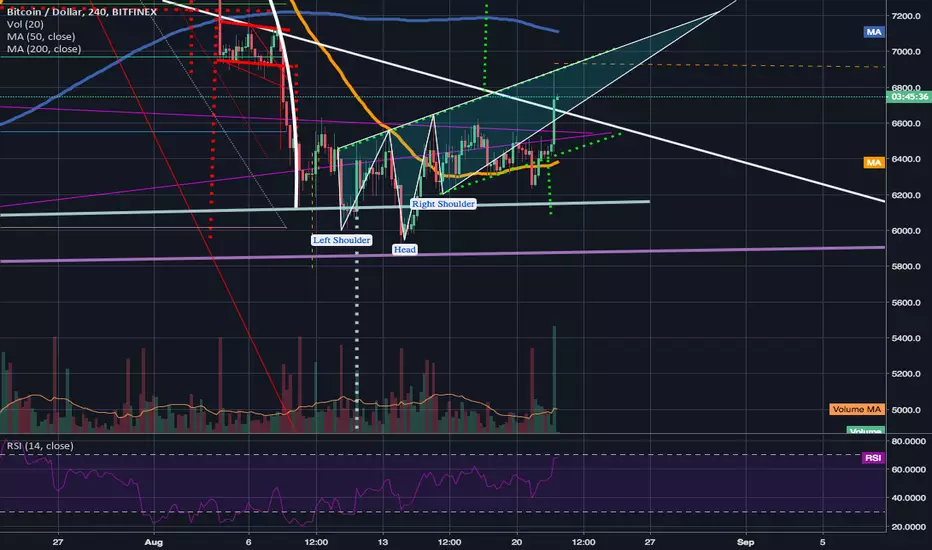
Possible Inverse H&S on 1hr Bitcoin chart, move towards 6800+ its not formed yet, so just a possible for next days with bitcoin
volume low but some moves towards 6800+ and if that can break we can target 7350 area as the pattern would complete
bless ya trades

XRP might trigger a 4hr h&s pattern; watch for volume to confirmit currently has broken the neckline of a 4hr head and shoulder pattern on the 4 hour chart so it may follow this candle up if it closes below the neckline with a confirmation candle + bear volume that could take us potentially as low as this projected target. Best to wait for this current 4hr candle to close and also to see what the followup candle does before making the decision to short. Also watch for a surge in bear volume too. It is very probable that this pattern will be triggered for a few reasons. 1. Buy the rumor sell the news of xrapid going live. Selling the news is a standard trick for a majority of traders and it would be no big shock to see them once again use that method here. 2. the daily RSI has been in bad need of a cool off ever since the initial bull surge 3. we are currently below the neckline and it is the first red candle that has broken the bottom trendline support of the ascending bull pennant. So probability does favor a breakdown here. However I think the breakdown will be very temporary and that we will hopefully see good bounce support on the 1 day chart from the 200 ma (represented here as the horizontal dotted tan line) and we should see a good enough bounce to get the price action back inside the ascending triangle pattern to avoid triggering a bart breakdown from the bear flag. We may even throw a wick down below the 1 day 200 ma to hit the drop down target of the 4 hr head and shoulders pattern but ultimately find good support on the 1 day 200ma and bounce back up and into the ascending triangle pattern before triggering the bull flags breakdown resulting in a bear trap fakeout. Just my opinion of course I could be wrong so financial advice this should not be taken as. Thanks for reading!

Inverted h&s break out target of 7230 hit. Higher high achieved!Usually right after we hit a higher high we see a lower high and while I think considering we are still finding resistance at the much larger/longer inverted head and shoulder neckline we will likely dip down for another higher low here. before we finally break the neckline of the larger inv h&s. I think odds are good if we see that higher low form that we will most certainly trigger the 1 week charts descending triangle pattern...if so we will be bullish in a very big way as long as we can stay above the 1 day charts 50ma like we have been continuing to do we should trigger that breakout. Very hopeful for what Q4 might brig in btc.

Ugliest inverted h&s I've ever seen but technically still valid.After one of the most massive bullish 4hr volume candles we've seen in a long while, We shot all the way back up to the neckline of the inverted head and shoulder pattern that never quite got invalidated but is now looking rather ugly. Had I been watching the charts when this bullish volume spike occured and saw the rejection I would have exited at the neckline as a very safe spot to then buy back in a few pips above it if it breaks out or accumulate a little more whenever it finds a resting place after getting rejected but I was unfortunately preoccupied with other things and wasn't watching the charts. Either way because of just how massive that volume candle is I have a feeling up will be the path we ultimately head. If this turns out not to be the case and we break down from here I will be prepared and may ladder out small portions but I am optimistic we will hopefully be heading up or sideways at least. The RSI on the 4hr seems to suggest we are reaching the overbought zone but I ahve yet to look at it on the 1 day chart.
Golden cross next month If BTC triggers the inverted h&s patternWe currently already have the 1 day chart's 50ma trajectory tilted upward and the 200ma tilted downward at a steep enough trajectory for a golden cross to occur the 23rd of next month. However triggering this inverted head and shoulders could lift us above 7.3k and increase the upward trajectory of the 50 for the golden cross to occur even sooner. Seeing as how all the alts are doing phenomenal right now and XRP already triggered it's inverted head and shoulder pattern and hit its target I think it's very probable that BTC will be doing the same! Good time to go long. *not financial advice*
