EJTF: 2 Hr
Possible inverse H and S on the 2 hr and 4 hr TFs. Bullish divergence can be seen developing on the RSI and price has retraced and is currently trading in the golden zone (between the 0.50 and 0.618 levels).
May be see some buying here to complete the right shoulder and move up from there to ~123.
See my previous EJ forecast here:
HEAD

EURUSD - Head and shoulders with massive risk - reward ratioEURUSD has been in bullish trend for some time now and we see perfect pattern of Head and Shoulders at the end of the bulltrend, so a reverse is expected. We have broken a few times the neckline, but went right back through it, which is called whipsaw, made only to trigger orders and stoplosses. Execute a sell order with small lot and put the stoploss at the high of the right shoulder.


EURCHF - Time for another correctionAs we can see, when we started the channel we had head and shoulders pattern which was successful, so right now we are inside a channel and we have formed another head and shoulders pattern, so if we break through the neckline, we should expect a drop as following. there are 2 supports that we have as TP . Good luck!

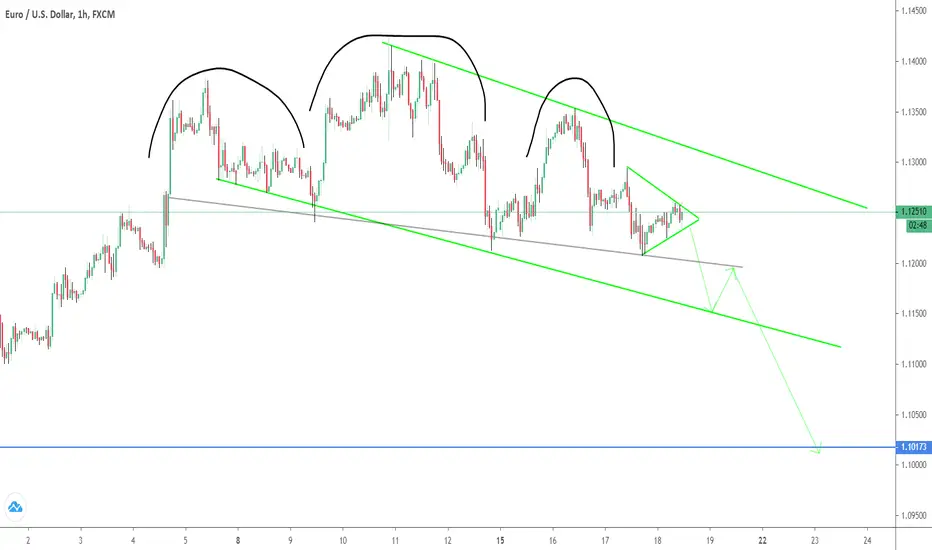
EURUSD Head & Shoulders Pattern Abtin00Hello again guys
We are seeing head and shoulders pattern in EURUSD we that can reach the target we shown on chart but the market can do anything because of that you should put STOPLOSS
Be patient and take proft guys
We are working on a VIP GROUP for our users and followers to take our analysis and tutorial for analysis every markets
Good Luck
Abtin

Probability of head and shoulder pattern formationEURJPY is more likely to form a head and shoulder pattern.
If the reverse head and shoulder pattern is created, we will have a target of 122,500.
If the pattern is not formed, the price is likely to fall to 118,395.
Signal by Yazdani

USDCAD - 1 hras you can see on elliot counter the rpice is nicely on correction phase and some how is similar to Head and Shoulders
just wait to retest the neck line and bingooooooooo

GBP/JPY Bearish Head & ShoulderKind of a late post but nonetheless I think it's a good setup.
Enjoy :D

#bitcoin - Bart it up v2#BTC will #BART
#BTC will #BART
#BTC will #BART
#BTC will #BART
#BTC will #BART
#BTC will #BART
#BTC will #BART
#BTC will #BART
#BTC will #BART
#BTC will #BART
#BTC will #BART
#BTC will #BART
#BTC will #BART
#BTC will #BART
#BTC will #BART
#BTC will #BART
#BTC will #BART
#BTC will #BART
#BTC will #BART
#BTC will #BART
#BTC will #BART
#BTC will #BART
#BTC will #BART
#BTC will #BART
#BTC will #BART
#BTC will #BART
#BTC will #BART
#BTC will #BART
#BTC will #BART
#BTC will #BART
#BTC will #BART
#BTC will #BART
#BTC will #BART
#BTC will #BART

EURGBPTF: 4
I was looking to short this pair last week; however, price moved high quickly and dropped shortly after making a H and S pattern. Currently the right shoulder could be in the process of being completed. I am looking to short and entered in as shown on the chart. Bearish divergence can also be seen on the RSI. I am expecting a large move down.

EURGBP ShortWait for the neck line to break , good risk reward ratio , till the trend reversal we do have some higher probability


GBP_USD SHORT . h4 . head and shoulders .I think In the next 2 days, gbp will make a fuss! Hurry up !!!

EURGBP Head and shoulder or not?EURGBP could create an Head and shoulder or breaks the the recent structure 🦐
–––––
Here is the Plancton0618 technical analysis, please comment below if you have any question.
The ENTRY in the market will be taken only if the condition of Plancton0618 strategy will trigger.

BTC Inversed Head & Shoulders?Potential!
Just a idea.. chart looks like it will retrace 10k barrier on higher timeframe again denied.
follow Cryptonicx for more stuff like this! <3

#Bitcoin Possible H&S in the making As per my original idea I got filled for my short!!
I was expecting a Bearish divergence to be printed but seeing nothing on rsi so far, will check other indicators, there are div printed on 3hr & smaller timeframes once we have them on HTF like 12H & 6H i will be more confident till then take profit at every 100-400$ drop
for now keeping an eye on this H&S in the making, if I got this right we caught the top :)

Expecting a super cool BUY on GOLD. H&S seems visible in FlagGOLD struggle to reach demand zone and therefore expecting a breakout at the supply zone and if it happen there will be a huge boom for GOLD. Keep an eye and only BUY if a breakout is fully confirmed.
Manage risk and open trades at your own risk as I am not an expert in the prediction. Market are meant to be move on emotions!
Any thoughts are welcome :)


Invers H&S in making on 4HHello traders,
by the look on the 4h chart, it seems very likely, we are making inverse Head & Shoulders pattern, which is maybe one of the only patterns bitcoin really follows most of the times. If thats going to work out, we should make another shoulder down to around 8750/8900 area and when price go back up to 9150/9250 and brake the neck area, we should get to at least 9700/9800. Depending on how strong this move gets at that point, if bulls are strong enough, they may try to test the 10k area again. Lets see.
Can it be, what bulls need now? Or bears will take over and take us lower? Let me know, what you think, in comments. Thank you.
This is not a trading advice!

GBP-JPY LONG (Head and shoulders)According to insta id: FX_IRI will increase the pound's trend line if it breaks

BTCUSD - Head and ShouldersA head and shoulders reversal pattern with a potential target of 8k .
8k is where is in confluence with the 200sma on the daily - currently at U$D8040
