EUR/AUDHello Traders ,i see 2 entries to continue selling if a price go down less than 1.61800 level with a retest and rejection i see its a safe entry , the scenario diffit if a price up and broke 1.63200 i expect on this case rise to 1.64300 and this a anther good entry to sell, our goals 1.60500 then 1.59000 levels . have a nice day
Daily Frame
Head_and_shoulder

XLE Nasty Setup From a technical level, the XLE is showing a potential head and shoulders setup on a monthly chart. Combine this with major bearish divergence leaves shorting this basket of stocks as the trade of the year.
Any potential good news on the Ukraine/Russia front would be devastating on a fundamental level.
Everyone is long energy. Be brave, be bold. AMEX:XLE

$COIN - Overbought but ride has just started. Going to try to keep my thoughts simple. With alot of momentum growing in the crypto world it makes perfect sense to see NASDAQ:COIN get its latest pump, especially with BTC hitting 40k+. It is with no question that NASDAQ:COIN is in a overbought scenario as the RSI shows us. We closed today with a spike of above average red volume, leading to an indecision range day after a $10+ overnight gap.
Long term, i see NASDAQ:COIN hitting $200 easily. (Inverted H/S, Break of neckline) Are the confirmations that show us our bias.
Short term, due to the gap up and clear overbought scenario on the daily.. i want to see a pullback to the 9 daily ema. I dont predict the pull back to be extreme.. buyers are relentless and any significant dip can be expected to be bought.
Use proper risk management and enjoy the ride to $200 going into 2024. Cheers.

TSLA: Pay Close Attention to These Chart Patterns (D & W charts)Today we see an important move in TSLA's share price, a break of the resistance level of its previous top at $252.75.
Now, after the breakout, we see that this area is serving as intraday support, which is in line with the principle of polarity (former supports can become future resistances and vice versa).
Since our last analysis last week, we see that the price has broken through its most important resistances, which we mentioned in our previous analysis, and is committed to a clear uptrend. The link to the latest study is below this post, as always. What’s more, after our analysis, TSLA performed a clear “Hammer” candlestick pattern above its support line, as evidenced on the chart above. According to Bulkowski’s studies, a Hammer acts as a bullish reversal roughly 60% of the time (Encyclopedia of Candlestick Charts, chapter 40: Hammer, p. 348).
What's even more interesting is that the price has thwarted a possible reversal pattern called Head and Shoulders, as we can see in detail in the chart below. By not triggering the neckline by closing a candle below $230, and reacting to the point of breaking through the top of the head, TSLA has completely rejected any bearish thesis.
Another important point that reinforces the bullish sentiment is the breaking of an important resistance on the weekly chart, breaking a bearish channel, frustrating the price's downward sequence and triggering a bullish reversal for the long term. As we see in the image below, such a pattern could be interpreted as a Bullish Flag as well.
Now, TSLA shares could reverse the long-term trend and finally turn bullish. Could it follow the example of the Nasdaq index, which made a similar pattern recently, also on the weekly chart?
QQQ chart:
It's a plausible move with a good technical basis, but as always, we need to be aware of a few risk points.
Firstly, if the price loses a lot of strength, to the point of making a bearish pattern on the weekly, closing below the resistance of the bearish channel, the bullish thesis loses strength.
Secondly, if a reversal pattern is observed on the daily, and the price loses its supports, we have a rejection of the uptrend in the medium term. Especially if the 21 EMA is lost. Although the price has breached the average a few times, at no time since November 10 have we seen a close below the 21 EMA on the daily chart. If this happens, the bullish thesis described in the analysis could be thwarted.
I'll keep you updated, so if you like the content, please support me, and follow me to receive more analysis like this, with technically grounded ideas.
Best regards,
Nathan.


FFH is going to bounce like a basketball! H&S pattern too!It appears as though FFH is showing two alternatives, an H&S breaking down, or, sideways trading in a horizontal channel, with a breakout likely happening early 2024.
A horizontal channel is a neutral chart pattern that marks investor indecision. Buyers and sellers fight, and it is only at the exit of the horizontal channel that they agree on a direction; either there are more buyers than sellers or there are more sellers than buyers; hence the strong force of the movement at the horizontal channel’s exit.
This train has left the station.

GBPUSDAs a student in the financial markets, learning about the market is interesting and it's a long journey to begin with. GBPUSD having a accumulation, manipulation and now waiting for a distribution. Will GBPUSD make a move early next year along side with USA rate cuts? Let's see what year 2024 lead us to
I don't post much as I'm not a signal provider nor a financial advisor. But one thing is that learning how the market behaviour, reactions and structure, it's simply interesting to me. If you have any thoughts on GBPUSD, let me know down the comment area, let's discuss about it.
This will be my last post and trade of the year 2023 holding it till next year 2024. Wishing you guys out there trade safe and happy new 2024.

EUR/CAD ↘️ Short Trade setup ↘️Hello Everyone 🙋🏽♂️
Head % Shoulders
💲 Entry Point : 1.45731
🟢 TP 1.43788 🔴 SL 1.46688
We are not responsible of any losses for anyone, our trades are profitable more for long terms and we take losses as everyone,
manage your lot size as well and your SL and TP and my opinion is 0.01 lot for each 500 $.
Don't forget to hit the like bottom and write a comment to support us.
Follow us for more 🙋🏻♂️
Best Regard / EMA Trading .
Disclaimer:
----------------
It's not a financial advise, As everyone we take losses sometime but for long term trading we are profitable traders, so manage your account well with SL and TP and your lot size to keep your account safe and stay in the market

Surprised no one caught this Head n shoulders formed; buy the dip and should meet back at the resistance.. watch for reversals happens

My investment stockPlease note this stock have my portfolio stock
Very bulish on this stock
Reverse header and shoulder pattern
No recommendation for buy and sell
Fundamentals strong stock

EURCHF - Inverted Head and ShouldersHi Traders !
On The Daily Time Frame, The EURCHF Price Reached a Support Level (0.94357 - 0.94176)
The Price Formed an Inverted Head and Shoulders Pattern.
Currently,
The Neckline is Broken.
So I Predict a Bullish Move📈.
Let's Wait for Retest...
-----------
TARGET: 0.95940🎯

🔥 PEPE Inverse Head & Shoulders: Bulls Be Ready!PEPE has been consolidating all week. The most likely outcome is that PEPE will simply continue to go up over the next few weeks, but I want to prepare in case it doesn't.
In case that PEPE has topped (and BTC will go down), I'm looking at an inverse head & shoulders pattern to potentially play out over the next few months. My risky entry will be around the 82 level (June lows) with a target at 440.
Patience is key on this trade. If PEPE will make a new high in the next few weeks this signal will be cancelled.

Very Bullish On montly Chart.In 2024 It can show multibagger returns, but it will be 80% Tukka. I would definitely play the bet.

🔥 Bitcoin Inverse Head & Shoulders Pattern: Bulls Taking Power In yesterday's analysis I argued that Bitcoin's bull-trend is far from over. The short-term trend is still in favor of the bulls, but only as long as the bottom support held.
As of yesterday, BTC has successfully bounced from the bottom support and is currently underway of forming an inverse head & shoulders pattern. The pattern has not yet been confirmed, so please wait for a move above 42,150$ to confirm the break out.
In case of a break out, I'm looking at the most recent local top as my primary target: 44,500$.

USD/CAD ⬆️ Long Trade setup ⬆️Hello Everyone.
head & shoulders + descending channel
💵 Entry Point : 1.35689
✔️ TP1 1.35986 ✔️ TP2 1.36268
❌ SL 1.35404
Please support us with like & comment & Follow
Disclaimer
---------------
Trading is risky we all take loses
your responsibility is to not take more than 1% to 2% loss per trade and double your profits.

🚀 MNT Skyrockets: From Head and Shoulders to Parabolic PUMP 🚀 In the thrilling realm of crypto, Moneta (MNT) has orchestrated a captivating comeback, executing a grand Head and Shoulders reversal pattern beneath its all-time low. Currently, the charts portray a mesmerizing ascent as MNT dances within an ascending channel, resembling the onset of a parabolic rise.
Chart Analysis: Head and Shoulders Resurgence Leads to Parabolic Momentum
Head and Shoulders Triumph:
Moneta orchestrated a substantial Head and Shoulders pattern beneath its all-time low, signaling a powerful reversal in market sentiment.
The completion of this pattern acted as a catalyst for a profound bullish upswing.
Ascending Channel Dynamics:
MNT is currently navigating within the confines of an ascending channel, reflecting a sustained bullish momentum.
Ascending channels often precede parabolic movements, suggesting the potential for a robust upward surge.
Anticipated Scenarios: Ascending to New Heights
Parabolic Growth Anticipation:
The presence of an ascending channel is indicative of an accelerated price movement.
Traders and enthusiasts are eagerly awaiting whether Moneta is poised for a parabolic ascent, possibly reaching new heights.
Strategic Approaches: Riding the Wave of Momentum
Entry Strategies:
Traders might consider strategic entry points based on the ascending channel dynamics.
Given the potential for parabolic movement, early entry with proper risk management could be a key strategy.
Monitoring Critical Levels:
Critical levels within the ascending channel should be closely monitored for potential breakout or breakdown scenarios.
Continuous assessment of MNT's price action is crucial to adapt to changing market conditions.
Conclusion: Moneta's Resurgence into the Stratosphere
Moneta's journey from a Head and Shoulders reversal to an ascending channel paints a compelling narrative of resilience and bullish enthusiasm. As MNT flirts with the prospect of a parabolic surge, traders and investors are on the edge of their seats, eagerly watching whether Moneta will carve its path to new heights.
🚀 Head and Shoulders Revival | 📈 Navigating the Ascending Channel | 🌌 Envisioning Parabolic Heights
❗See related ideas below❗
Share your insights on Moneta's exciting developments, and join the conversation on the potential for a parabolic rise in the near future. 💚🚀💚

Pullback scenarios for longI see two scenario playing out for a long term bullish trade.
Bias: Bullish
Why: Neckline breakout of inverted head & shoulders with a positive earning gap.
Scenario A: Price action is currently showing a bullish flag after the huge earnings gap up. We can see price retrace to test the end of the gap. With a high possibility of bouncing and breaking the bull flag structure to a new high.
Note: 12/8 ended with a green volume day above average breaking the latest downtrend volume structure.
RSI is still show PDD in an overbought scenario, most severe since Aug/Sep 2019'.
MACD is turning to a SELL signal at the top of the indicator.
Given the indication for a dire pull back...
Scenario B: Price action retraces to fill gap, bouncing to retrace back to the I-H&S neckline or 200 EMA before a rocket launch to $170 price target.
Thoughts?
Pure speculation. Trade responsibly.

Head and Shoulder pattern in Polycab on hourly timeframeHead and Shoulder pattern in Polycab on hourly timeframe chart. A breakout is imminent as the overall tone of the market is bullish. A short term swing trade is on.
Targets are: 1. depth of right shoulder, 2. depth of the head.
Stop Loss: close below previous day low (for F&O), low of right shoulder for cash trades.
PS: I am holding a long position.

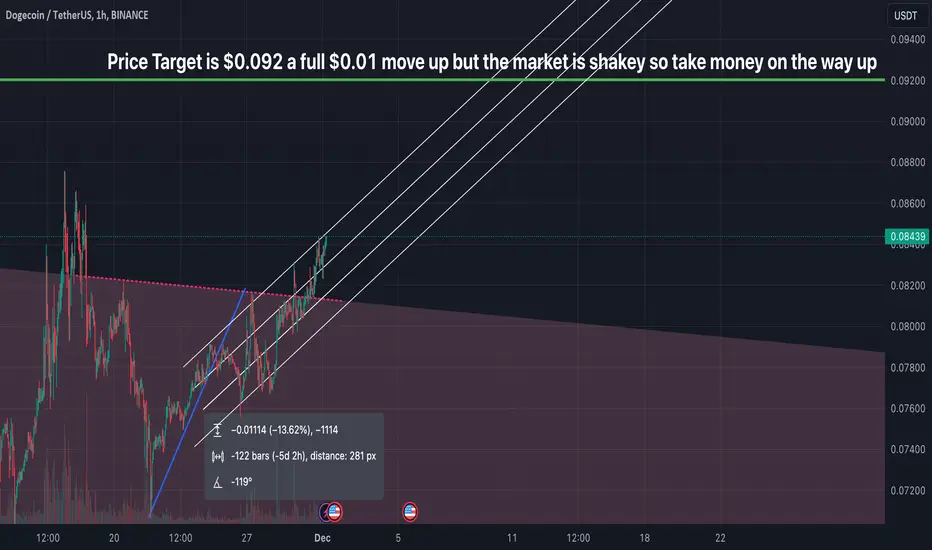
Doge Innverse H&S Target $0.092 and breakoutI was originally was tracking doge for a H&S pattern based on how bitcoin goes and if would force doge back into the downtrend and they I stumbled into this play because that and right now it's been looking strong and keeping in this uptrend channel.
Currently sitting. at$0.084 with 8 cents (80%+ left to play out)
KEEP BTC CHART OPENS AND WATCH FOR SWINGS AS PATTERNS USUALLY MEAN NOTHING DURING THOSE MOMENTS. CHEERS
JPN225, Short setup, Head and Shoulder🚩 New Signal Notification
📣 Attention Traders! 📈🔍
🔹 JPN225, 8H, head and shoulder Short setup🔹
JPN225 broke out the neck line of head and shoulder yesterday. It is now further going to next support levels as shown in chart, 32505 and 32146.
By Head and Shoulder target measurement, possible reach 32430 too.
Resistance at 33103 the neck line.
Good luck!

near supply zone1) Weekly chart analysis
2) header and shoulder patterns completed in chart
3) decent volume in chart
4) volume meeting chart header shoulder pattern
5) stock at supply zone breakout not done
6) supply zone 2200
7) demanda zone 1900
8) The demand zone is major support for the stock
9) no recomandation for buy and sell

#OIL potential reverse Head and Shoulder formationHello dear traders. Let's take a look at the oil chart for today and identify the potential Reverse Head and Shoulders chart pattern formation.
As the price reacts to the bearish 4-hour timeframe channel , it seems to be forming a Reverse H&S pattern, which could potentially result in a bullish outcome for the price in the coming days.
We observe good synchronicity between the two shoulders around the head, with approximately the same amount of time taken to form the pattern. Additionally, the price has established a well-defined neckline, which, in the case of an upside breakout, can act as support thereafter.
As you may know, the H&S chart pattern is considered complete once there is a valid penetration of the neckline ; until then, the pattern is considered tentative.
If you've found this analysis helpful, please take a moment to like, comment, or share your thoughts with me.

Doge Pay Day if BTC can't break 38LBreak above the long-term trendline is always exciting, but if bitcoin goes down you can be certain this turns into a head and shoulders and back down so will doge for a huge pay day
you can see my other daily chart on bitcoin that relates to this play.
